. 2017 Aug 22;7(1):9039.
doi: 10.1038/s41598-017-08324-z.

The molecular chaperones DNAJB6 and Hsp70 cooperate to suppress α-synuclein aggregation

Affiliations

The molecular chaperones DNAJB6 and Hsp70 cooperate to suppress α-synuclein aggregation

Francesco A Aprile et al. Sci Rep. .

Erratum in

Abstract

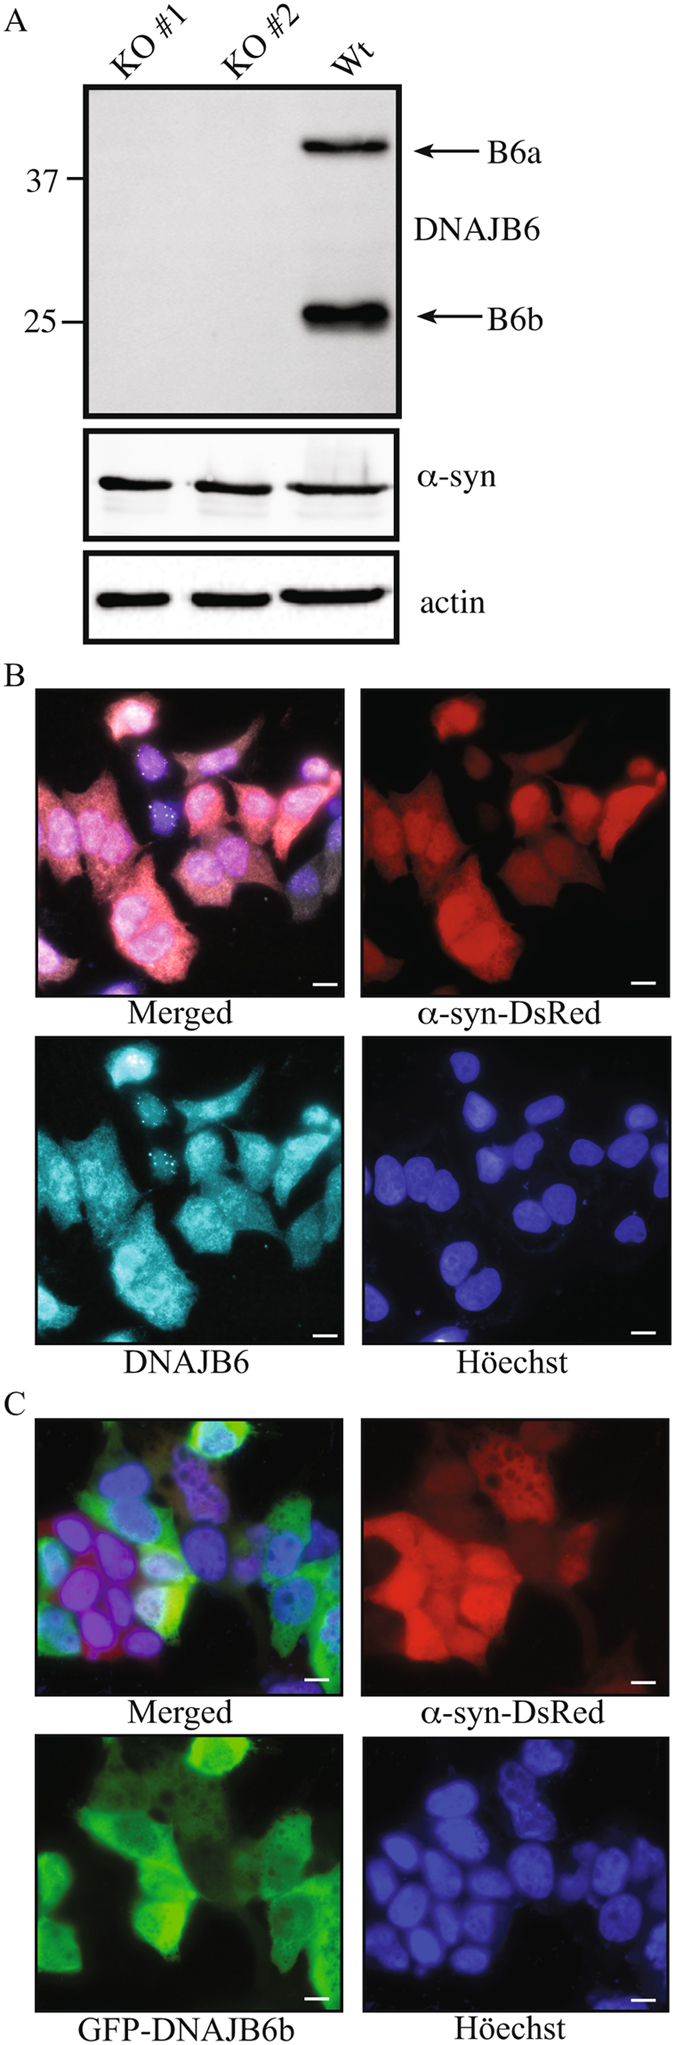
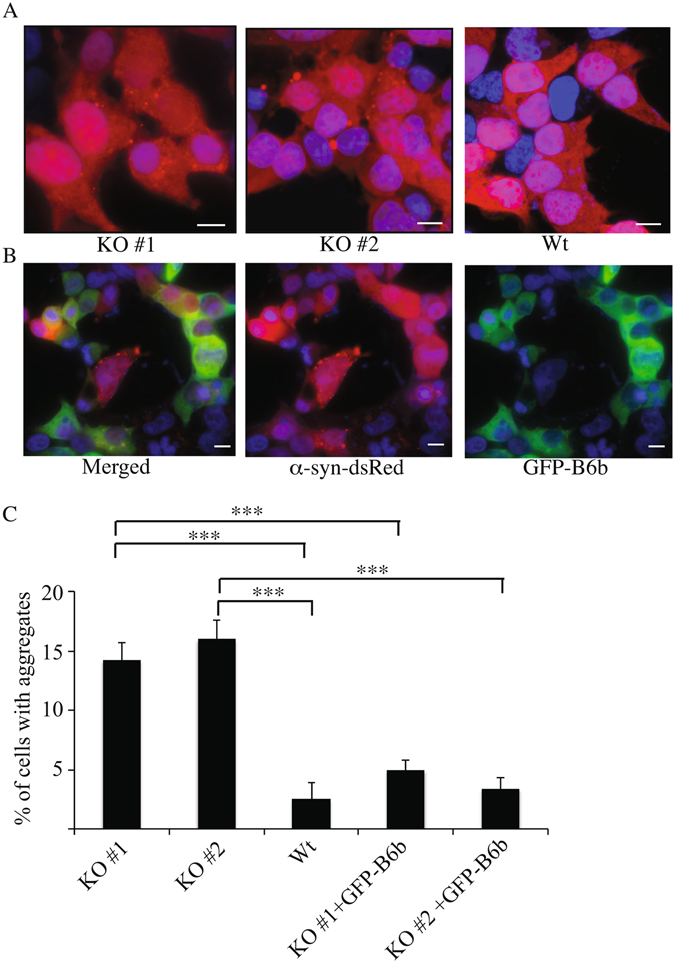
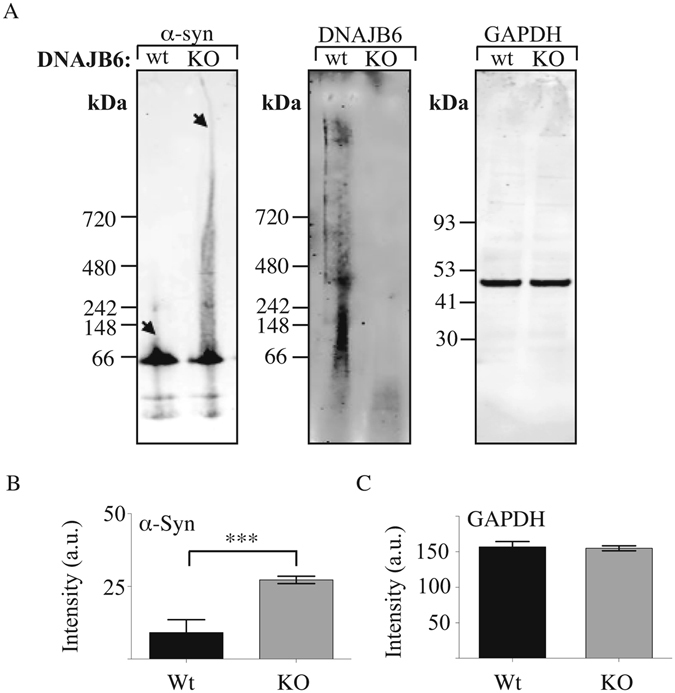
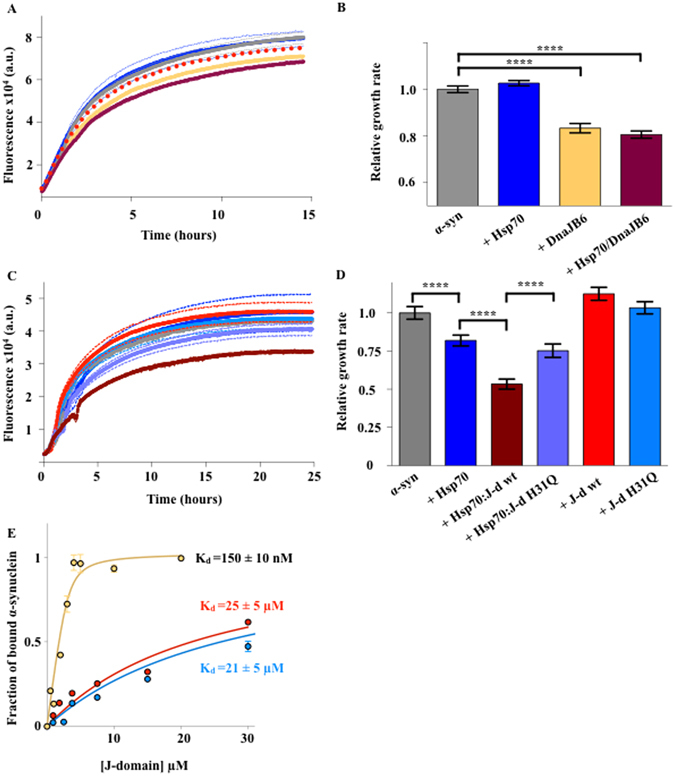
A major hallmark of Parkinson's disease (PD) is the presence of Lewy bodies (LBs) in certain neuronal tissues. LBs are protein-rich inclusions, in which α-synuclein (α-syn) is the most abundant protein. Since these inclusions are not present in healthy individuals, despite the high concentration of α-syn in neurons, it is important to investigate whether natural control mechanisms are present to efficiently suppress α-syn aggregation. Here, we demonstrate that a CRISPR/Cas9-mediated knockout (KO) of a DnaJ protein, DNAJB6, in HEK293T cells expressing α-syn, causes a massive increase in α-syn aggregation. Upon DNAJB6 re-introduction into these DNAJB6-KO HEK293T-α-syn cells, aggregation is reduced to the level of the parental cells. We then show that the suppression of α-syn aggregation is dependent on the J-domain of DNAJB6, as the catalytically inactive protein, which carries the H31Q mutation, does not suppress aggregation, when re-introduced into DNAJB6-KO cells. We further demonstrate, that the suppression of α-syn aggregation is dependent on the molecular chaperone Hsp70, which is consistent with the well-known function of J-domains of transferring unfolded and misfolded proteins to Hsp70. These data identify a natural control strategy to suppress α-syn aggregation and suggest potential therapeutic approaches to prevent or treat PD and related disorders.


Conflict of interest statement

The authors declare that they have no competing interests.

Figures

Figure 1
Figure 1
Expression and KO of DNAJB6 in HEK293T-α-syn-DsRed cells. (A) Western blot depicting KO of DNAJB6 expression in α-syn-DsRed HEK293T clone 1 and 2, as analyzed by probing the membrane with anti-DNAJB6 and anti-α-syn antibodies, respectively, as well as RDye fluorescently labeled secondary antibodies. (B) Immunocytochemistry showing expression of the endogenous DNAJB6a and DNAJB6b forms in α-syn-DsRed HEK293T cells. Cells were stained with 1st anti-DNAJB6 and 2nd anti-rabbit dylight 649 antibodies. (c) Flourescence microscopy displaying expression and localization of GFP-DNAJB6 in transfected HEK293T-α-syn-DsRed cells. Scalebar: 10 μM.
Figure 2
Figure 2
KO of DNAJB6 causes increased aggregation of α-syn in HEK293T-α-syn-DsRed cells. (A) Representative pictures showing aggregates (red puncta) in α-syn-DsRed KO clone 1 and 2 relative to parental α-syn-DsRed-HEK293T cells. (B) Rescue experiment showing that aggregation is suppressed in KO cells transfected with GFP-DNAJB6b. (C) Quantification of aggregation in KO compared to parental cells and KO cells transfected with GFP-DNAJB6 (n = 3). Statistical analysis was performed by one-way ANOVA. ***P < 0.001. Scalebar: 10 μM.
Figure 3
Figure 3
Western blots of native PAGE on soluble proteins in WT and DNAJB6 KO cells. (A) From left to right, representative western blots probed against α-synuclein and DNAJB6. As loading control, same samples were also analysed by SDS-PAGE and probed against the protein GADPH. (B) Densitometry analysis of the western blots probed against α-synuclein (n = 5) and (C) Densitometry analysis of the western blots probed against GADPH (n = 5). Statistical analysis was performed by one-way ANOVA. ***P < 0.001.
Figure 4
Figure 4
Increased aggregation caused by DNAJB6 KO is dependent on the catalytic function of the DnaJ domain. (A) Quantification of aggregation in KO cells transfected with GFP-DNAJB6 wild-type expression plasmid relative to KO cells transfected with GFP-DNAJB6-H31Q expression plasmid (n = 3). (B) Quantification of aggregation in WT and KO cells incubated with Hsp70 inhibitor VER-155008 at 10 uM for 2 hours, compared to cells incubated with vehicle control (n = 3). Statistical analysis was performed by One-Way ANOVA. *P < 0.05, **P > 0.01. (C) Representative pictures despicting that wt DNAJB6b but not H31Q mutant DNAJB6b suppress α-syn aggregation by flourescnece microscopy. (D) Representative pictures demonstrating that increased number of α-syn aggregates were observed when the α-syn-DsRed HEK293T cells were incubated with the HSP70 inhibitor VER-155008 at 10 uM for 2 hours. Scalebar: 10 μM.
Figure 5
Figure 5
Effect of DNAJB6 on the aggregation of α-syn. (A) Seeded aggregations of α-syn alone (grey) or in the presence of either 0.5 µM Hsp70 (blue), 0.15 µM DNAJB6 (yellow), or 0.4 µM Hsp70 and 0.1µM DNAJB6 (maroon). Individual values are the mean of four independent experiments. The red dashed line is the sum of the concentration-corrected effects derived from the blue and yellow lines, which corresponds to the theoretical aggregation profile in the presence of 0.4 µM Hsp70 and 0.1 µM DnaJB6 if their effect was simply additive. (B) Bar plot of the initial velocities of the aggregation reactions in (A) normalised on the value of α-syn alone. (C) ThT aggregation experiments in seeding conditions of α-syn in the absence (grey) or in the presence of either 0.5 µM Hsp70 (blue), wt J-domain (red), H31Q J-domain (cyan), Hsp70:wt J-domain (maroon) or Hsp70:H31Q J-domain (violet). (D) Bar plot representing the initial growth rates of aggregation from panel (C) normalised on the value of α-syn alone. (E) Fluorescence binding assay of DnaJB6 (yellow), wt J-domain (red), or H31Q J-domain (cyan), to Alexa488-α-synuclein. The apparent Kds of binding are reported on the side of each curve. Statistical analysis was performed by one-way ANOVA with post-multiple comparison (99% CI, *P ≤ 0.05, **P ≤ 0.01, ***P ≤ 0.001, ****P ≤ 0.0001).

References

    1. Goedert M, Spillantini MG, Del Tredici K, Braak H. 100 years of Lewy pathology. Nat Rev Neurol. 2013;9:13–24. doi: 10.1038/nrneurol.2012.242. - DOI - PubMed
    1. Hansen C, Li JY. Beyond alpha-synuclein transfer: pathology propagation in Parkinson’s disease. Trends Mol Med. 2012;18:248–255. doi: 10.1016/j.molmed.2012.03.002. - DOI - PubMed
    1. Vekrellis K, Xilouri M, Emmanouilidou E, Rideout HJ, Stefanis L. Pathological roles of alpha-synuclein in neurological disorders. Lancet Neurol. 2011;10:1015–1025. doi: 10.1016/S1474-4422(11)70213-7. - DOI - PubMed
    1. Waxman EA, Giasson BI. Molecular mechanisms of alpha-synuclein neurodegeneration. Biochim Biophys Acta. 2009;1792:616–624. doi: 10.1016/j.bbadis.2008.09.013. - DOI - PMC - PubMed
    1. Spillantini MG, et al. Alpha-synuclein in Lewy bodies. Nature. 1997;388:839–840. doi: 10.1038/42166. - DOI - PubMed

Publication types