. 2017 Aug 22;7(1):9132.
doi: 10.1038/s41598-017-09084-6.

Taxonomic bias in biodiversity data and societal preferences

Affiliations

Taxonomic bias in biodiversity data and societal preferences

Julien Troudet et al. Sci Rep. .

Abstract

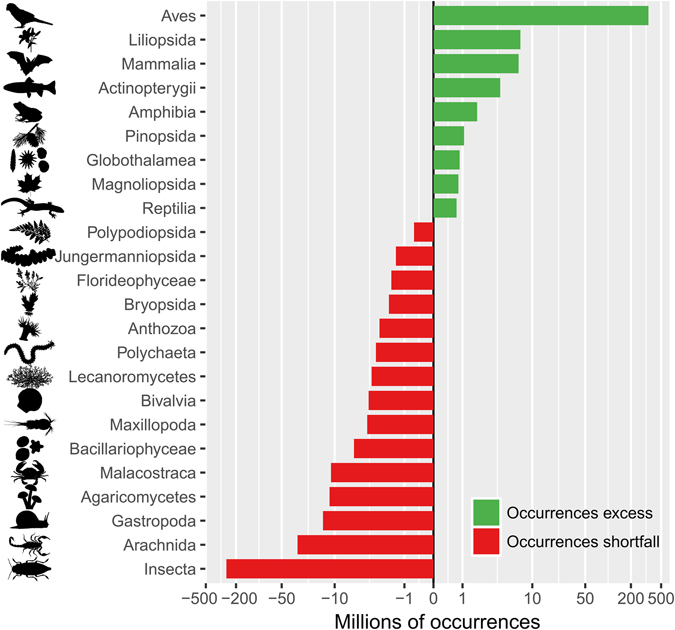
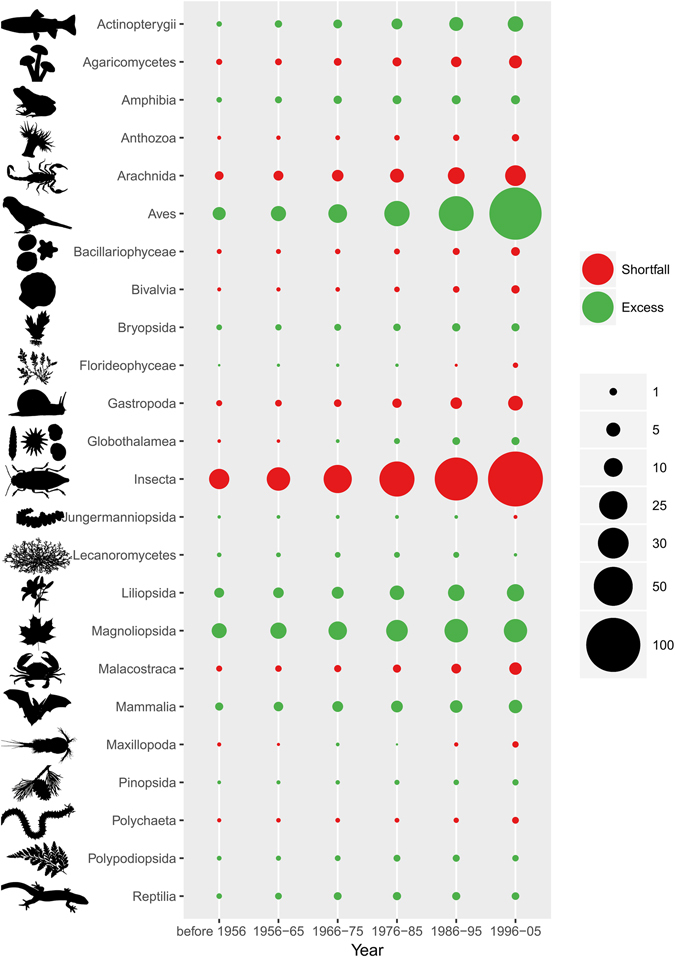
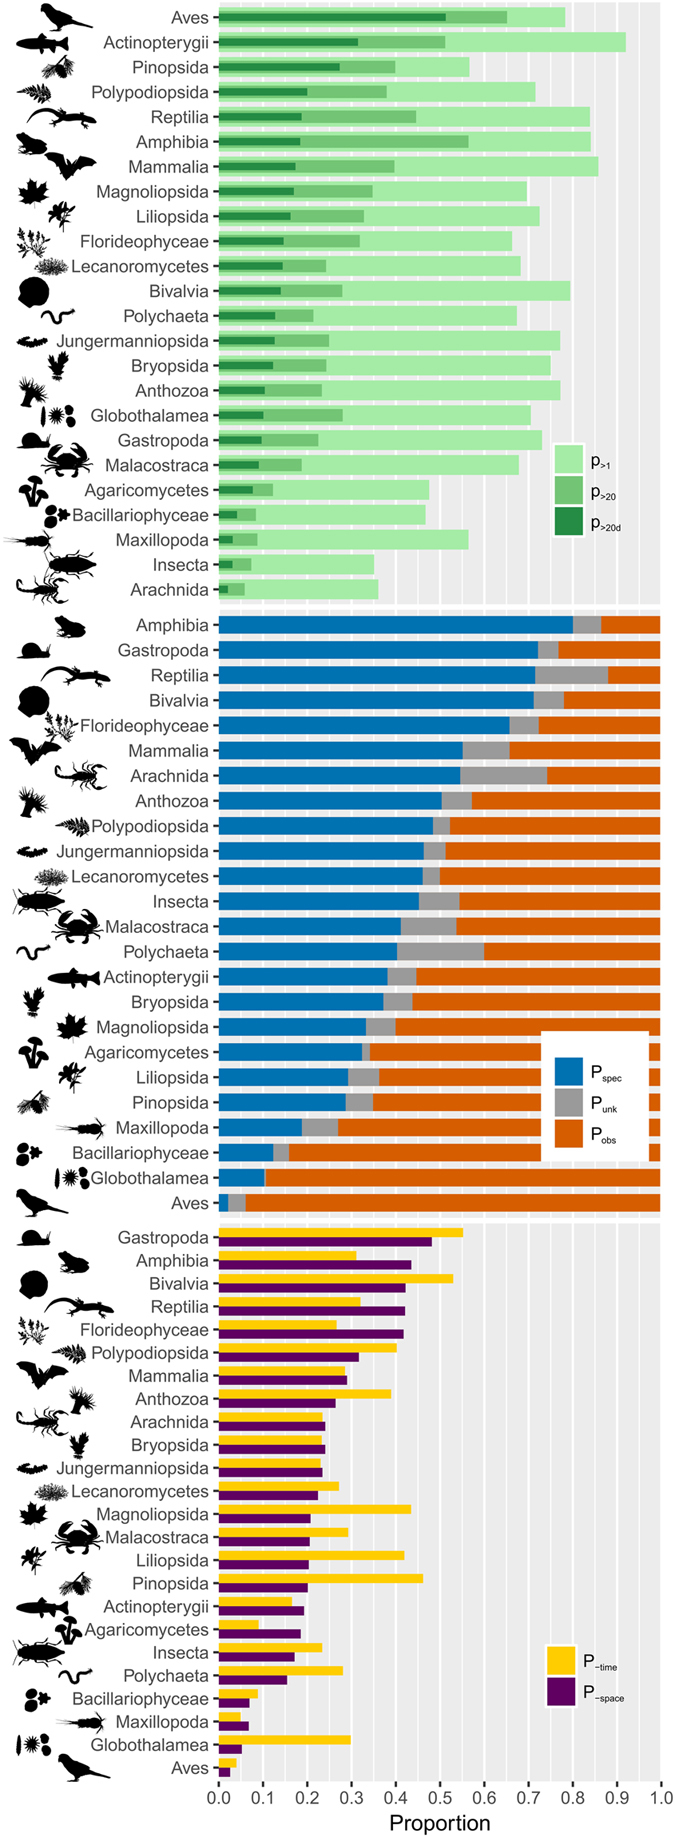
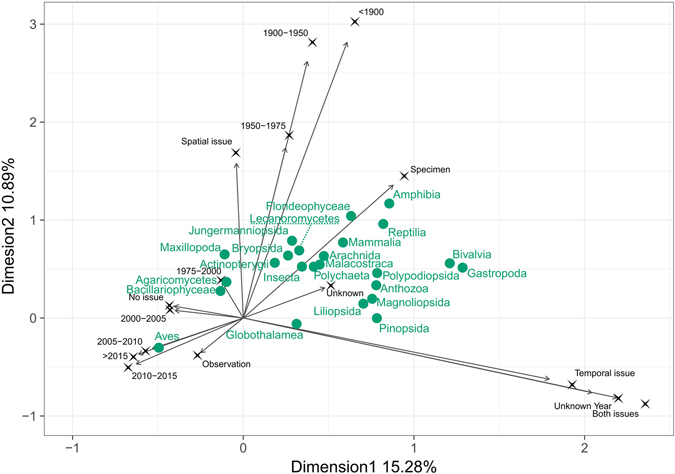
Studying and protecting each and every living species on Earth is a major challenge of the 21st century. Yet, most species remain unknown or unstudied, while others attract most of the public, scientific and government attention. Although known to be detrimental, this taxonomic bias continues to be pervasive in the scientific literature, but is still poorly studied and understood. Here, we used 626 million occurrences from the Global Biodiversity Information Facility (GBIF), the biggest biodiversity data portal, to characterize the taxonomic bias in biodiversity data. We also investigated how societal preferences and taxonomic research relate to biodiversity data gathering. For each species belonging to 24 taxonomic classes, we used the number of publications from Web of Science and the number of web pages from Bing searches to approximate research activity and societal preferences. Our results show that societal preferences, rather than research activity, strongly correlate with taxonomic bias, which lead us to assert that scientists should advertise less charismatic species and develop societal initiatives (e.g. citizen science) that specifically target neglected organisms. Ensuring that biodiversity is representatively sampled while this is still possible is an urgent prerequisite for achieving efficient conservation plans and a global understanding of our surrounding environment.


Conflict of interest statement

The authors declare that they have no competing interests.

Figures

Figure 1
Figure 1
Taxonomic bias in biodiversity occurrence data. The vertical line at x = 0 depicts the ‘ideal’ number of occurrences per class, where each class is sampled proportionally to its number of known species. Green and red bars show the classes that are over- and under-represented in the GBIF mediated database compared to this ‘ideal’ sampling, respectively. Insects lack >200 millions occurrences and birds have an excess of >200 millions occurrences compared to an unbiased taxonomic sampling. Because birds and insects are greatly over- and under-represented, respectively, an inverse hyperbolic sine transformation was used for the x-axis.
Figure 2
Figure 2
Evolution over time of the taxonomic bias for each class. The larger the circle, the higher the deviation from I, the ‘ideal’ number of occurrences per class if no taxonomic bias is observed. Red dots indicate negative deviations (i.e. shortfall in occurrences = under-represented classes); green dots indicate positive deviations (i.e. excess of occurrences = over-represented classes).
Figure 3
Figure 3
Biodiversity occurrences recorded in GBIF between 1900 and 2006. For each curve, the number of occurrences was plotted yearly. Top: black = all 24 classes considered together, yellow = Aves; Middle: yellow = Magnoliopsida, blue = Insecta, green = Liliopsida; Bottom: green = Actinopterygii, yellow = Mammalia, light blue = Reptilia, dark blue = Amphibia, orange = Florideophyceae, purple = Globothalamea.
Figure 4
Figure 4
Taxonomic heterogeneity in sampling, occurrence data origin and quality for 24 taxonomic classes. Top: Proportion of species per class recorded in GBIF with at least one occurrence (light green: p>1), with more than 20 occurrences (green: p>20), and with more than 20 spatially distinct occurrences (i.e. “decently” sampled – dark green: p>20d). For all classes, except Aves, less than 1/3 of all species are “decently” sampled. Classes are ranked according to their proportion of “decently” sampled species. Middle : Occurrence origin (basisOfRecord) for each class. Some classes like Amphibia have a high proportion of occurrences based on specimens (blue: living or preserved specimen, material samples or fossils), whereas others like Aves have a majority of occurrences based on observation (orange: machine or human observation, literature). Grey bars show occurrences where the record basis is unknown. Classes are ranked according to their proportion of specimen-based occurrences. Bottom : Data incompleteness. Proportion of occurrences with spatial (purple) or temporal (yellow) inaccuracies for each class. Spatial inaccuracy corresponds to an occurrence lacking coordinates or tagged has having geospatial issues by GBIF. Temporal inaccuracy corresponds to a sampling event with no specified month or year. Classes are ranked according to their proportion of occurrences with spatial issues.
Figure 5
Figure 5
Relation between age, origin and quality of the occurrence data for 24 taxonomic classes. Graph showing the first two axes of a Multiple Correspondence Analysis (MCA) performed on 5 million random occurrences. Labels in black represent the categories considered for all occurrences. Classes’ names (in green) are placed at the average position of the class occurrences. Occurrence age contains eight time intervals and an Unknown Year category; data origin contains three categories: Specimen for specimen-based occurrences, Observation for observation-based occurrences, and Unknown for unknown origins; data quality contains four categories: Temporal issue for the lack of year or month, Spatial issues for the lack of coordinates, Both issues and No issue.

References

    1. Díaz S, Fargione J, Chapin F, Tilman D. Biodiversity loss threatens human well-being. PLoS Biol. 2006;4 doi: 10.1371/journal.pbio.0040277. - DOI - PMC - PubMed
    1. Cardinale B, et al. Biodiversity loss and its impact on humanity. Nature. 2012;486:59–67. doi: 10.1038/nature11148. - DOI - PubMed
    1. Gascon C, et al. The importance and benefits of species. Curr. Biol. 2015;25:R431–R438. doi: 10.1016/j.cub.2015.03.041. - DOI - PubMed
    1. Mace GM, Norris K, Fitter AH. Biodiversity and ecosystem services: a multilayered relationship. Trends Ecol. Evol. 2012;27:19–26. doi: 10.1016/j.tree.2011.08.006. - DOI - PubMed
    1. Dirzo R, Raven P. Global state of biodiversity and loss. Annu. Rev. Env. Resour. 2003;28:137–167. doi: 10.1146/annurev.energy.28.050302.105532. - DOI

Publication types

LinkOut - more resources