. 2017 Aug 22;7(1):9084.
doi: 10.1038/s41598-017-09298-8.

Ecological and evolutionary consequences of alternative sex-change pathways in fish

Affiliations

Ecological and evolutionary consequences of alternative sex-change pathways in fish

C Benvenuto et al. Sci Rep. .

Abstract

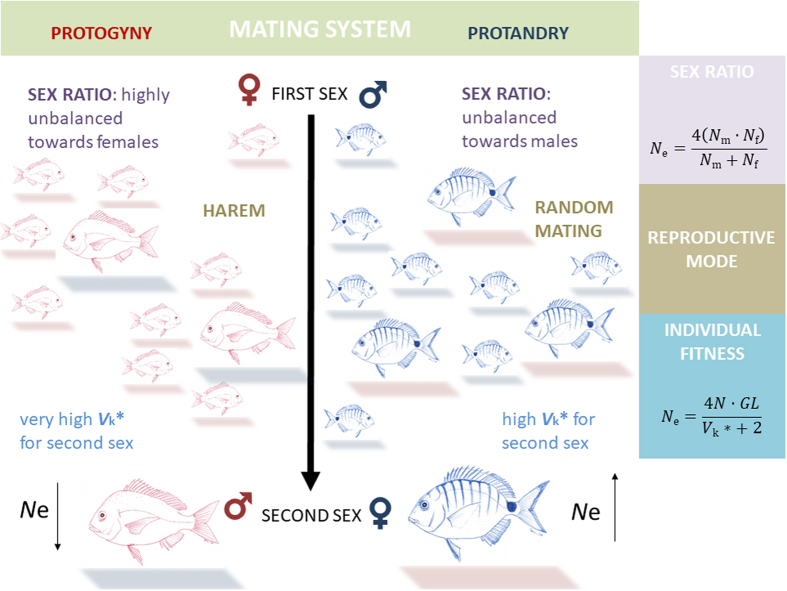
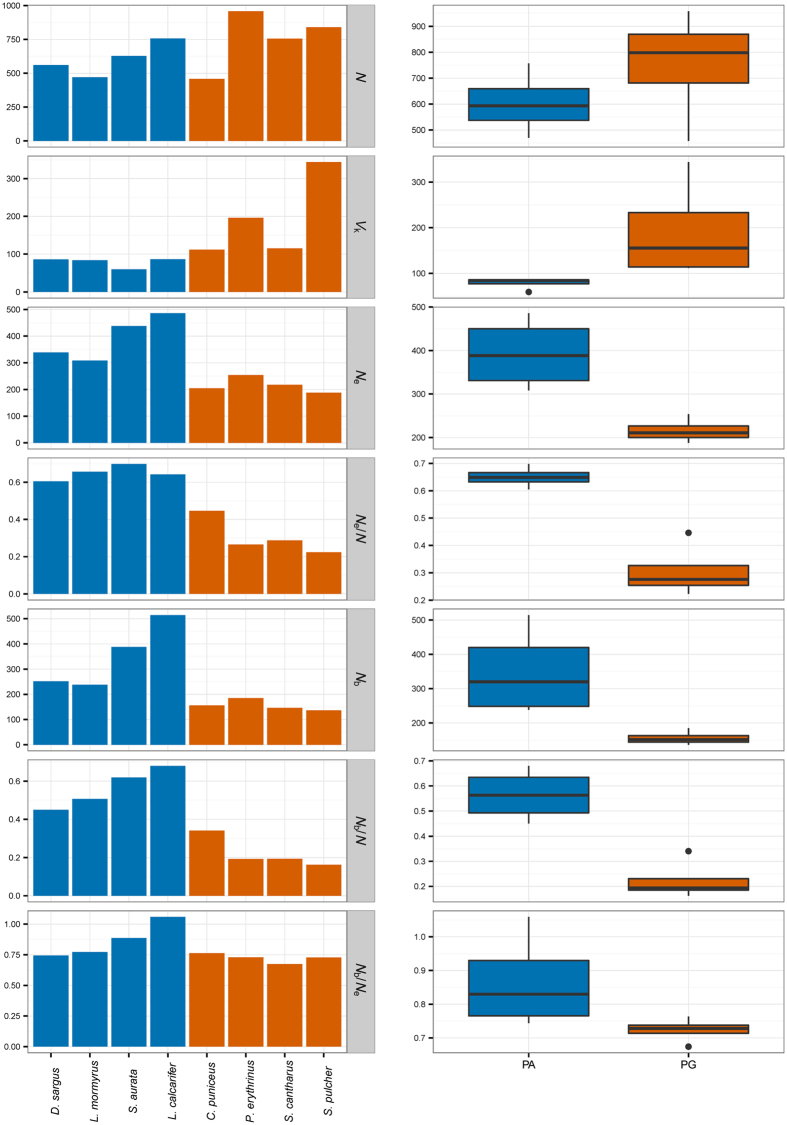
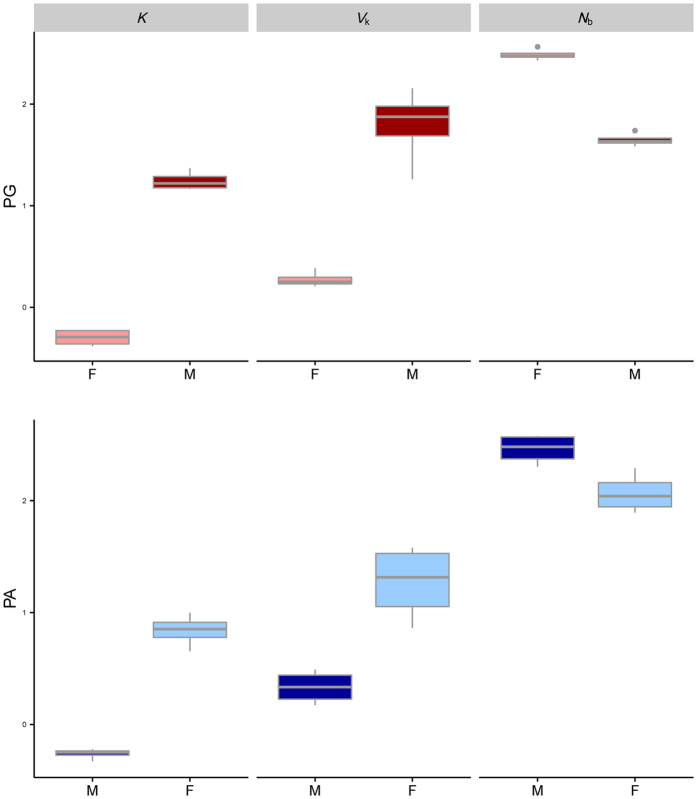
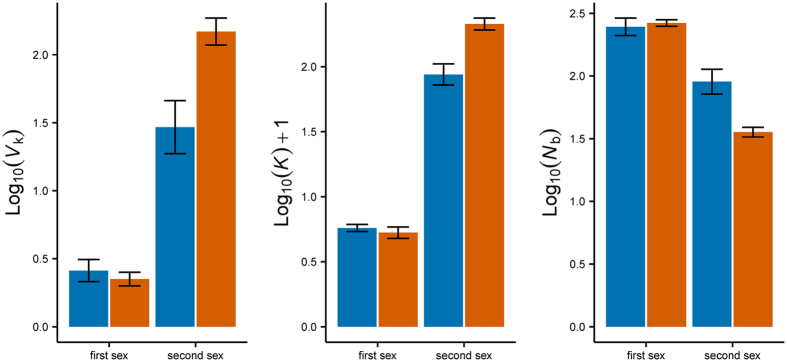
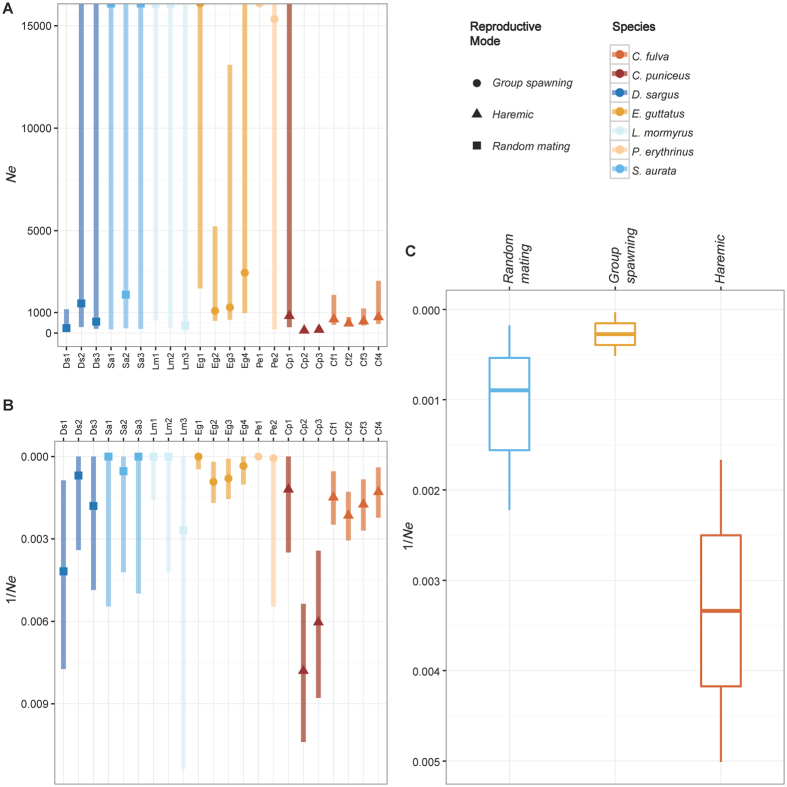
Sequentially hermaphroditic fish change sex from male to female (protandry) or vice versa (protogyny), increasing their fitness by becoming highly fecund females or large dominant males, respectively. These life-history strategies present different social organizations and reproductive modes, from near-random mating in protandry, to aggregate- and harem-spawning in protogyny. Using a combination of theoretical and molecular approaches, we compared variance in reproductive success (V k*) and effective population sizes (N e) in several species of sex-changing fish. We observed that, regardless of the direction of sex change, individuals conform to the same overall strategy, producing more offspring and exhibiting greater V k* in the second sex. However, protogynous species show greater V k*, especially pronounced in haremic species, resulting in an overall reduction of N e compared to protandrous species. Collectively and independently, our results demonstrate that the direction of sex change is a pivotal variable in predicting demographic changes and resilience in sex-changing fish, many of which sustain highly valued and vulnerable fisheries worldwide.


Conflict of interest statement

The authors declare that they have no competing interests.

Figures

Figure 1
Figure 1
Interplay among individual fitness, life-history traits and population dynamics. Multiple factors affect effective population size (N e), including many driven by the mating context of the population. The exemplified protogynous species is drawn in red and the protandrous one in blue; shadows indicate the sex of individuals at any point during their lives (red for females; blue for males). In the equations: N m = number of adult males; N f = number of adult females; N = total number of adults in the population; GL = generation length; V k* = variance in individual lifetime reproductive success.
Figure 2
Figure 2
Graphical representation of some key population parameter estimates (obtained with AgeNe) by individual species (panel a) and mating system (panel b); protandry in blue vs. protogyny in red. N: estimated number of individuals in the population (census size); V k*: lifetime variance in reproductive success; N e: effective population size; N b: effective number of breeders per year. Key ratios (N e/N, N b/N and N b/N e) are also represented.
Figure 3
Figure 3
Graphical representation of some annual key parameter estimates (obtained with AgeNe) in each life history strategy, per sex. k¯: annual mean number of offspring; V k: annual variance in reproductive success; N b: annual effective number of breeders. Values are log10 transformed to improve visualization. Protandry in blue (panel a); protogyny in red (panel b); lighter colour: females - F; darker colour: males - M.
Figure 4
Figure 4
Interaction plots of some annual key parameter estimates (obtained with AgeNe) in each life history strategy per sex. k¯: annual mean number of offspring; V k: annual variance in reproductive success; N b: annual effective number of breeders. Values are log10 transformed to improve visualization. Protandry in blue; protogyny in red.
Figure 5
Figure 5
Effective population size (Nˆe) estimates, obtained with LDNe for multiple populations of the seven species under study. Bars in the tones of blue: protandrous species; bars in the tones of orange: protogynous species. (A) Nˆe values (up to infinite); (B) 1/Nˆe (note the reverse y axis as an aid to visualize Nˆe values - higher 1/Nˆe values imply lower Nˆe); (C) 1/Nˆe (reverse y axis) by reproductive mode.

References

    1. Policansky D. Sex change in plants and animals. Annu. Rev. Ecol. Evol. Syst. 1982;13:471–495. doi: 10.1146/annurev.es.13.110182.002351. - DOI
    1. Shapiro DY. Differentiation and evolution of sex change in fishes. Bioscience. 1987;37:490–497. doi: 10.2307/1310421. - DOI
    1. Warner RR. Sex change in fishes: hypotheses, evidence, and objections. Environ. Biol. Fishes. 1988;22:81–90. doi: 10.1007/BF00001539. - DOI
    1. Ross RM. The evolution of sex-change mechanisms in fishes. Environ. Biol. Fishes. 1990;29:81–93. doi: 10.1007/BF00005025. - DOI
    1. Avise JC, Mank JE. Evolutionary perspectives on hermaphroditism in fishes. Sex. Dev. 2009;3:152–163. doi: 10.1159/000223079. - DOI - PubMed

Publication types

LinkOut - more resources