. 2017 Sep 18;9(9):782-791.
doi: 10.1039/c7ib00082k.

Quantitative profiling of innate immune activation by viral infection in single cells

Affiliations

Quantitative profiling of innate immune activation by viral infection in single cells

Andrea C Timm et al. Integr Biol (Camb). .

Abstract

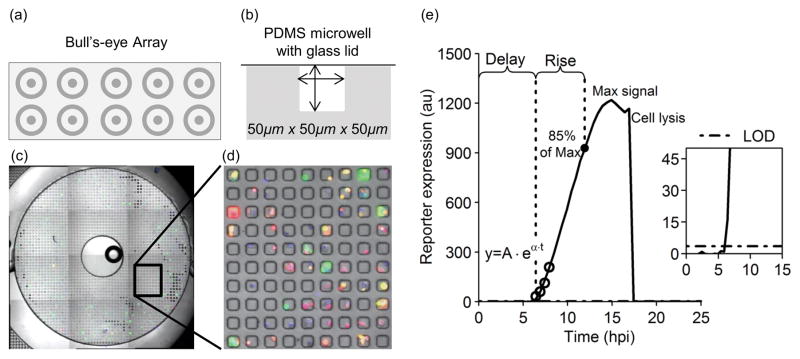
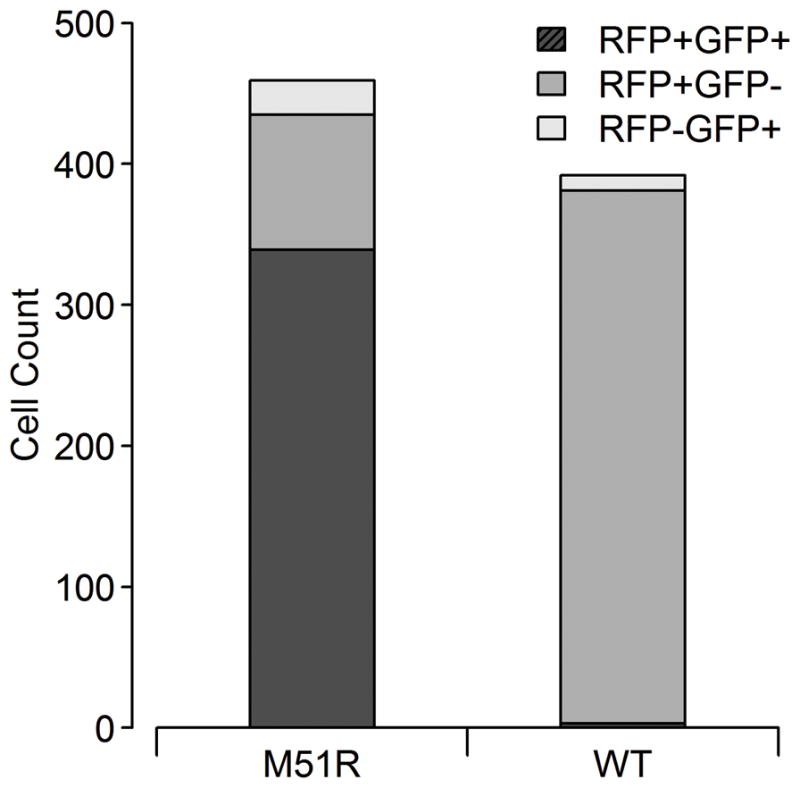
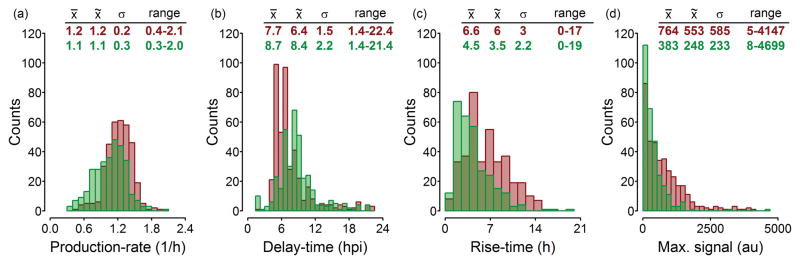
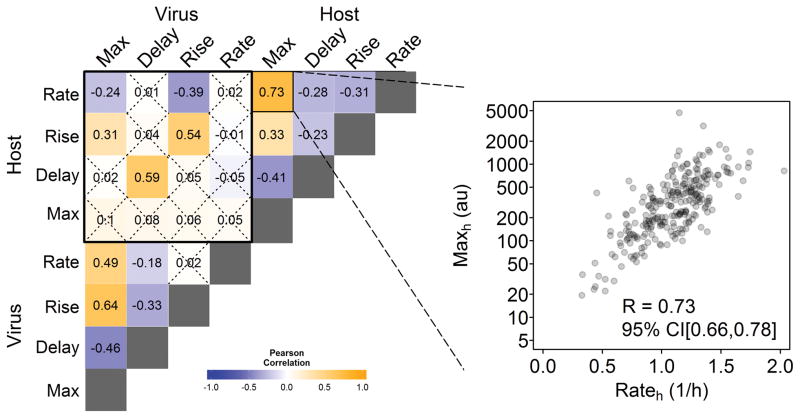
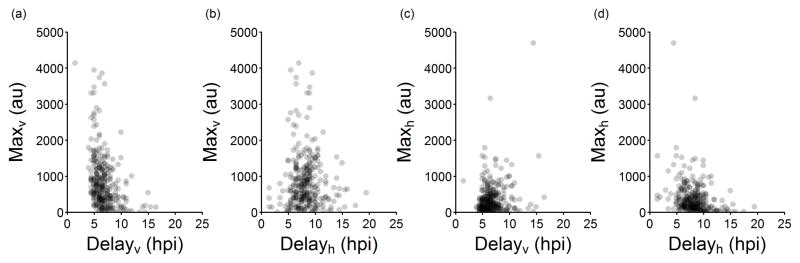
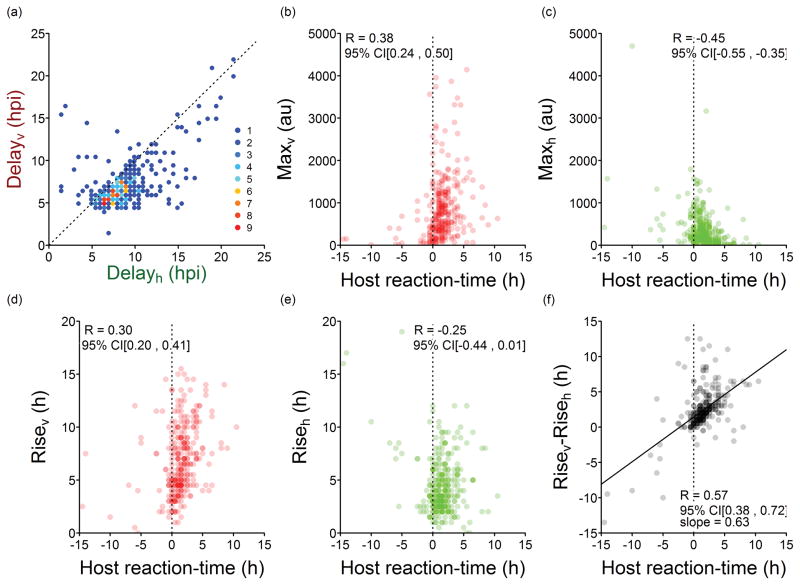
Cells infected by viruses can exhibit diverse patterns of viral and cellular gene expression. The patterns arise in part from the stochastic or noisy reaction kinetics associated with the small number of genomes, enzymes, and other molecules that typically initiate virus replication and activate cellular anti-viral defenses. It is not known what features, if any, of the early viral or cellular gene expression correlate with later processes of viral replication or cell survival. Here we used two fluorescent reporters to visualize innate immune activation of human prostate cancer (PC3) cells against infection by vesicular stomatitis virus. The cells were engineered to express green-fluorescent protein under control of the promoter for IFIT2, an interferon-sensitive component of the anti-viral response, while red-fluorescent protein was expressed as a byproduct of virus infection. To isolate and quantitatively analyze single-cells, we used a unique microwell array device and open-source image processing software. Kinetic analysis of viral and cellular reporter profiles from hundreds of cells revealed novel relationships between gene expression and the outcome of infection. Specifically, the relative timing rather than the magnitude of the viral gene expression and innate immune activation correlated with the infection outcome. Earlier viral or anti-viral gene expression favored or hindered virus growth, respectively. Further, analysis of kinetic parameters estimated from these data suggests a trade-off between robust antiviral signaling and cell death, as indicated by a higher rate of detectable cell lysis in infected cells with a detectable immune response. In short, cells that activate an immune response lyse at a higher rate. More broadly, we demonstrate how the intrinsic heterogeneity of individual cell behaviors can be exploited to discover features of viral and host gene expression that correlate with single-cell outcomes, which will ultimately impact whether or not infections spread.


Conflict of interest statement

Conflicts of interest

There are no conflicts of interest to declare.

Figures

Fig. 1
Fig. 1. Microwell array device design and infected cell seeding
(a) Diagram of a PDMS microwell device showing 10 bull’s-eyes in a 2 × 5 array arranged to fit on a glass slide footprint. (b) Each bull’s-eye contains 2500 sub-nanoliter volume wells. (c) Cells within microwells were imaged by taking a 4×3 array of 4× magnification images centered around each bull’s-eye. A stitched image overlay of phase contrast, GFP, RFP, and DAPI fluorescent channels of one bull’s-eye is shown. (d) A small section of (c) is magnified in order to visualize individual microwells and the cells contained within those wells. (e) From the kinetic imaging data, fluorescent trajectories from isolated single cells can be plotted, and kinetic parameters describing those trajectories extracted. The first data point above the limit of detection (LOD) for this sample virus trajectory is defined as the delay-time (Delayv). The rise-time is defined as the period between the delay-time and the time at which 85% of the maximum signal is reached (Risev). The first four data-points above the LOD can be fit with an exponential curve to estimate the production-rate, approximated as alpha (α) in the equation y = Aeαt (Ratev). We can also record a maximum signal for each trajectory that reaches a maximum during imaging (Maxv) and note cell lysis events if they occur.
Fig. 2
Fig. 2. Composition of virus and host reporter activation in single cell populations infected by wildtype (WT) or mutant (M51R) virus
The majority of VSV-M51R infected cells expressing a fluorescent signal were positive for both the viral and innate immune reporters, while the majority of VSV-rWT cells expressed only the viral reporter at some point during imaging of cells (~1.4 – 23.4 hpi).
Fig. 3
Fig. 3. Distributions of parameters for viral and host reporter protein trajectories
These distributions represent trajectories from the VSV-M51R infected cells that were positive for one or both reporter signals, with virus parameters red and host parameters green. The value of σ was obtained using the median absolute deviation function in R (‘mad’), which applies a correction factor to approximate the standard deviation of the sample in a manner that is robust to outliers. Mean: , Median: , Std. Dev. Est.: σ, Range: min – max. Total cell counts for each histogram of virus/host parameters are (a) 350/308, (b) 435/363, (c) 373/295, and (d) 373/295 respectively.
Fig. 4
Fig. 4. Characteristic kinetic parameters of virus and host reporters correlate to different extents
Results from RFP+GFP+ cells produced by reporter mutant virus (VSV-M51R) infections of reporter cells are shown. Each cell reported both a virus and host signal, which were used to estimate four virus and four host kinetic parameters, respectively. Then extents of correlation (R) were determined for all 28 unique pairs of virus-virus, host-host, or virus-host parameters. 95% confidence intervals were calculated through bootstrapping and insignificant correlations are marked with an X. The inset shows the extent of correlation between two host parameters: Maxh and Rateh.
Fig. 5
Fig. 5. Extents of viral and host reporter expression versus delay-times
(a) Maxv appears to decrease with longer Delayv but (b) Maxv has no obvious relationship to Delayh. (c) Maxh is not affected by Delayv, but (d) Maxh may decrease with longer Delayh.
Fig. 6
Fig. 6. Effect of host reaction-time on infection timing and outcome
Comparison of (a) delay-time for virus and host reporter protein expression in single-cells. The legend shows the number of cells that have the same behavior. The extent of (b) viral gene expression (Maxv) and (c) host gene expression (Maxh) are plotted against the host reaction-time (Delayh − Delayv). Likewise, the duration of (d) viral gene expression (Risev) and (e) host gene expression (Riseh) are plotted against the host reaction-time. When (f) differences in the duration of reporter gene expression (Risev − Riseh) are plotted versus host reaction-time, a relatively strong linear correlation (R=0.57) is revealed. The host expresses earlier or has the time advantage when host reaction-time has a negative value. Conversely, the virus has the time advantage when host reaction-time has a positive value. All data refers to VSV-M51R infections.

Similar articles

Cited by

References

    1. Elowitz MB, Levine AJ, Siggia ED, Swain PS. Stochastic gene expression in a single cell. Science. 2002;297:1183–1186. doi: 10.1126/science.1070919. - DOI - PubMed
    1. Rand U, Rinas M, Schwerk J, Nöhren G, Linnes M, Kröger A, et al. Multi-layered stochasticity and paracrine signal propagation shape the type-I interferon response. Mol Syst Biol. 2012;8:1–13. doi: 10.1038/msb.2012.17. - DOI - PMC - PubMed
    1. Levin D, Harari D, Schreiber G. Stochastic receptor expression determines cell fate upon interferon treatment. Mol Cell Biol. 2011;31:3252–66. doi: 10.1128/MCB.05251-11. - DOI - PMC - PubMed
    1. Zhao M, Zhang J, Phatnani H, Scheu S, Maniatis T. Stochastic expression of the interferon-β gene. PLoS Biol. 2012;10:1–16. doi: 10.1371/journal.pbio.1001249. - DOI - PMC - PubMed
    1. Volfson D, Marciniak J, Blake WJ, Ostroff N, Tsimring LS, Hasty J. Origins of extrinsic variability in eukaryotic gene expression. Nature. 2006;439:861–4. doi: 10.1038/nature04281. - DOI - PubMed

Publication types

Substances

LinkOut - more resources