

Epidemiology from Tweets: Estimating Misuse of Prescription Opioids in the USA from Social Media
- PMID: 28831738
- PMCID: PMC5711756
- DOI: 10.1007/s13181-017-0625-5
Epidemiology from Tweets: Estimating Misuse of Prescription Opioids in the USA from Social Media
Abstract
Background: The misuse of prescription opioids (MUPO) is a leading public health concern. Social media are playing an expanded role in public health research, but there are few methods for estimating established epidemiological metrics from social media. The purpose of this study was to demonstrate that the geographic variation of social media posts mentioning prescription opioid misuse strongly correlates with government estimates of MUPO in the last month.
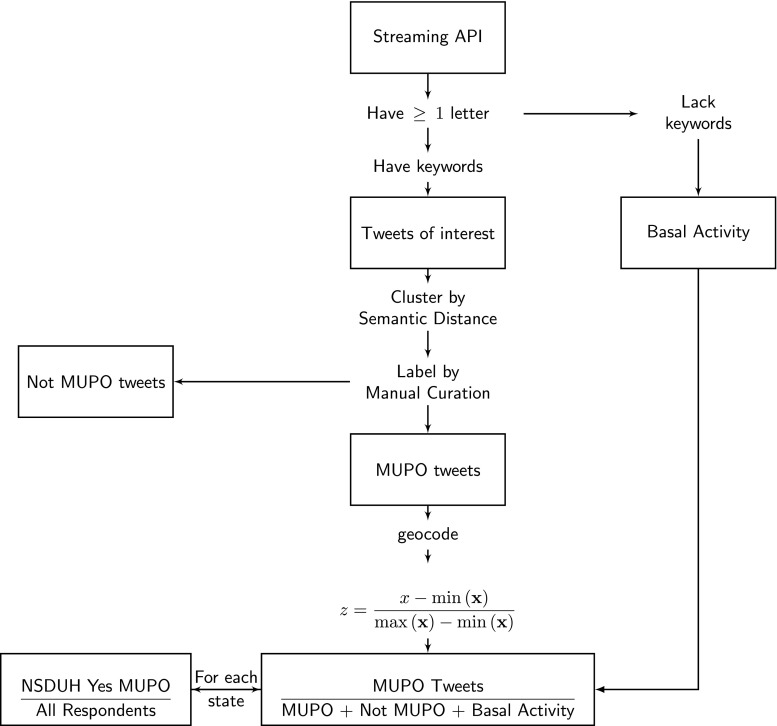
Methods: We wrote software to acquire publicly available tweets from Twitter from 2012 to 2014 that contained at least one keyword related to prescription opioid use (n = 3,611,528). A medical toxicologist and emergency physician curated the list of keywords. We used the semantic distance (SemD) to automatically quantify the similarity of meaning between tweets and identify tweets that mentioned MUPO. We defined the SemD between two words as the shortest distance between the two corresponding word-centroids. Each word-centroid represented all recognized meanings of a word. We validated this automatic identification with manual curation. We used Twitter metadata to estimate the location of each tweet. We compared our estimated geographic distribution with the 2013-2015 National Surveys on Drug Usage and Health (NSDUH).
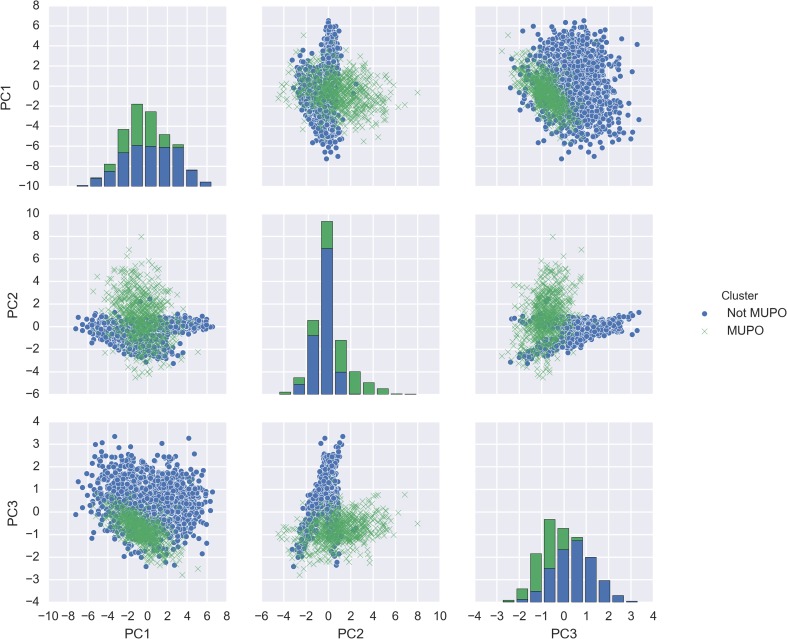
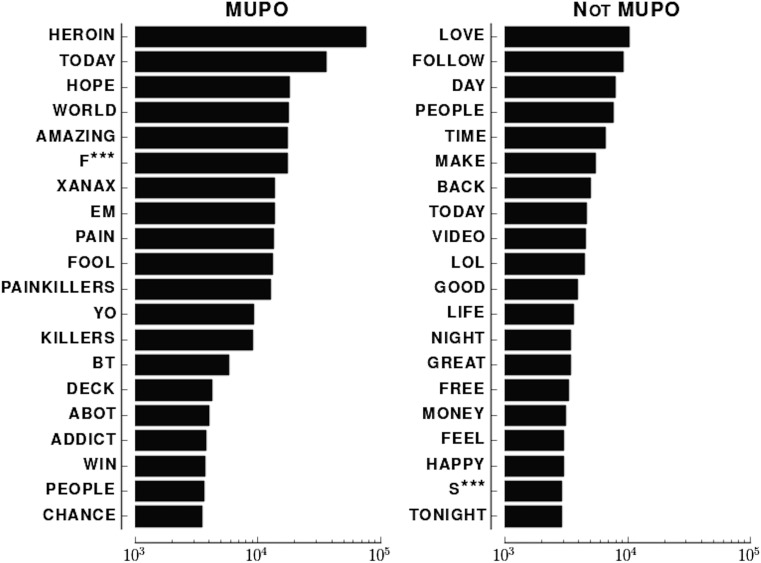
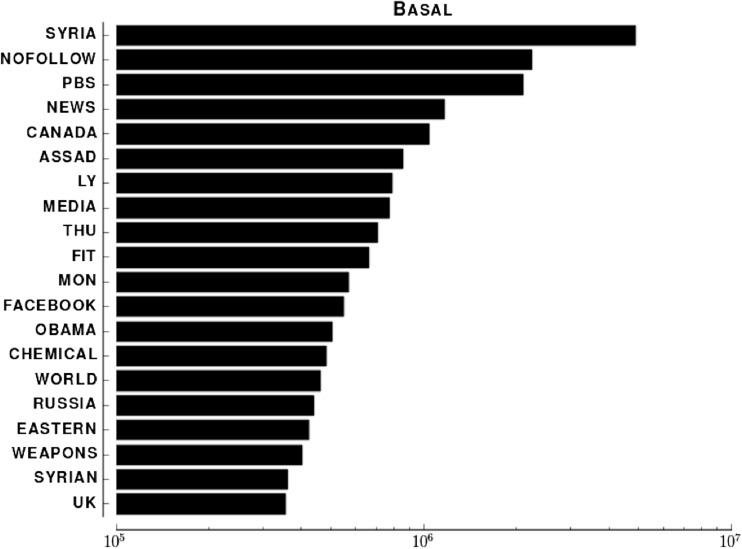
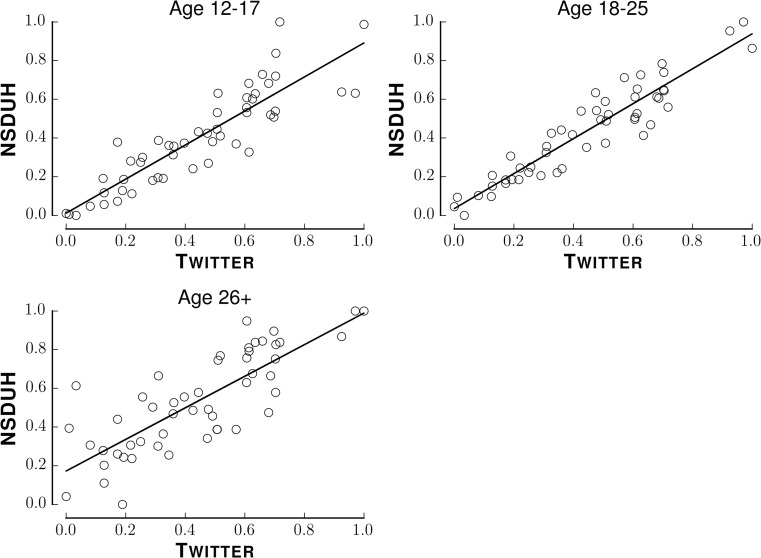
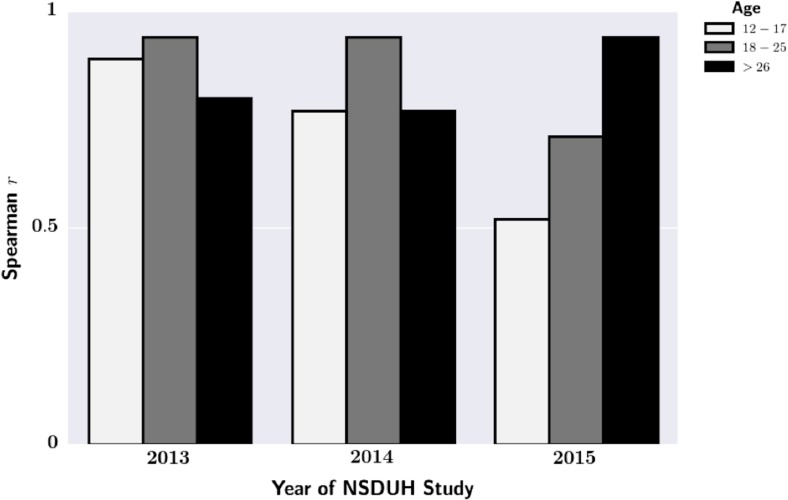
Results: Tweets that mentioned MUPO formed a distinct cluster far away from semantically unrelated tweets. The state-by-state correlation between Twitter and NSDUH was highly significant across all NSDUH survey years. The correlation was strongest between Twitter and NSDUH data from those aged 18-25 (r = 0.94, p < 0.01 for 2012; r = 0.94, p < 0.01 for 2013; r = 0.71, p = 0.02 for 2014). The correlation was driven by discussions of opioid use, even after controlling for geographic variation in Twitter usage.
Conclusions: Mentions of MUPO on Twitter correlate strongly with state-by-state NSDUH estimates of MUPO. We have also demonstrated that a natural language processing can be used to analyze social media to provide insights for syndromic toxicosurveillance.
Keywords: Computational linguistics; Epidemiology; Misuse; Natural language processing; Opioids; Social media.
Conflict of interest statement
Conflict of Interest
The authors declare that they have no conflicts of interest.
Sources of Funding
None
Figures
References
-
- Abuse S. Results from the 2010 National Survey on Drug Use and Health: Summary Of National Findings 2011.
-
- Manchikanti L, Singh A. Therapeutic opioids: a ten-year perspective on the complexities and complications of the escalating use, abuse, and nonmedical use of opioids. Pain physician. 2008;11(2 Suppl):S63–S88. - PubMed
MeSH terms
LinkOut - more resources
Full Text Sources
Other Literature Sources
Medical
