

Feasibility of spatial frequency-domain imaging for monitoring palpable breast lesions
- PMID: 28831792
- PMCID: PMC5997013
- DOI: 10.1117/1.JBO.22.12.121605
Feasibility of spatial frequency-domain imaging for monitoring palpable breast lesions
Abstract
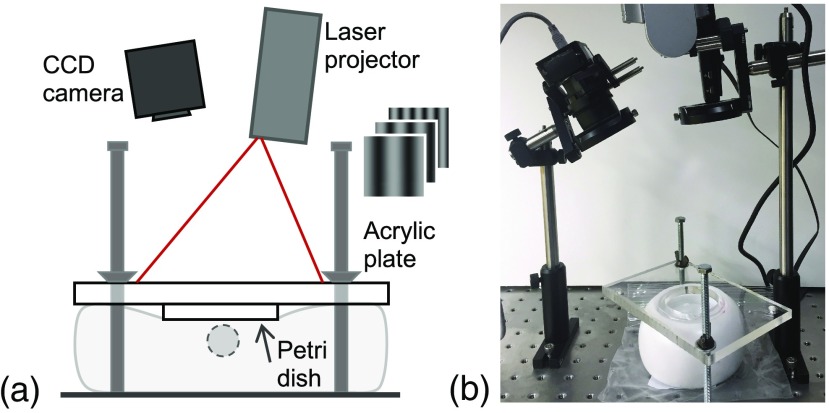
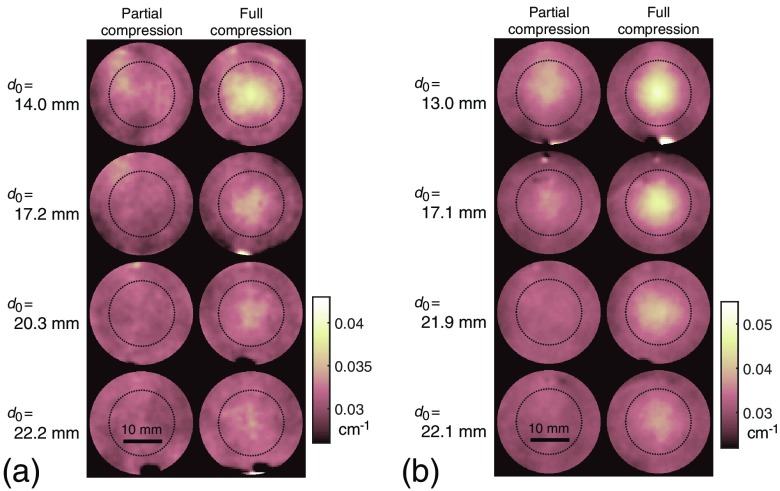
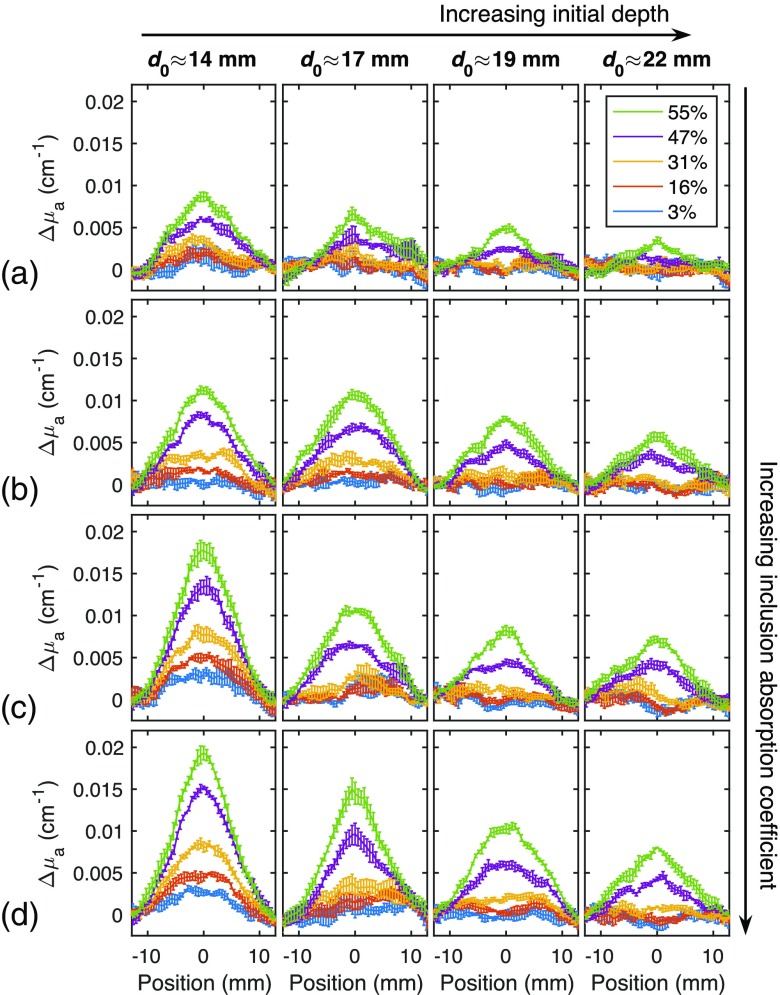
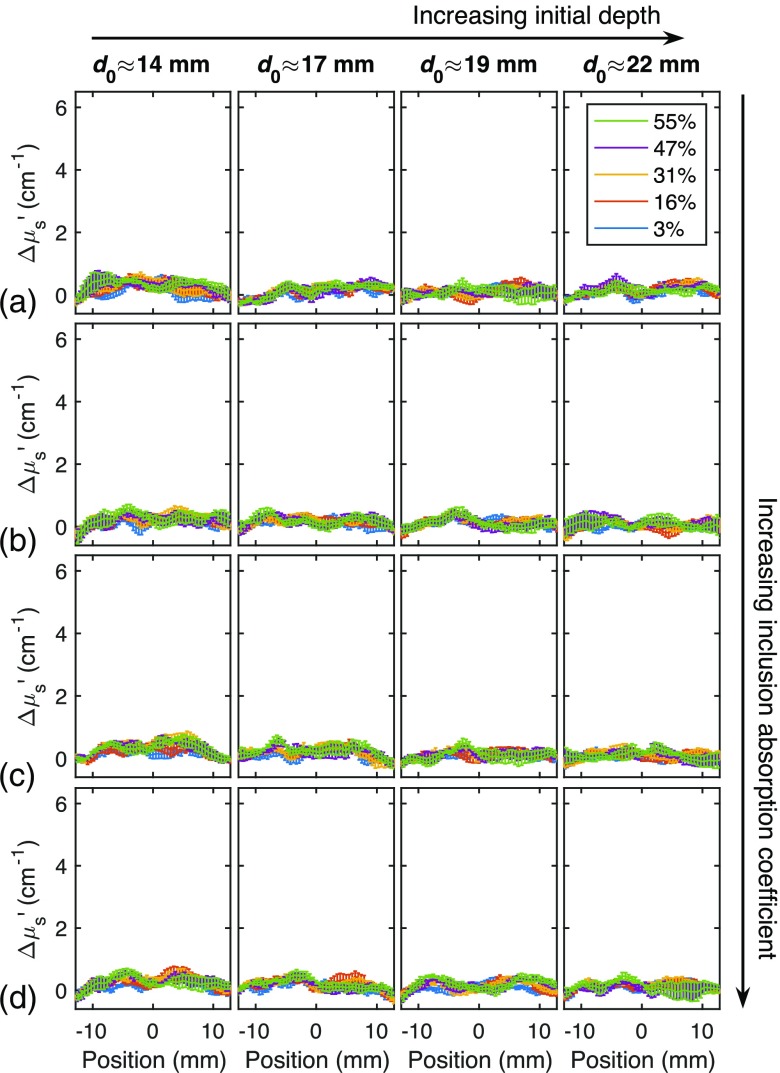
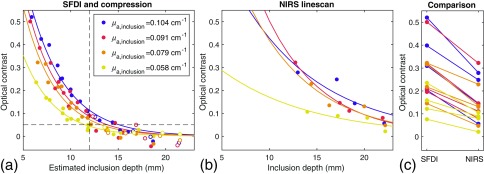
In breast cancer diagnosis and therapy monitoring, there is a need for frequent, noninvasive disease progression evaluation. Breast tumors differ from healthy tissue in mechanical stiffness as well as optical properties, which allows optical methods to detect and monitor breast lesions noninvasively. Spatial frequency-domain imaging (SFDI) is a reflectance-based diffuse optical method that can yield two-dimensional images of absolute optical properties of tissue with an inexpensive and portable system, although depth penetration is limited. Since the absorption coefficient of breast tissue is relatively low and the tissue is quite flexible, there is an opportunity for compression of tissue to bring stiff, palpable breast lesions within the detection range of SFDI. Sixteen breast tissue-mimicking phantoms were fabricated containing stiffer, more highly absorbing tumor-mimicking inclusions of varying absorption contrast and depth. These phantoms were imaged with an SFDI system at five levels of compression. An increase in absorption contrast was observed with compression, and reliable detection of each inclusion was achieved when compression was sufficient to bring the inclusion center within ∼12 mm of the phantom surface. At highest compression level, contrasts achieved with this system were comparable to those measured with single source-detector near-infrared spectroscopy.
Keywords: breast cancer; compression; near-infrared light; optical mammography; spatial frequency-domain imaging.
(2017) COPYRIGHT Society of Photo-Optical Instrumentation Engineers (SPIE).
Figures
Similar articles
-
Contrast-enhanced near-infrared laser mammography with a prototype breast scanner: feasibility study with tissue phantoms and preliminary results of imaging experimental tumors.Invest Radiol. 2001 Oct;36(10):573-81. doi: 10.1097/00004424-200110000-00002. Invest Radiol. 2001. PMID: 11577267
-
Tissue-simulating phantoms for assessing potential near-infrared fluorescence imaging applications in breast cancer surgery.J Vis Exp. 2014 Sep 19;(91):51776. doi: 10.3791/51776. J Vis Exp. 2014. PMID: 25286185 Free PMC article.
-
Comparison of breast specific gamma imaging and molecular breast tomosynthesis in breast cancer detection: Evaluation in phantoms.Med Phys. 2015 Jul;42(7):4250-9. doi: 10.1118/1.4922398. Med Phys. 2015. PMID: 26133623 Free PMC article.
-
Review of optical breast imaging and spectroscopy.J Biomed Opt. 2016 Sep;21(9):091311. doi: 10.1117/1.JBO.21.9.091311. J Biomed Opt. 2016. PMID: 27403837 Review.
-
Diffuse near-infrared imaging of tissue with picosecond time resolution.Biomed Tech (Berl). 2018 Oct 25;63(5):511-518. doi: 10.1515/bmt-2017-0067. Biomed Tech (Berl). 2018. PMID: 29494335
Cited by
-
Analysis of Light Penetration Depth in Apple Tissues by Depth-Resolved Spatial-Frequency Domain Imaging.Foods. 2023 Apr 25;12(9):1783. doi: 10.3390/foods12091783. Foods. 2023. PMID: 37174321 Free PMC article.
-
Two-layer analytical model for estimation of layer thickness and flow using Diffuse Correlation Spectroscopy.PLoS One. 2022 Sep 16;17(9):e0274258. doi: 10.1371/journal.pone.0274258. eCollection 2022. PLoS One. 2022. PMID: 36112634 Free PMC article.
-
Microvascular imaging of the skin.Phys Med Biol. 2019 Mar 21;64(7):07TR01. doi: 10.1088/1361-6560/ab03f1. Phys Med Biol. 2019. PMID: 30708364 Free PMC article. Review.
-
Dual-DMD hyperspectral spatial frequency domain imaging (SFDI) using dispersed broadband illumination with a demonstration of blood stain spectral monitoring.Biomed Opt Express. 2020 Dec 24;12(1):676-688. doi: 10.1364/BOE.411976. eCollection 2021 Jan 1. Biomed Opt Express. 2020. PMID: 33520393 Free PMC article.
-
Structured light imaging mesoscopy: detection of embedded morphological changes in superficial tissues.J Biomed Opt. 2025 Jun;30(6):065001. doi: 10.1117/1.JBO.30.6.065001. Epub 2025 Jun 18. J Biomed Opt. 2025. PMID: 40534904 Free PMC article.
References
-
- U.S. Cancer Statistics Working Group, “United States cancer statistics: 1999-2014 incidence and mortality web-based report,” U.S. Department of Health and Human Services, Centers for Disease Control and Prevention and National Cancer Institute, Atlanta: (2017), www.cdc.gov/uscs (9 August 2017).
-
- “Breast cancer screening and diagnosis (version 2.2016),” Nation Comprehensive Cancer Network, 2016, https://www.nccn.org/professionals/physician_gls/pdf/breast-screening.pdf (1 January 2017).
MeSH terms
Grants and funding
LinkOut - more resources
Full Text Sources
Other Literature Sources
Medical
