. 2017 Nov;25(11):1253-1260.
doi: 10.1038/ejhg.2017.130. Epub 2017 Aug 23.

SweGen: a whole-genome data resource of genetic variability in a cross-section of the Swedish population

Affiliations

SweGen: a whole-genome data resource of genetic variability in a cross-section of the Swedish population

Adam Ameur et al. Eur J Hum Genet. 2017 Nov.

Abstract

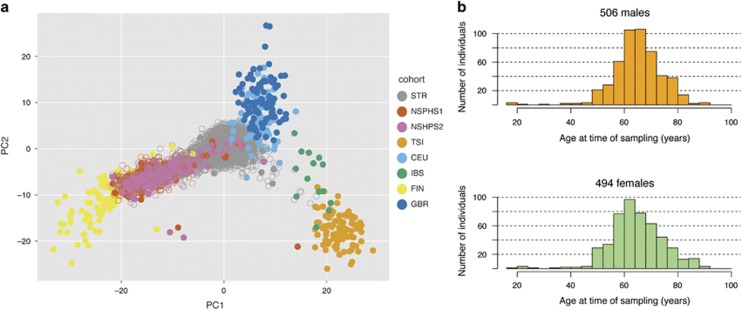
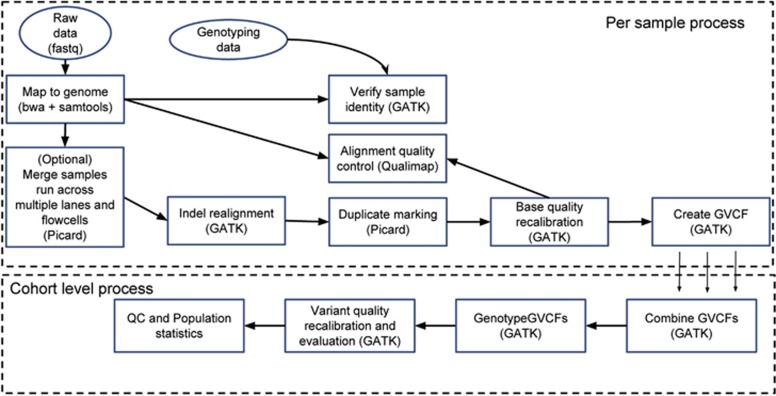
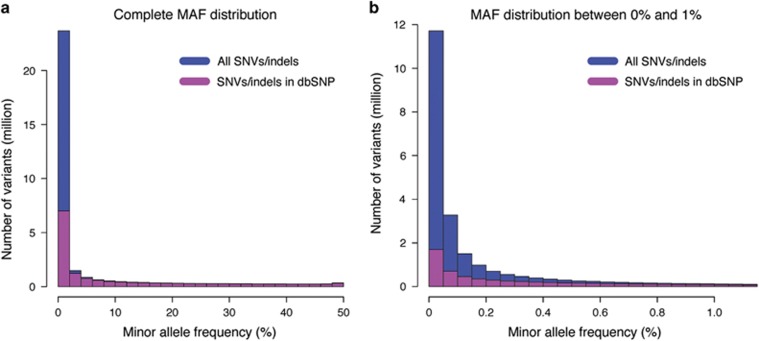
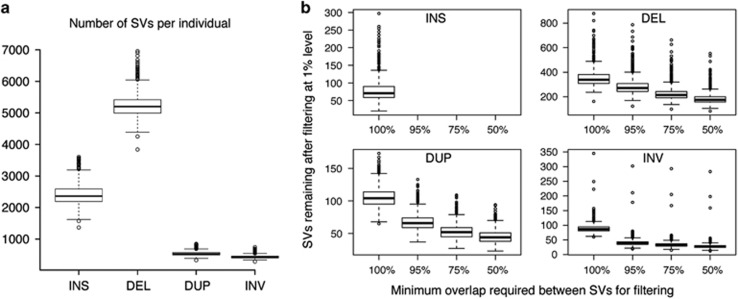
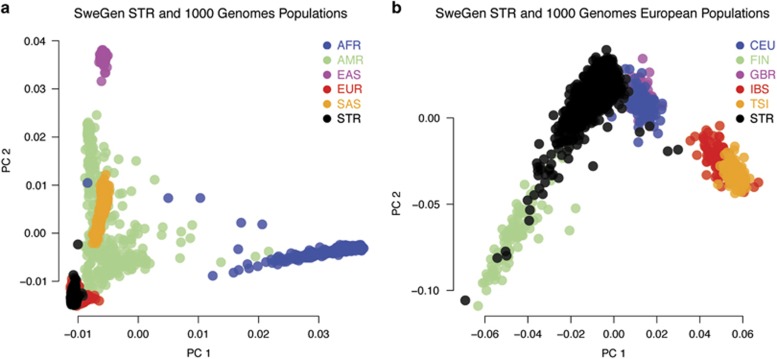
Here we describe the SweGen data set, a comprehensive map of genetic variation in the Swedish population. These data represent a basic resource for clinical genetics laboratories as well as for sequencing-based association studies by providing information on genetic variant frequencies in a cohort that is well matched to national patient cohorts. To select samples for this study, we first examined the genetic structure of the Swedish population using high-density SNP-array data from a nation-wide cohort of over 10 000 Swedish-born individuals included in the Swedish Twin Registry. A total of 1000 individuals, reflecting a cross-section of the population and capturing the main genetic structure, were selected for whole-genome sequencing. Analysis pipelines were developed for automated alignment, variant calling and quality control of the sequencing data. This resulted in a genome-wide collection of aggregated variant frequencies in the Swedish population that we have made available to the scientific community through the website https://swefreq.nbis.se. A total of 29.2 million single-nucleotide variants and 3.8 million indels were detected in the 1000 samples, with 9.9 million of these variants not present in current databases. Each sample contributed with an average of 7199 individual-specific variants. In addition, an average of 8645 larger structural variants (SVs) were detected per individual, and we demonstrate that the population frequencies of these SVs can be used for efficient filtering analyses. Finally, our results show that the genetic diversity within Sweden is substantial compared with the diversity among continental European populations, underscoring the relevance of establishing a local reference data set.


Conflict of interest statement

The authors declare no conflict of interest.

Figures

Figure 1
Figure 1
Selection of 1000 individuals based on genetic variation within Sweden. (a) PCA of SNP array data from the Swedish Twin Registry (STR) and the Northern Sweden Population Health Study (NSPHS1 and NSPHS2, collected in two different phases) compared with data from European 1000 Genomes populations (CEU: Utah Residents with Northern and Western Ancestry, FIN: Finnish in Finland, GBR: British in England and Scotland, IBS: Iberian Population in Spain, TSI: Toscani in Italia). A total of 19 978 SNP positions were used to generate this plot (see Methods). (b) Age and gender distribution for the 1000 individuals in the SweGen data set. The median age at sampling is 65.4 years for males, 64.9 years for females and 65.2 in the combined data set.
Figure 2
Figure 2
Overview of workflow for alignment and SNV and indel detection. The process has two phases: first each sample is processed individually and then the entire cohort is processed together. The first phase begins by aligning the raw reads to the reference genome using bwa, converting the resulting alignments to bam format and sorting and indexing them using samtools. Preliminary sample identity is verified by checking concordance with genotyping data and alignment quality is assessed using Qualimap. Once all alignments from a sample have been merged, they are processed according to the GATK Best practice workflow, with indel realignment, duplicate marking and base quality score recalibration, before using the GATK Haplotypecaller to create genomic VCF files (GVCF). The second phase is carried out on a cohort level. This is followed by variant quality recalibration. Finally, quality control metrics and population statistics are computed for the final call set.
Figure 3
Figure 3
Minor allele frequency (MAF) distribution in the SweGen data set. (a) MAF distribution for all SNVs and indel variants in the data set. The known variants (colored in pink) are those that are found in version 147 of dbSNP. All other variants (colored in blue) are novel. (b) MAF distribution for variants occurring in at most 1% of the SweGen individuals.
Figure 4
Figure 4
Analysis of structural variation in the SweGen data set. (a) Structural variations (SVs) were detected by the Manta software and the box plots show distributions of the number of insertions (INS), deletions (DEL), duplications (DUP) and inversions (INV) detected in each of the 1000 SweGen samples. The average numbers are the following: 2417 INS, 5245 DEL, 537 DUP and 436 INV. (b) Number of structural variants remaining in a WGS sample after filtering all events occurring at a frequency of at least 1% in the SweGen data set. For each of the 1000 genomes, INS, DEL, DUP and DEL calls were filtered against the SweGen SV frequencies to produce a box plot distribution for the number of SVs remaining after filtering. For each of the SV types, four different analyses were performed requiring a reciprocal overlap of 100, 95, 75 and 50% between SVs in order to be filtered. As partial overlaps are not defined for INS (see Methods), only the 100% data are shown for these events.
Figure 5
Figure 5
Genetic variation in Sweden in relation to 1000 Genomes populations. (a) Results of PCA of SweGen WGS data, comparing the 942 Swedish STR samples with 1000 Genomes populations (AFR=African, AMR=Ad Mixed American, EAS=East Asian, EUR=European, SAS=South Asian). (b) Results of PCA of SweGen WGS data, comparing the 942 Swedish STR samples with the European 1000 Genomes populations (CEU: Utah Residents with Northern and Western Ancestry, FIN: Finnish in Finland, GBR: British in England and Scotland, IBS: Iberian Population in Spain, TSI: Toscani in Italia). A total of 648 379 SNP positions were used to generate these two PCA plots (see Methods).

References

    1. 1000 Genomes Project Consortium1000 Genomes Project Consortium, Abecasis GR 1000 Genomes Project Consortium, Auton A et al: An integrated map of genetic variation from 1,092 human genomes. Nature 2012; 491: 56–65. - PMC - PubMed
    1. Besenbacher S, Liu S, Izarzugaza JM et al: Novel variation and de novo mutation rates in population-wide de novo assembled Danish trios. Nat Commun 2015; 6: 5969. - PMC - PubMed
    1. Boomsma DI, Wijmenga C, Slagboom EP et al: The Genome of the Netherlands: design, and project goals. Eur J Hum Genet 2014; 22: 221–227. - PMC - PubMed
    1. Gudbjartsson DF, Helgason H, Gudjonsson SA et al: Large-scale whole-genome sequencing of the Icelandic population. Nat Genet 2015; 47: 435–444. - PubMed
    1. UK10K ConsortiumUK10K Consortium, Walter K UK10K Consortium, Min JL et al: The UK10K project identifies rare variants in health and disease. Nature 2015; 526: 82–90. - PMC - PubMed

Publication types