. 2017 Aug 23;11(8):e0005828.
doi: 10.1371/journal.pntd.0005828. eCollection 2017 Aug.

Local environmental and meteorological conditions influencing the invasive mosquito Ae. albopictus and arbovirus transmission risk in New York City

Affiliations

Local environmental and meteorological conditions influencing the invasive mosquito Ae. albopictus and arbovirus transmission risk in New York City

Eliza Little et al. PLoS Negl Trop Dis. .

Abstract

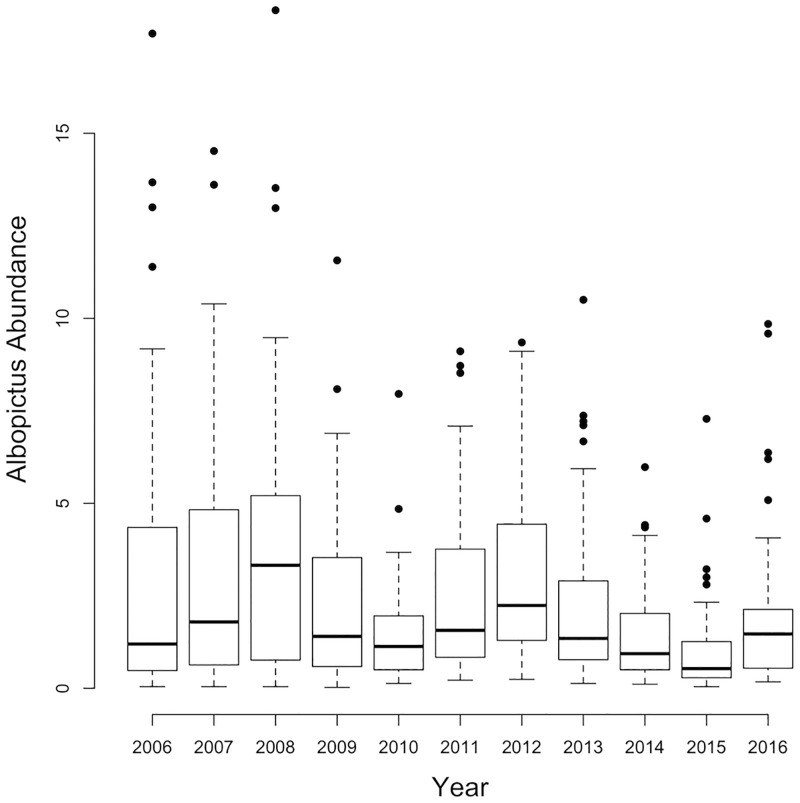
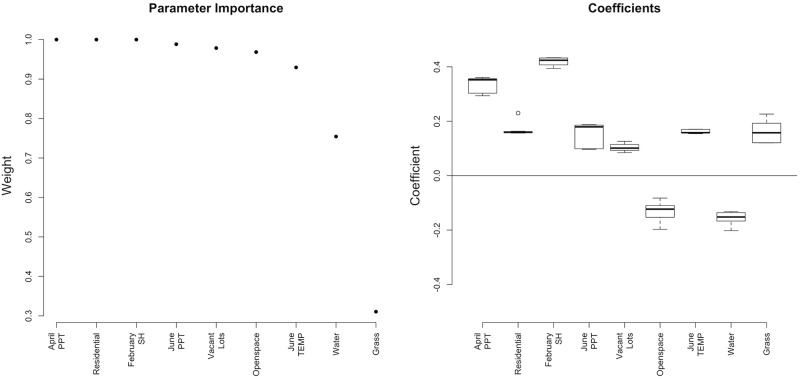
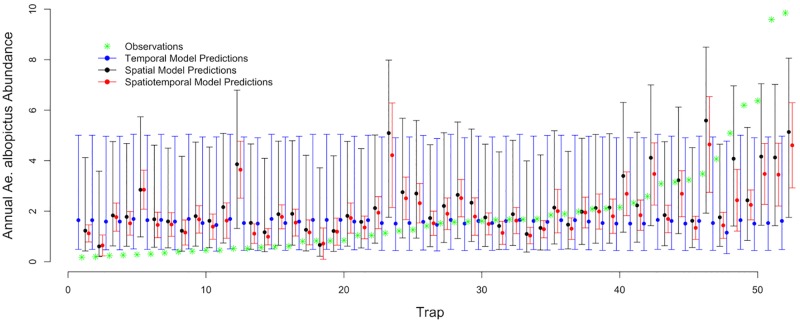
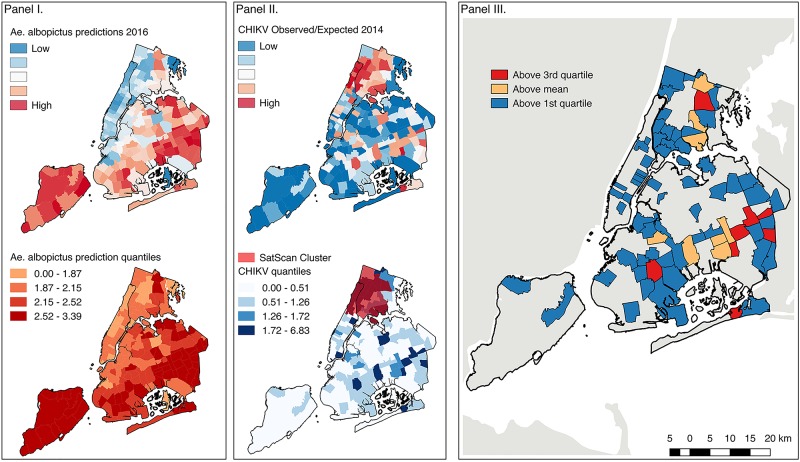
Ae. albopictus, an invasive mosquito vector now endemic to much of the northeastern US, is a significant public health threat both as a nuisance biter and vector of disease (e.g. chikungunya virus). Here, we aim to quantify the relationships between local environmental and meteorological conditions and the abundance of Ae. albopictus mosquitoes in New York City. Using statistical modeling, we create a fine-scale spatially explicit risk map of Ae. albopictus abundance and validate the accuracy of spatiotemporal model predictions using observational data from 2016. We find that the spatial variability of annual Ae. albopictus abundance is greater than its temporal variability in New York City but that both local environmental and meteorological conditions are associated with Ae. albopictus numbers. Specifically, key land use characteristics, including open spaces, residential areas, and vacant lots, and spring and early summer meteorological conditions are associated with annual Ae. albopictus abundance. In addition, we investigate the distribution of imported chikungunya cases during 2014 and use these data to delineate areas with the highest rates of arboviral importation. We show that the spatial distribution of imported arboviral cases has been mostly discordant with mosquito production and thus, to date, has provided a check on local arboviral transmission in New York City. We do, however, find concordant areas where high Ae. albopictus abundance and chikungunya importation co-occur. Public health and vector control officials should prioritize control efforts to these areas and thus more cost effectively reduce the risk of local arboviral transmission. The methods applied here can be used to monitor and identify areas of risk for other imported vector-borne diseases.


Conflict of interest statement

I have read the journal’s policy and the authors of this manuscript have the following competing interests: JS declares partial ownership of SK Analytics.

Figures

Fig 1
Fig 1. Ae. albopictus abundance.
Box and whisker plots showing variability in annual Ae. albopictus abundance across 52 permanent trap locations in New York City 2006–2016. The box delimits the interquartile range, the whiskers extend 1.5 times the interquartile range, and the dots are outliers.
Fig 2
Fig 2. Spatiotemporal modeling results.
Ranked order of predictor variable importance and coefficients for the ensemble model inference set.
Fig 3
Fig 3. Comparison of model predictions.
Model predictions for 2016 with 95% confidence intervals for the temporal model using meteorological conditions (blue), spatial model using local environmental conditions (black), and spatiotemporal model using a subset of important parameters from temporal and spatial modeling efforts (red). Green asterisks indicate actual 2016 observed Ae. albopictus abundance. On the x-axis, trap refers to the 52 permanent trap locations across NYC.
Fig 4
Fig 4. Risk map.
Ensemble spatiotemporal model predictions of Ae. albopictus annual abundance for 2016 averaged by zipcode (top) and classified into quantiles (bottom). Panel II: Spatial distribution of imported CHIKV cases by zipcode in 2014 (top) and classified into quantiles with SatScan Cluster of CHIKV cases (bottom). Panel III: Spatial risk map combining data from the predicted mean value of Ae. albopictus abundance in 2016 with imported CHIKV cases from 2014 by zipcode. (Data sources: Entomological and Epidemiological data from the NYC DOHMH; meteorological data from NLDAS; environmental data from 3 foot landcover dataset (University of Vermont Spatial Analysis Laboratory and NYC Urban Field Station) and PLUTO; and the underlying geographic boundaries from 2014 TIGER/Line Shapefiles prepared by the U.S. Census Bureau).

References

    1. Juliano SA, Lounibos LP. Ecology of invasive mosquitoes: effects on resident species and on human health. Ecol Lett. 2005;8(5):558–74. - PMC - PubMed
    1. Leisnham PT, Juliano SA. Impacts of climate, land use, and biological invasion on the ecology of immature Aedes mosquitoes: implications for La Crosse emergence. Ecohealth. 2012;9(2):217–28. 10.1007/s10393-012-0773-7 - DOI - PMC - PubMed
    1. Paupy C, Delatte H, Bagny L, Corbel V, Fontenille D. Aedes albopictus, an arbovirus vector: from the darkness to the light. Microbes Infect. 2009;11(14–15):1177–85. 10.1016/j.micinf.2009.05.005 - DOI - PubMed
    1. Moore CG, Mitchell CJ. Aedes albopictus in the United States: ten-year presence and public health implications. Emerg Infect Dis. 1997;3(3):329–34. 10.3201/eid0303.970309 - DOI - PMC - PubMed
    1. Kraemer MUG, Sinka ME, Duda KA, Mylne A, Shearer FM, Brady OJ, et al. The global compendium of Aedes aegypti and Ae. albopictus occurrence. Sci Data. 2015;2:150035 10.1038/sdata.2015.35 - DOI - PMC - PubMed

LinkOut - more resources