. 2017 Nov;47(11):1989-2001.
doi: 10.1002/eji.201747121. Epub 2017 Sep 15.

AhR activation increases IL-2 production by alloreactive CD4+ T cells initiating the differentiation of mucosal-homing Tim3+ Lag3+ Tr1 cells

Affiliations

AhR activation increases IL-2 production by alloreactive CD4+ T cells initiating the differentiation of mucosal-homing Tim3+ Lag3+ Tr1 cells

Allison K Ehrlich et al. Eur J Immunol. 2017 Nov.

Abstract

Activation of the aryl hydrocarbon receptor (AhR) by immunosuppressive ligands promotes the development of regulatory T (Treg) cells. Although AhR-induced Foxp3+ Treg cells have been well studied, much less is known about the development and fate of AhR-induced Type 1 Treg (AhR-Tr1) cells. In the current study, we identified the unique transcriptional and functional changes in murine CD4+ T cells that accompany the differentiation of AhR-Tr1 cells during the CD4+ T-cell-dependent phase of an allospecific cytotoxic T lymphocyte (allo-CTL) response. AhR activation increased the expression of genes involved in T-cell activation, immune regulation and chemotaxis, as well as a global downregulation of genes involved in cell cycling. Increased IL-2 production was responsible for the early AhR-Tr1 activation phenotype previously characterized as CD25+ CTLA4+ GITR+ on day 2. The AhR-Tr1 phenotype was further defined by the coexpression of the immunoregulatory receptors Lag3 and Tim3 and non-overlapping expression of CCR4 and CCR9. Consistent with the increased expression of CCR9, real-time imaging showed enhanced migration of AhR-Tr1 cells to the lamina propria of the small intestine and colon. The discovery of mucosal imprinting of AhR-Tr1 cells provides an additional mechanism by which therapeutic AhR ligands can control immunopathology.

Keywords: AhR; CD4+ T cells; IL-2; Lag3; Migration; Tim3; Tr1 cells.


Conflict of interest statement

Conflict of interest: The authors declare no commercial or financial conflict of interest.

Figures

Figure 1
Figure 1. AhR activation on days 0-3 is sufficient to suppress allo-CTL on day 10
(A) Experimental timeline. Donor cells from B6 mice were injected i.v. into F1 host mice followed by i.p. injection with 10mg/kg Cl-BBQ on days 0-3 or 15μg/kg TCDD on day 0. Grey bars represent the period of AhR activation. Control mice were treated with vehicle on days 0-3. Donor cells were injected into B6 mice as a syngeneic control. Donor (H2Dd) and host (H2Dd+) splenocytes were analyzed on day 10. (B) Body weight change due to the alloresponse relative to Day 6. (C) % CTL (CD8+CD44hiCD45RBlow) gated on donor cells. (D) % CD19+ gated on host cells. Dotted line represents syngeneic control (C and D). Data are presented as mean + SEM. Data in B-D are from a single experiment representative of two independent experiments with 5 mice per group per experiment. *p<0.05, **p<0.01, ***p<0.001 compared to vehicle-treated mice determined by one-way ANOVA with Tukey’s test for multiple comparisons.
Figure 2
Figure 2. AhR-induced transcriptional profile in alloresponding CD4+ donor cells highlights upregulation of T-cell activation and regulatory genes and downregulation of cell cycle genes
Gene expression was analyzed in alloresponding donor (dividing CFSE+) CD4+ cells. For the day 2 gene expression analysis, F1 mice were treated i.p. with 15μg/kg TCDD on day 0 or 2mg/kg Cl-BBQ on days 0 and 1. For the day 3 gene expression analysis F1 mice were treated with 15μg/kg TCDD on day 0 or 10mg/kg Cl-BBQ on days 0-2. (A) Heatmap displays differentially expressed genes compared to vehicle treated mice (p<0.05). (B) Highly differentially regulated genes following TCDD and Cl-BBQ treatment on day 3. Genes that were also differentially expressed on day 2 are depicted in orange. Cell cycle relate genes are depicted in blue. (C) Enriched canonical pathways associated with AhR activation on day 3. Pathways that were also enriched based on the day 2 gene expression data are underlined. Data in A-C are combined from two separate experiments, with 48 hour and 72 hour data performed separately. Data represent 4 mice per treatment group and time point. (D-F) F1 mice were treated i.p. with 15μg/kg TCDD on day 0 or 10mg/kg Cl-BBQ on days 0-3. BrdU was injected i.p. on day 3 and mice were sacrificed on day 4. (D) CFSE dilution in donor CD4+ cells. (E) Division index measured by CFSE dilution. (F) % BrdU+ cells gated on donor CD4+ cells. Data are from a single experiment representative of 2 experiments with 5-6 mice per group per experiment. Bar graphs represent mean + SEM. *p<0.05, **p<0.01, ***p<0.001 determined by one-way ANOVA with Tukey’s test for multiple comparisons.
Figure 3
Figure 3. AhR-induced excess IL-2 is responsible for driving the CD4+CD25+CTLA4+GITR+ donor cell activation phenotype on day 2
(A)Transcription factors that are predicted to function upstream of TCDD-induced upregulated genes on day 2 and 3 and Cl-BBQ-induced upregulated genes on day 3. On day 2, the 2mg/kg Cl-BBQ dose did not lead to predicted TFs and was therefore not included in the analysis. Data are combined from two separate experiments, with 48 hour and 72 hour data collected separately. Data represent 4 mice per treatment group and time point. (B) Donor cells from B6 mice were injected i.v. into F1 host mice followed by i.p. injection with 15μg/kg TCDD on Day 0. IL-2 production on day 1 was measured using a capture flow cytometry assay. (C) CFSE labeled donor cells from B6 mice were injected i.v. into F1 hosts and treated i.p. with anti-IL-2 or isotype control and 15μg/kg TCDD or vehicle. Alloresponding donor (dividing CFSE+) CD4+ cells were analyzed on day 2 for % CD25+CTLA4+GITR+. (D, E) Donor cells from B6 mice were injected i.v. into F1 hosts followed by i.p. injection with 15μg/kg TCDD on Day 0. At 36 hours, the percentage (D) and mean channel fluorescence (MCF) (E) of pSTAT5 and CD25 expressing donor CD25+ cells gated on CD4+ cells. Data in B-E represent mean + SEM and are from single experiments with 5 mice per group. *p<0.05, ***p<0.001. Significant was determined by Student’s t-test (B) or by one-way ANOVA with Tukey’s test for multiple comparisons (C).
Figure 4
Figure 4. Lag3, Tim3, CCR4 and CCR9 are preferentially expressed on AhR-induced CD25+ Tr1 cells
Donor cells from B6 mice were injected i.v. into F1 host followed by i.p. injection with 15μg/kg TCDD on day 0 or 10mg/kg Cl-BBQ on days 0 and 1. On day 2 phenotypic analysis of splenic alloresponding donor CD4+ cells was conducted. (A) Gating strategy for alloresponding donor cells and AhR-induced CD25+ Tr1 cells. (B) Percentage and total number of alloresponding CD4+Foxp3 cells that were CD25+CD62L. (C) Representative FACS plots of Tim3, Lag3, CCR4, and CCR9 expression in alloresponding CD4+ cells and CD4+Foxp3CD25+CD62L cells (left panels) and percentage of marker positive CD4+ T cells (right panels). (D) Coexpression of Lag3 and Tim3 on CD4+Foxp3CD25+CD62L cells. (E) Expression of CCR4 and CCR9 on CD4+Foxp3CD25+CD62LLag3+Tim3+ cells. Data in A-E are from a single experiment representative of 2 experiments with 4 mice per group per experiment. (F) F1 mice were treated i.p. with 15μg/kg TCDD on day 0. BrdU was injected i.p. on day 3 and mice were sacrificed on day 4. BrdU incorporation was evaluated on CD4+CD25+Lag3+Tim3+ cells and the non- CD4+CD25+Lag3+Tim3+ cells. Data are representative of 5 mice per group and present mean + SEM. V: Vehicle-treated, T: TCDD-treated, B: Cl-BBQ treated. *p<0.05, **p<0.01, ***p<0.001 in comparison to vehicle treated mice. #p<0.05, ##p<0.01, ###p<0.001 comparison between alloresponding CD4+ and CD4+Foxp3CD25+CD62L cells. Significant was determined by one-way ANOVA with Tukey’s test for multiple comparisons (B, C, E) or by Student’s t-test (F).
Figure 5
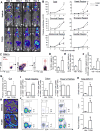
Figure 5. AhR activation enhances the migration of alloresponding CD4+ T cells to mucosal regions
Donor cells from Tlux mice were injected i.v. into F1 host followed by i.p. injection with 15 μg/kg TCDD on day 0. (A) Mice were live imaged for bioluminescence signal daily through day 4. Images are from a single mouse representative of 3 experiments with 3 mice per group per experiment. (B) Photons emitted/sec of regions of interest defined in the top left of panel A was measured each day. Data represent the mean + SEM from one of three experiments with 3 mice per group per experiment. (C-F) On day 4, PBMCs were isolated and CD25, Lag3, Tim3 and CCR9 expression was analyzed on alloresponding donor CD4+ cells (H2Dd-, CFSE diluted). (G,H) On day 4, the intestines were excised from host mice and the whole intestine was imaged for bioluminescence signal. (I-K) Lamina propria cells were isolated from the small intestine and colon and cells in addition to cells isolated from Peyer’s patches. (I) Viable donor CD45+ cells were measured. (J) CD4 and CD8 expression gated on viable donor CD45+ cells. (K) Total AhR-Tr1 cells in the small intestine, colon and Peyer’s patches. Data in C-K are from a single experiment representative of 2 experiments with 3 mice per group per experiment. Data represent mean + SEM. *p<0.05, **p<0.01, ***p<0.001 determined by Student’s t-test.

Similar articles

Cited by

References

    1. Quintana FJ, Sherr DH. Aryl hydrocarbon receptor control of adaptive immunity. Pharmacol Rev. 2013;65:1148–1161. - PMC - PubMed
    1. Stockinger B, Di Meglio P, Gialitakis M, Duarte JH. The aryl hydrocarbon receptor: multitasking in the immune system. Annu Rev Immunol. 2014;32:403–432. - PubMed
    1. Kerkvliet NI. AHR-mediated immunomodulation: the role of altered gene transcription. Biochem Pharmacol. 2009;77:746–760. - PMC - PubMed
    1. Frericks M, Meissner M, Esser C. Microarray analysis of the AHR system: tissue-specific flexibility in signal and target genes. Toxicol Appl Pharmacol. 2007;220:320–332. - PubMed
    1. Marshall NB, Kerkvliet NI. Dioxin and immune regulation: emerging role of aryl hydrocarbon receptor in the generation of regulatory T cells. Ann N Y Acad Sci. 2010;1183:25–37. - PMC - PubMed

Publication types