. 2018 Feb;20(2):427-437.
doi: 10.1111/dom.13088. Epub 2017 Oct 1.

Therapeutic inertia in the treatment of hyperglycaemia in patients with type 2 diabetes: A systematic review

Affiliations

Therapeutic inertia in the treatment of hyperglycaemia in patients with type 2 diabetes: A systematic review

Kamlesh Khunti et al. Diabetes Obes Metab. 2018 Feb.

Abstract

Aims: Therapeutic inertia, defined as the failure to initiate or intensify therapy in a timely manner according to evidence-based clinical guidelines, is a key reason for uncontrolled hyperglycaemia in patients with type 2 diabetes. The aims of this systematic review were to identify how therapeutic inertia in the management of hyperglycaemia was measured and to assess its extent over the past decade.

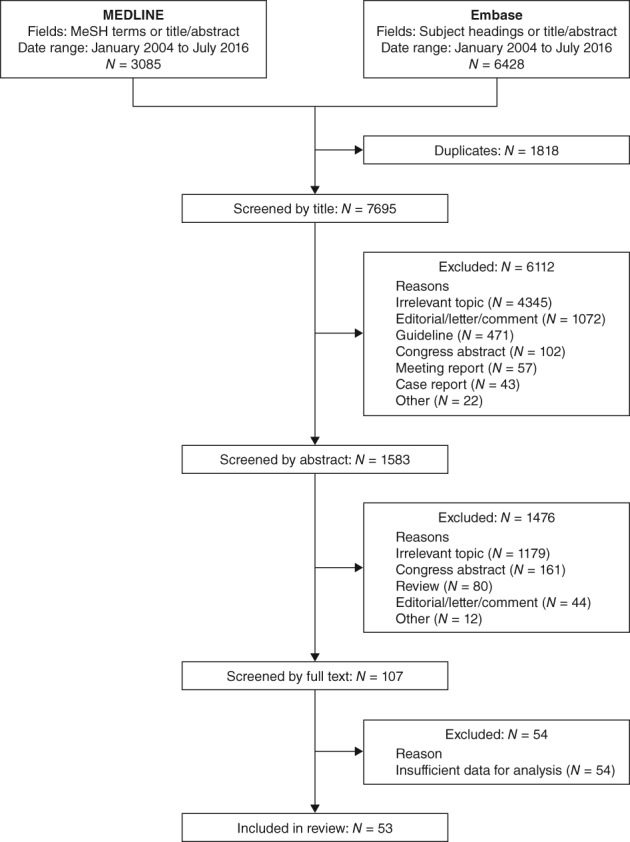
Materials and methods: Systematic searches for articles published from January 1, 2004 to August 1, 2016 were conducted in MEDLINE and Embase. Two researchers independently screened all of the titles and abstracts, and the full texts of publications deemed relevant. Data were extracted by a single researcher using a standardized data extraction form.

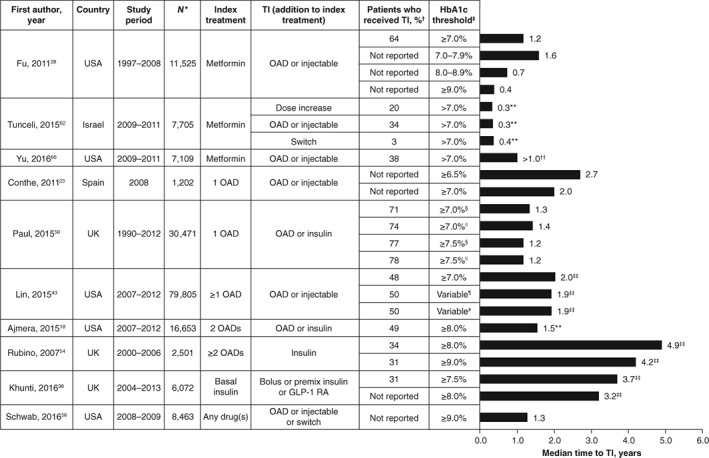
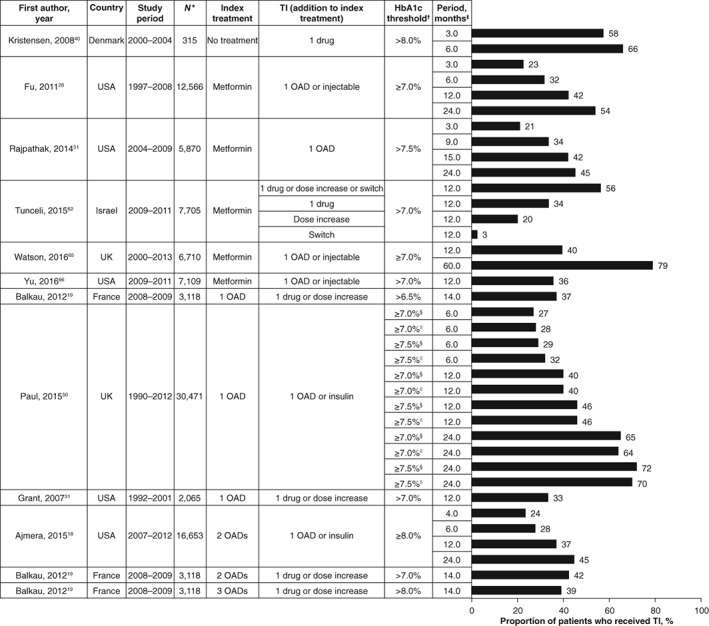
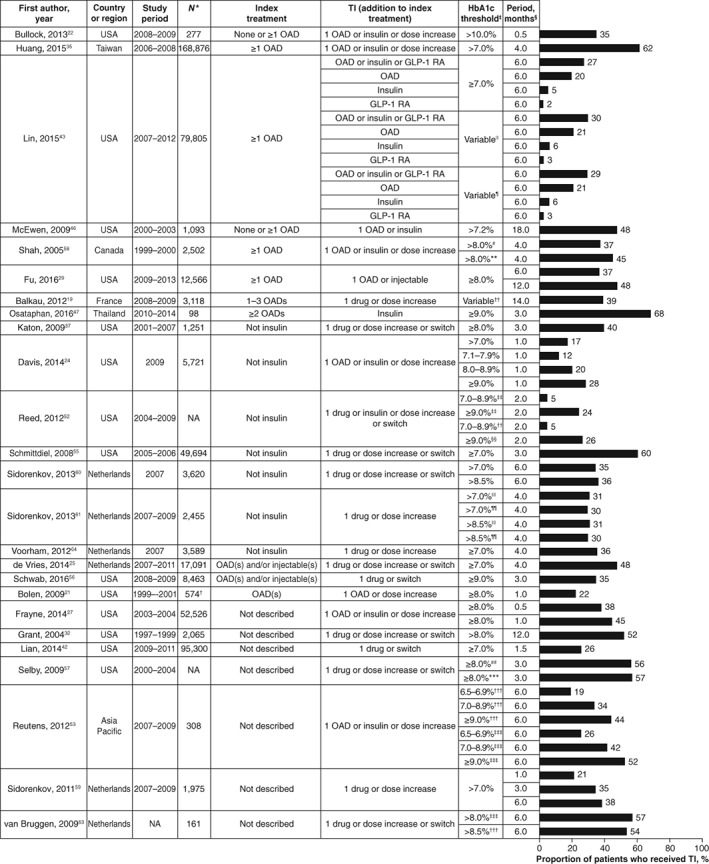
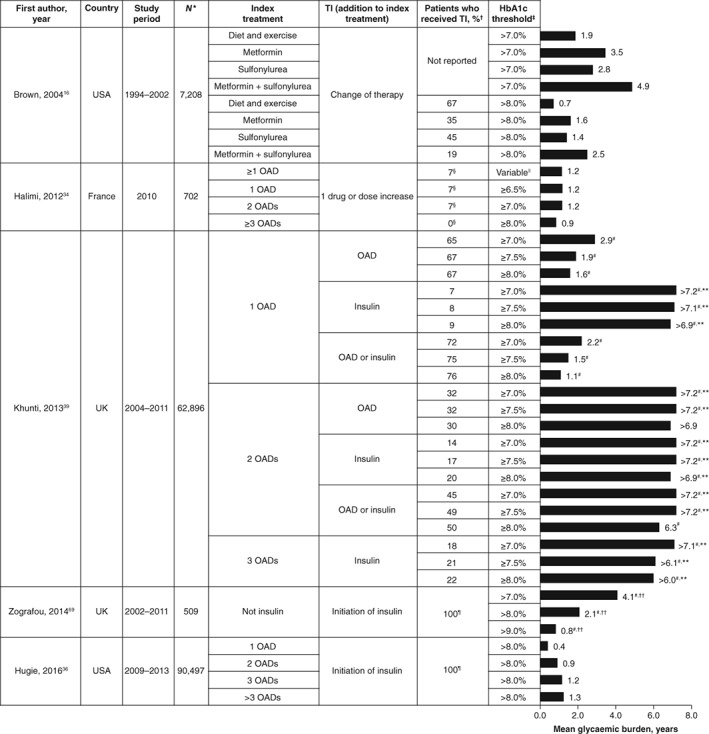
Results: The final selection for the review included 53 articles. Measurements used to assess therapeutic inertia varied across studies, making comparisons difficult. Data from low- to middle-income countries were scarce. In most studies, the median time to treatment intensification after a glycated haemoglobin (HbA1c) measurement above target was more than 1 year (range 0.3 to >7.2 years). Therapeutic inertia increased as the number of antidiabetic drugs rose and decreased with increasing HbA1c levels. Data were mainly available from Western countries. Diversity of inertia measures precluded meta-analysis.

Conclusions: Therapeutic inertia in the management of hyperglycaemia in patients with type 2 diabetes is a major concern. This is well documented in Western countries, but corresponding data are urgently needed in low- and middle-income countries, in view of their high prevalence of type 2 diabetes.

Keywords: antidiabetic drug; glycaemic control; systematic review; type 2 diabetes.


Conflict of interest statement

K. K. has received honoraria and research grants from AstraZeneca, Boehringer Ingelheim, Janssen, Lilly, Merck Sharp & Dohme, Novartis, Novo Nordisk, Roche, Sanofi‐Aventis, Takeda, Bristol‐Myers Squibb and Unilever. K. K. also acknowledges the support of the National Institute for Health Research Collaboration for Leadership in Applied Health Research and Care—East Midlands (NIHR CLAHRC—EM) and the National Institute of Health Research (NIHR) Leicester–Loughborough Diet, Lifestyle and Physical Activity Biomedical Research Unit. M. B. G. has received honoraria from AstraZeneca and Merck‐Serono. S. Po. has received honoraria from AstraZeneca. M. V. S. has received honoraria from AstraZeneca, Boehringer Ingelheim, Eli Lilly, Merck Sharpe & Dohme, Novartis, Novo Nordisk, Sanofi and Servier, and has received research support from Sanofi. S. Pi. is an employee of Oxford PharmaGenesis, which received funding from AstraZeneca. P. F., N. H. and J. M. are employees of AstraZeneca.

Figures

Figure 1
Figure 1
Flow diagram of study selection process. Titles, abstracts and full texts were screened independently by 2 researchers
Figure 2
Figure 2
Median time to treatment intensification. Data are given as median times to treatment intensification from the time HbA1c level was above the threshold shown in the table, unless otherwise stated. *Total number of patients for whom treatment intensification was required in each study. Proportion of patients who received treatment intensification by the end of the study period. HbA1c target used to define inadequate glycaemic control in patients who required treatment intensification. §Consistently above HbA1c target for 1 year post diagnosis. ||Consistently above HbA1c target for 2 years post diagnosis. Modified HbA1c target defined by Ismail‐Beigi et al. that was based on patient age and the presence or absence of macrovascular and microvascular complications, resulting in an individualized HbA1c level between ≤6.5% and <8.0%.70 #Modified Healthcare Effectiveness Data and Information Set (HEDIS) target of HbA1c <7.0% for patients aged <65 years without evidence of significant morbidities and HbA1c <8.0% for all other patients (set by the National Committee for Quality Assurance Healthcare in 2013). **Median time to treatment intensification calculated only for patients who received treatment intensification during the study period. ††Fewer than 50% of patients had received treatment intensification by the end of the study period. ‡‡Estimated by Kaplan–Meier analysis. GLP‐1 RA, glucagon‐like peptide‐1 receptor agonist; HbA1c, glycated haemoglobin; OAD, oral antidiabetic drug; TI, treatment intensification
Figure 3
Figure 3
Proportion of patients who received treatment intensification after a given period of time (patients managed with a defined number of OADs). *Total number of patients for whom treatment intensification was required. HbA1c target used to define suboptimal glycaemic control in patients who required treatment intensification. Length of time to assess treatment intensification after HbA1c level was above target. §Consistently above HbA1c target for 1 year post diagnosis. ||Consistently above HbA1c target for 2 years post diagnosis. HbA1c, glycated haemoglobin; OAD, oral antidiabetic drug; TI, treatment intensification
Figure 4
Figure 4
Proportion of patients who received treatment intensification after a given period of time (number of drugs before treatment intensification not clearly defined). *Total number of patients for whom treatment intensification was required. Total number of clinical encounters that required treatment intensification. HbA1c target used to define suboptimal glycaemic control in patients who required treatment intensification. §Length of time to assess treatment intensification after HbA1c level was above target. ||Modified HbA1c target defined by Ismail‐Beigi et al., which was based on patient age and the presence or absence of macrovascular and microvascular complications, resulting in individualized HbA1c levels between ≤6.5% and <8.0%.70 Modified Healthcare Effectiveness Data and Information Set (HEDIS) target of <7.0% for patients aged <65 years without evidence of significant morbidities and <8.0% for all other patients (set by the National Committee for Quality Assurance Healthcare in 2013). #Primary care. **Specialist care. ††HbA1c level >6.5% for 1 OAD, >7.0% for 2 OADs and >8.0% for 3 OADs. ‡‡Before implementation of electronic health record system. §§After implementation of electronic health record system. ||||One HbA1c measurement above target. ¶¶Two consecutive HbA1c measurements above target. ##In 2011. ***In 2013. †††Control group. ‡‡‡Intervention group (healthcare professional training on clinical guidelines). Abbreviations: GLP‐1 RA, glucagon‐like peptide‐1 receptor agonist; HbA1c, glycated haemoglobin; NA, not available (not reported); OAD, oral antidiabetic drug; TI, treatment intensification
Figure 5
Figure 5
Glycaemic burden (defined as the length of time with HbA1c level above target during a given period of time). Data are shown as means unless otherwise stated. *Total number of patients for whom treatment intensification was required. Proportion of patients who received treatment intensification by the end of the study period. HbA1c target used to define glycaemic burden. §Proportion of patients who received treatment intensification at the inclusion visit. ||HbA1c ≥6.5% for 1 OAD, HbA1c ≥7.0% for 2 OADs and HbA1c ≥8.0% for 3 OADs. Only patients in whom insulin treatment was initiated were included in the study. #Median glycaemic burden. **Fewer than 50% of patients had received treatment intensification by the end of the study period. ††Glycaemic burden was calculated from type 2 diabetes diagnosis to initiation of insulin therapy. HbA1c, glycated haemoglobin; OAD, oral antidiabetic drug; TI, treatment intensification

References

    1. Ray KK, Seshasai SR, Wijesuriya S, et al. Effect of intensive control of glucose on cardiovascular outcomes and death in patients with diabetes mellitus: a meta‐analysis of randomised controlled trials. Lancet. 2009;373:1765–1772. - PubMed
    1. Holman RR, Paul SK, Bethel MA, Matthews DR, Neil HA. 10‐Year follow‐up of intensive glucose control in type 2 diabetes. N Engl J Med. 2008;359:1577–1589. - PubMed
    1. UK Prospective Diabetes Study (UKPDS) Group . Intensive blood‐glucose control with sulphonylureas or insulin compared with conventional treatment and risk of complications in patients with type 2 diabetes (UKPDS 33). Lancet. 1998;352:837–853. - PubMed
    1. Stratton IM, Adler AI, Neil HA, et al. Association of glycaemia with macrovascular and microvascular complications of type 2 diabetes (UKPDS 35): prospective observational study. BMJ. 2000;321:405–412. - PMC - PubMed
    1. Patel A, MacMahon S, Chalmers J, et al. Intensive blood glucose control and vascular outcomes in patients with type 2 diabetes. N Engl J Med. 2008;358:2560–2572. - PubMed

Publication types

MeSH terms

Substances