Review
. 2017 Oct 23;10(20):3866-3913.
doi: 10.1002/cssc.201701076. Epub 2017 Oct 9.

Dendritic Fibrous Nanosilica for Catalysis, Energy Harvesting, Carbon Dioxide Mitigation, Drug Delivery, and Sensing

Affiliations
Review

Dendritic Fibrous Nanosilica for Catalysis, Energy Harvesting, Carbon Dioxide Mitigation, Drug Delivery, and Sensing

Ayan Maity et al. ChemSusChem. .

Abstract

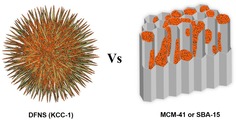
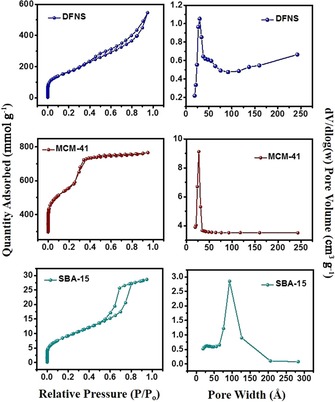
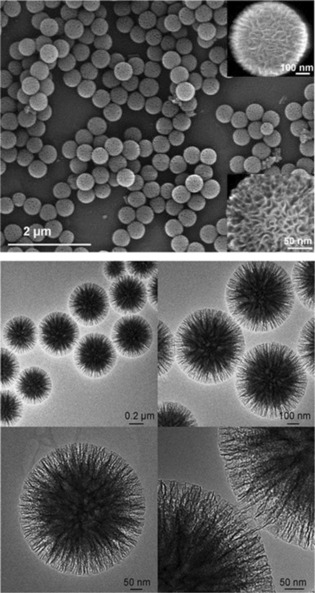
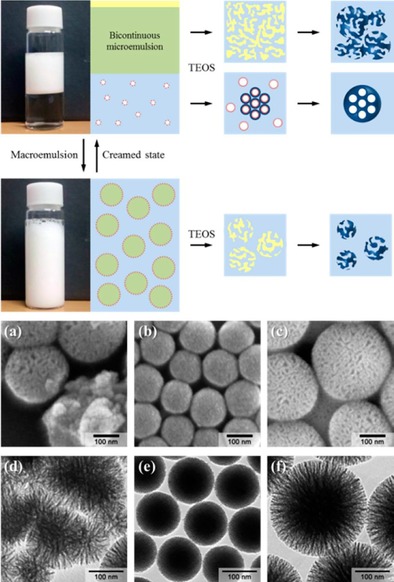
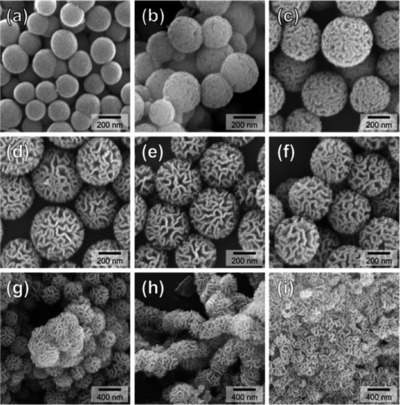
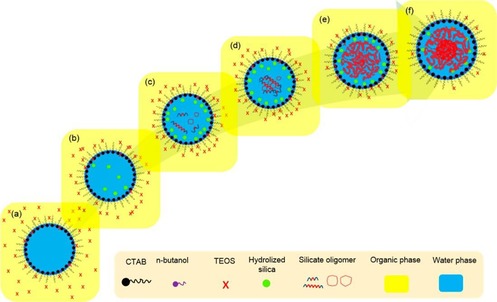
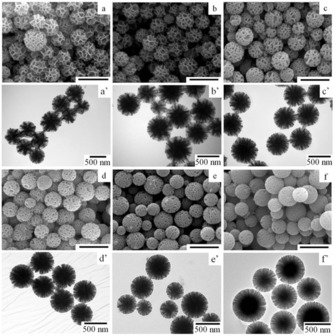
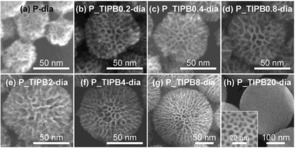
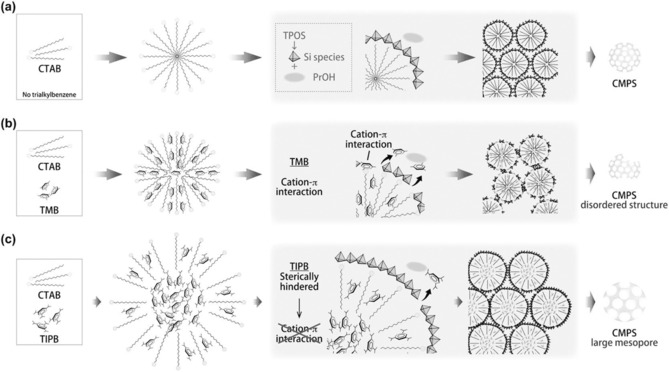
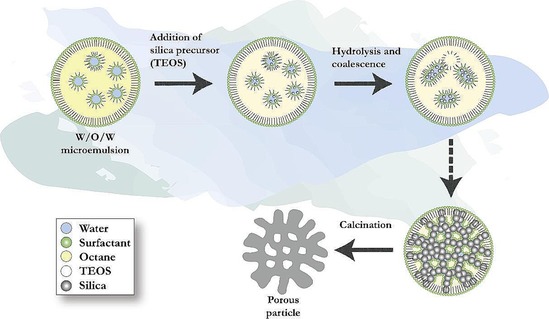
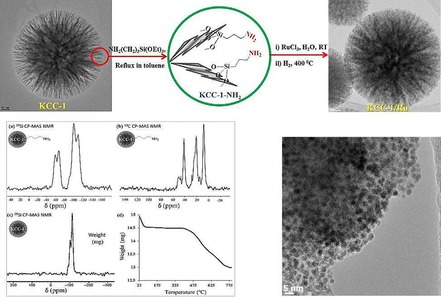
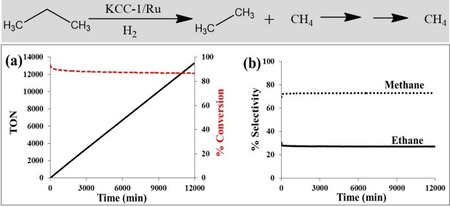
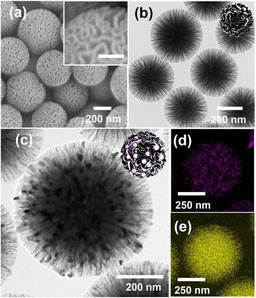
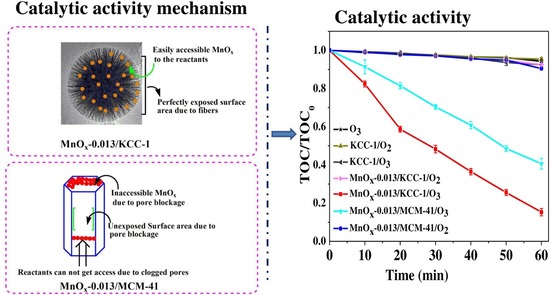
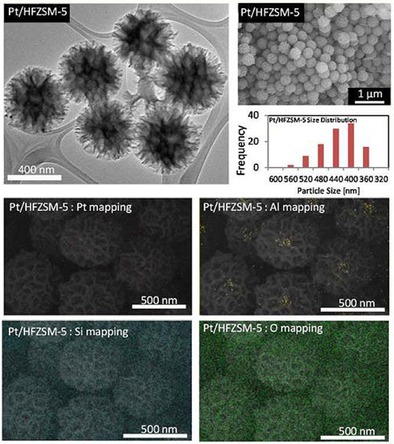
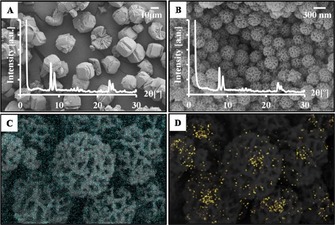
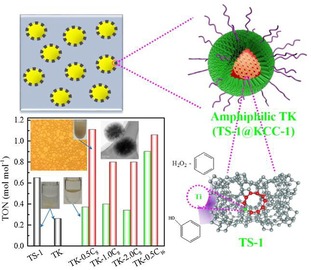
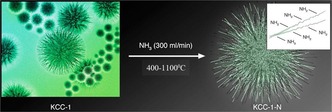
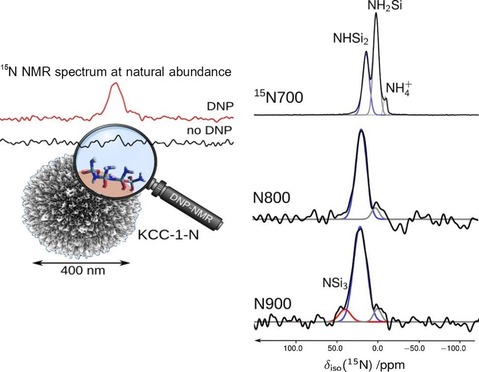
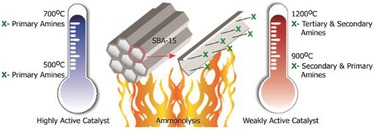
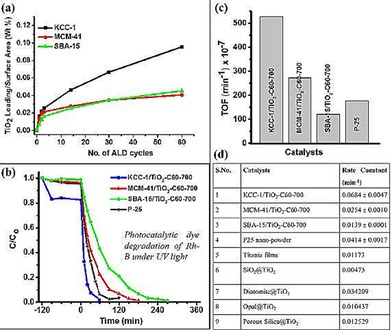
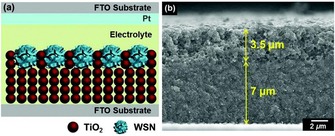
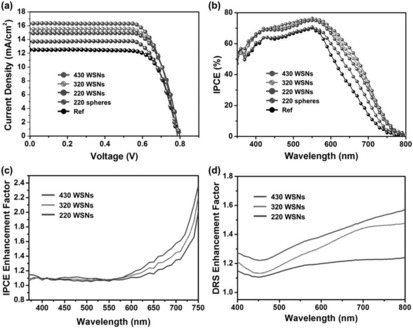
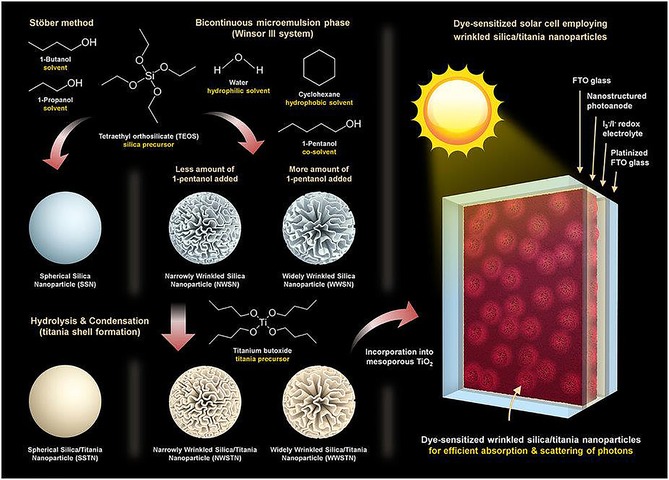
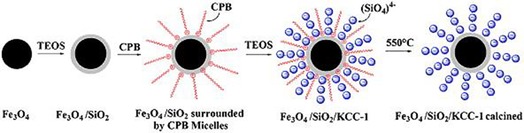
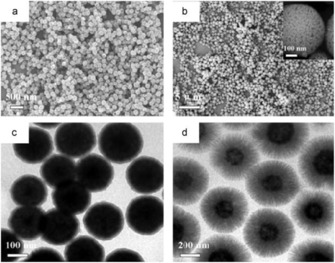
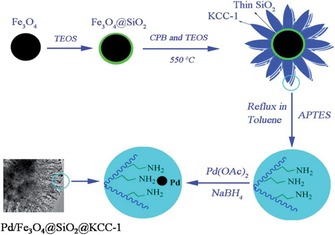
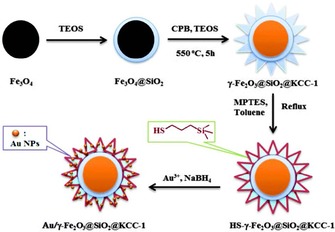
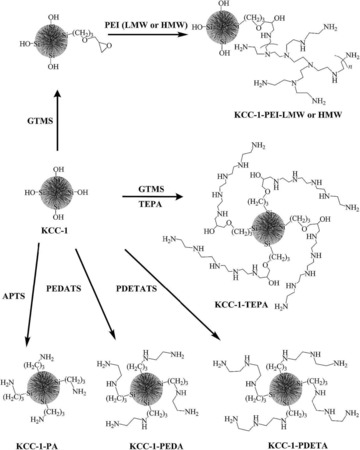
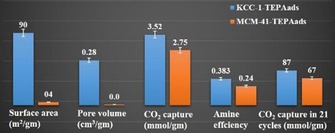
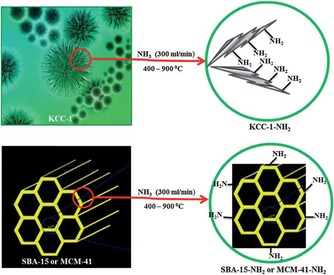
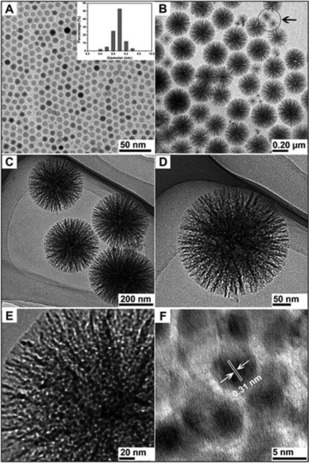
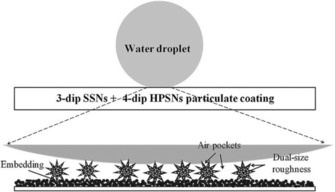
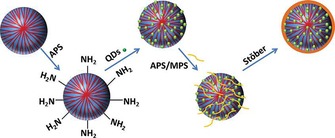
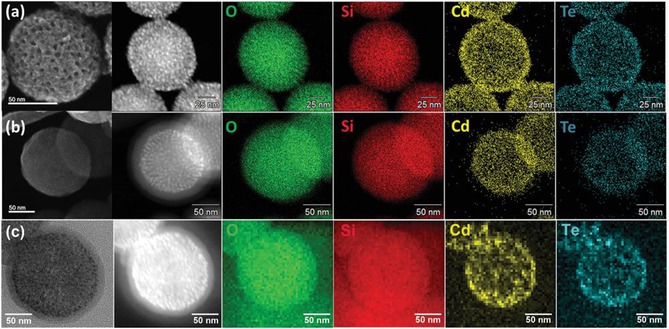
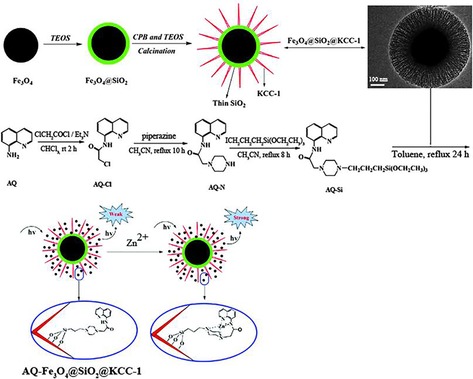
Morphology-controlled nanomaterials such as silica play a crucial role in the development of technologies for addressing challenges in the fields of energy, environment, and health. After the discovery of Stöber silica, followed by that of mesoporous silica materials, such as MCM-41 and SBA-15, a significant surge in the design and synthesis of nanosilica with various sizes, shapes, morphologies, and textural properties has been observed in recent years. One notable invention is dendritic fibrous nanosilica, also known as KCC-1. This material possesses a unique fibrous morphology, unlike the tubular porous structure of various conventional silica materials. It has a high surface area with improved accessibility to the internal surface, tunable pore size and pore volume, controllable particle size, and, importantly, improved stability. Since its discovery, a large number of studies have been reported concerning its use in applications such as catalysis, solar-energy harvesting, energy storage, self-cleaning antireflective coatings, surface plasmon resonance-based ultrasensitive sensors, CO2 capture, and biomedical applications. These reports indicate that dendritic fibrous nanosilica has excellent potential as an alternative to popular silica materials such as MCM-41, SBA-15, Stöber silica, and mesoporous silica nanoparticles. This Review provides a critical survey of the dendritic fibrous nanosilica family of materials, and the discussion includes the synthesis and formation mechanism, applications in catalysis and photocatalysis, applications in energy harvesting and storage, applications in magnetic and composite materials, applications in CO2 mitigation, biomedical applications, and analytical applications.

Keywords: carbon dioxide capture; energy storage; heterogeneous catalysis; hybrid materials; nanostructures.


Figures

Figure 1
Figure 1
Advantages of using DFNS over MCM‐41 or SBA‐15 as a support. Orange dots represent active sites. (The fibers of DFNS are not as sharp and pointed as is shown in this cartoon, and they more so resemble the wrinkled petals of a flower.) Adopted with permission from Ref. 77. Copyright 2016 American Chemical Society.
Figure 2
Figure 2
N2 sorption isotherms (left) and pore‐size distributions (right) of DFNS, MCM‐41, and SBA‐15.
Figure 3
Figure 3
Top) Scanning electron microscopy (SEM) images and bottom) high‐resolution transmission electron microscopy images of fibrous silica nanospheres (DFNS).17
Figure 4
Figure 4
Top) Images and schematic of separated phases in the Winsor III system. Bottom) SEM/TEM images of silica nanoparticles from a, d) the upper microemulsion layer, b, e) the lower aqueous layer, and c, f) the macroemulsion system. Reprinted with permission from Ref. 20. Copyright 2012 American Chemical Society.
Figure 5
Figure 5
SEM images of silica nanomaterials synthesized by changing the water/surfactant/cyclohexane ratio. Reprinted with permission from Ref. 21. Copyright 2014 American Chemical Society.
Figure 6
Figure 6
Schematic of the mechanism of formation of DFNS: a) diffusion of TEOS into a phase boundary, b) hydrolysis of TEOS, c) condensation of hydrolyzed TEOS, d) silicate oligomer formation, e) formation of bicontinuous structured silica, and f) silica with its final bicontinuous concentric morphology. Reprinted with permission from Ref. 22. Copyright 2016 American Chemical Society.
Figure 7
Figure 7
Proposed mechanism for the synthesis of dendritic silica nanospheres. TEAH3=triethanolamine. Reprinted with permission from Ref. 24. Copyright 2014 American Chemical Society.
Figure 8
Figure 8
a–f) SEM and a′–f′) TEM images of amine‐functionalized nanosilica synthesized in an ethanol/ethyl ether (10:20 mL) emulsion system at reaction temperatures of a, a′) 10, b, b′) 15, c, c′) 20, d, d′) 25, e, e′) 30, and f, f′) 35 °C. Scale bars in the SEM images are 1 μm. Reprinted with permission from Ref. 27. Copyright 2015 Royal Society of Chemistry.
Figure 9
Figure 9
SEM images of silica nanospheres prepared by using TIPB and TPOS at various molar ratios (x), denoted P_TIPBx‐dia, for which x=a) 0, b) 0.2, c) 0.4, d) 0.8, e) 2, f) 4, g) 8, and h) 20. Reprinted with permission from Ref. 28. Copyright 2014 Royal Society of Chemistry.
Figure 10
Figure 10
Possible structures of the micelles and the formation of various silica nanospheres: a) without TAB, b) with TMB, and c) with TIPB. CMPS=colloidal mesoporous silica nanoparticles. Reprinted with permission from Ref. 28. Copyright 2014 Royal Society of Chemistry.
Figure 11
Figure 11
Proposed mechanism for the formation of dendritic silica nanoparticles. Reprinted with permission from Ref. 29. Copyright 2016 Elsevier B.V.
Figure 12
Figure 12
Design and synthesis of the DFNS/Ru nanocatalyst. Adapted with permission from Ref. 31. Copyright 2012 American Chemical Society.
Figure 13
Figure 13
a) Conversion TON and b) selectivity for propane hydrogenolysis catalyzed by DFNS/Ru in a continuous‐flow reactor at 175 °C and 0.1 MPa pressure by using hydrogen.31
Figure 14
Figure 14
DFNS‐NH2/Pd‐catalyzed Suzuki coupling reactions of bromoaromatics.32
Figure 15
Figure 15
Synthesis and application of the DFNS/Pd nanocatalyst. APTES=(3‐aminopropyl)triethoxysilane. Reprinted with permission from Ref. 34. Copyright 2015 Elsevier B.V.
Figure 16
Figure 16
Design of DFNS‐supported metal (Rh, Ru, and Pd) nanoparticles by using PEI functionalization. Reprinted with permission from Ref. 37. Copyright 2015 American Chemical Society.
Figure 17
Figure 17
DFNS‐PEI/Pd‐catalyzed carbonylation Suzuki–Miyaura cross‐coupling reaction. Reprinted with permission from Ref. 38. Copyright 2016 Royal Society of Chemistry.
Figure 18
Figure 18
Recyclability of DFNS‐PEI/Pd in the decarbonylation reaction. Reprinted with permission from Ref. 39. Copyright 2016 Wiley‐VCH.
Figure 19
Figure 19
Schematic illustration of the synthesis of silica‐coated Pd by using the reverse‐micelle method. Reprinted with permission from Ref. 41. Copyright 2016 Royal Society of Chemistry.
Figure 20
Figure 20
Top) DFNS/Ag catalyst design and bottom) catalytic reduction of 4‐nitrophenol and 2‐nitroaniline by using the DFNS/Ag catalyst. Reprinted with permission from Ref. 42. Copyright 2014 Elsevier B.V.
Figure 21
Figure 21
Dimethyl oxalate (DMO) to methyl glycolate (MG) conversion by using Ag/KCC‐1 and Ag/MCM‐41. Reprinted with permission from Ref. 44. Copyright 2016 Royal Society of Chemistry.
Figure 22
Figure 22
Engineering the reaction selectivity by controlling the Pt particle size supported on DFNS. Adapted with permission from Ref. 48. Copyright 2016 Royal Society of Chemistry.
Figure 23
Figure 23
TEM images of DFNS‐APTES/Au with Au loadings of a–d) 10 %, e–h) 5 %, i– l) 1 %, m–p) 0.5 %, and q–t) 0.05 % . Reprinted with permission from Ref. 49. Copyright 2016 Royal Society of Chemistry.
Figure 24
Figure 24
Comparison of the DFNS‐APTS/Au (0.05 %) catalyst with various other reported catalysts for the oxidation of dimethylphenylsilane. Single‐digit FOM values were scaled to 20 for visualization in the figure. Reprinted with permission from Ref. 49. Copyright 2017 Royal Society of Chemistry.
Figure 25
Figure 25
a) Synthesis of WSN‐NH2 by APTS functionalization of WSNs, b) treatment with Co(NO3)2 6 H2O, and c) in situ reduction of WSN‐CoO. Reprinted with permission from Ref. 50. Copyright 2016 Korean Chemical Society and Wiley‐VCH.
Figure 26
Figure 26
a) SEM and b) TEM images of WSNs. The inset scale bar is 100 nm. c) HRTEM image of WSN‐CoO. Bottom‐right panel) Energy‐dispersive X‐ray spectroscopy (EDS) elemental mapping of WSN‐CoO showing d) cobalt and e) silicon. Reprinted with permission from Ref. 50. Copyright 2016 Korean Chemical Society and Wiley‐VCH.
Figure 27
Figure 27
The MnOxY/DFNS catalyst in the ozonation of oxalic acid. Reprinted with permission from Ref. 51. Copyright 2016 Elsevier B.V.
Figure 28
Figure 28
TEM, field‐emission scanning electron microscopy (FESEM), particle‐size distribution, and EDS elemental mapping of Pt/HFZSM‐5. Reprinted with permission from Ref. 53. Copyright 2016 Royal Society of Chemistry.
Figure 29
Figure 29
FESEM images and X‐ray diffraction patterns of a) RmZSM‐5 and b) FmZSM‐5 and EDS elemental mapping of c) Si and d) Al in FmZSM‐5. Reprinted with permission from Ref. 54. Copyright 2016 Elsevier B.V.
Figure 30
Figure 30
Rates of a) CO conversion and b) CH4 formation at a gas hourly space velocity of 13 500 mL g−1 h−1 and H2/CO=8:1 and c) the rate versus oxygen vacancy and basicity. Reprinted with permission from Ref. 54. Copyright 2016 Elsevier B.V.
Figure 31
Figure 31
a, b) SEM images, c) TEM images, and d) EDS elemental mapping of the A) ASN‐40 and B) ASPN‐40 samples. Reprinted with permission from Ref. 55. Copyright 2014 Royal Society of Chemistry.
Figure 32
Figure 32
a) Cracking of 1,3,5‐triisopropylbenzene (1,3,5‐TIPB) and b) hydrolysis of sucrose by using ASN‐40, ASPN‐40, AlMCM‐41, and HZSM‐5. Each line in panel a indicates a fitted curve by the first‐order deactivation model. Reprinted with permission from Ref. 55. Copyright 2014 Royal Society of Chemistry.
Figure 33
Figure 33
a) Degradation of 2,4‐dichlorophenoxyacetic acid (BPA) and b) total organic carbon (TOC) removal by using H2O2. Reprinted with permission from Ref. 56. Copyright 2016 Royal Society of Chemistry.
Figure 34
Figure 34
Schematic illustration of pollutants or H2O2 in contact with a) a catalyst with the active component in the bulk (such as γ‐Al2O3), b) a multiporous catalyst (such as MCM‐41), and c) DCASNs. Reprinted with permission from Ref. 56. Copyright 2016 Royal Society of Chemistry.
Figure 35
Figure 35
Schematic for the synthesis of Rh(OH)3/TS‐1@DFNS and its application in the one‐pot synthesis of amides. Reprinted with permission from Ref. 57. Copyright 2013 Royal Society of Chemistry.
Figure 36
Figure 36
SEM and TEM images of a, c) TS‐1 and b, d) TK. Reprinted with permission from Ref. 59. Copyright 2015 American Chemical Society.
Figure 37
Figure 37
Benzene hydroxylation under PIC, PBC, and conventional conditions. Reprinted with permission from Ref. 59. Copyright 2015 American Chemical Society.
Figure 38
Figure 38
Schematic of the hydroxylation of benzene under pickering interfacial catalysis (PIC) by using TK. Reprinted with permission from Ref. 59. Copyright 2015 American Chemical Society.
Figure 39
Figure 39
Nitridation of DFNS by using ammonia at different temperatures. Reprinted with permission from Ref. 62. Copyright 2013 American Chemical Society.
Figure 40
Figure 40
DNP‐enhanced 15N NMR spectra of nitridated DFNS.63
Figure 41
Figure 41
Tuning the catalytic activity by the controlled ammonolysis of SBA‐15.64
Figure 42
Figure 42
Dehydration of fructose to 5‐hydroxymethylfurfural (HMF) and possible byproducts by acid catalysis. Reprinted with permission from Ref. 66. Copyright 2016 Royal Society of Chemistry.
Figure 43
Figure 43
Synthesis of a DFNS‐ionic liquid‐Au nanocatalyst . Reprinted with permission from Ref. 67. Copyright 2014 Royal Society of Chemistry.
Figure 44
Figure 44
Schematic for the synthesis of Fe3O4/DFNS/IL/HPW. Reprinted with permission from Ref. 70. Copyright 2016 Royal Society of Chemistry.
Figure 45
Figure 45
DFNS‐supported tantalum hydride (TaH) for the hydrometathesis of olefins.73
Figure 46
Figure 46
Synthesis of 2‐oxazolidinone by using the DFNS‐supported gold complex. Reprinted with permission from Ref. 74. Copyright 2016 Elsevier B.V.
Figure 47
Figure 47
Synthesis of g‐C3N4 nanospheres by using DFNS as a template and cyanamide (CY) as a precursor.76
Figure 48
Figure 48
Synthesis of g‐C3N4 nanospheres by using DFNS as a template and a mixture of melamine and 2,4,6‐triaminopyrimidine as precursors. Reprinted with permission from Ref. 79. Copyright 2015 American Chemical Society.
Figure 49
Figure 49
Scanning transmission electron microscopy (STEM) and EDS mapping of the DFNS/TiO2 series materials with varied ALD cycles of TiO2. Reprinted with permission from Ref. 77. Copyright 2016 American Chemical Society.
Figure 50
Figure 50
Advantages of using DFNS over MCM‐41 or SBA‐15 as a support for TiO2: a) TiO2 loading in weight % per unit surface area, b) photocatalytic dye degradation of rhodamine B (Rh‐B) under UV light, c) turnover frequency (TOF) values, and d) comparison with reported silica‐supported TiO2 catalysts. Adapted with permission from Ref. 77. Copyright 2016 American Chemical Society.
Figure 51
Figure 51
DSSC design containing DFNS/TiO2 as a scatterer (top layer): a) schematic illustration and b) cross‐sectional SEM image (the DFNS/TiO2 layer is 3.5 μm and the TiO2 nanoparticle layer is 7 μm). FTO=fluorine‐doped tin oxide. Reprinted with permission from Ref. 80. Copyright 2016 Royal Society of Chemistry.
Figure 52
Figure 52
a) Current density–voltage (JV) characteristics and b) incident photon‐to‐current efficiency (IPCE) spectra of DSSCs based on WSNs with various sizes and 220 nm solid silica nanospheres. c) IPCE enhancement factor (IPCEsample/IPCE220spheres) and d) diffuse reflectance spectroscopy (DRS) enhancement factor (DRSsample/DRS220spheres) based on the 220 nm spheres. Reprinted with permission from Ref. 80. Copyright 2016 Royal Society of Chemistry.
Figure 53
Figure 53
TiO2‐coated fibrous nanosilica as a scatterer in DDSCs. Reprinted with permission from Ref. 81. Copyright 2016 Nature Publishing Group (NPG).
Figure 54
Figure 54
Synthetic scheme for core–shell Fe3O4/SiO2/DFNS materials. Reprinted with permission from Ref. 84. Copyright 2013 Elsevier B.V.
Figure 55
Figure 55
SEM images of a) Fe3O4 and b) Fe3O4/SiO2/DFNS and TEM images of c) Fe3O4/SiO2 and d) Fe3O4/SiO2/DFNS. Reprinted with permission from Ref. 84. Copyright 2013 Elsevier B.V.
Figure 56
Figure 56
Schematic for the synthesis of the Pd/Fe3O4@SiO2@DFNS nanocatalyst. Reprinted with permission from Ref. 85. Copyright 2014 Royal Society of Chemistry.
Figure 57
Figure 57
Schematic for the synthesis of Au/γ‐Fe2O3@SiO2@DFNS. MPTES=3‐mercaptopropyltrimethoxysilane. Reprinted with permission from Ref. 86. Copyright 2015 Royal Society of Chemistry.
Figure 58
Figure 58
Reduction of 4‐nitrophenol to 4‐aminophenol over Au/g‐Fe2O3@SiO2@DFNS and magnetic catalyst recycling. Reprinted with permission from Ref. 86. Copyright 2015 Royal Society of Chemistry.
Figure 59
Figure 59
Magnetization curves of Ni@Au NPs and Ni@Au/DFNS at room temperature. Reprinted with permission from Ref. 87. Copyright 2014 Elsevier B.V.
Figure 60
Figure 60
SEM images of DFNS/nylon‐6 composite nanofibers with varying DFNS concentrations: a) 0, b) 20, c) 33, and d) 50 % w/w. The scale bars are 2.00 μm Reprinted with permission from Ref. 89. Copyright 2015 Springer.
Figure 61
Figure 61
HRTEM images of a) the DFNS silica template, b) the DFNS carbon composite after drying, c) the DFNS carbon composite after aging, and d) CNE. e) An image of a real Echinometra mathaei. SEM images of f) a particle of CNE, g) the cross‐section of CNE, and h) their large‐scale view.90
Figure 62
Figure 62
Functionalization of DFNS with various amines. PEDATS=please define, PDETATS=N‐(3‐trimethoxysilylpropyl)diethylenetriamine. Reprinted with permission from Ref. 93. Copyright 2016 Royal Society of Chemistry.
Figure 63
Figure 63
Effect of support morphology on CO2 capture for DFNS versus MCM‐41. Reprinted with permission from Ref. 93. Copyright 2016 Royal Society of Chemistry.
Figure 64
Figure 64
Synthesis of silicon oxynitrides by the ammonolysis of DFNS, SBA‐15, and MCM‐41. Reprinted with permission from Ref. 94. Copyright 2012 Royal Society of Chemistry.
Figure 65
Figure 65
a) TEM image of 9 nm Fe3O4 used as seeds. b–e) TEM images and f) HRTEM image of Fe3O4/DFNS, renamed Fe3O4/FMSMs. Reprinted with permission from Ref. 96. Copyright 2011 Royal Society of Chemistry.
Figure 66
Figure 66
a) Drug‐release profile of DOX‐Fe3O4/FMSMs in phosphate‐buffered saline (PBS), b) the nuclei of blank SKOV3 cells and the nuclei of SKOV3 cells incubated with DOX‐Fe3O4/FMSMs for c) 8 h and d) 24 h. Reprinted with permission from Ref. 96. Copyright 2011 Royal Society of Chemistry.
Figure 67
Figure 67
DOX release from FMSMs‐A, FMSMs‐B, FMSMs‐C, and FMSMs‐D. Reprinted with permission from Ref. 97. Copyright 2012 Royal Society of Chemistry.
Figure 68
Figure 68
FMSMs‐D biocompatibility using an MTT [3‐(4,5‐dimethylthiazol‐2‐yl)‐2,5‐diphenyltetrazolium bromide] assay, incubated with L929 fibroblast cells for 24 h. Reprinted with permission from Ref. 97. Copyright 2012 Royal Society of Chemistry.
Figure 69
Figure 69
Design of hybrid HPSNs‐PEI and their use as nanocarriers for drug delivery.98
Figure 70
Figure 70
a) The in vitro cumulative TPT release profiles of HPSNs‐PEI in PBS at various pH values. b) Loading capacity of nucleic acid (pDNA). Reprinted with permission from Ref. 98. Copyright 2013 Wiley‐VCH.
Figure 71
Figure 71
Paclitaxel‐loaded wrinkled periodic mesoporous organosilica. Reprinted with permission from Ref. 100. Copyright 2015 Springer.
Figure 72
Figure 72
Paclitaxel drug uptake by periodic mesoporous organosilica (PMO) and mesoporous silica (MS) nanoparticles. Reprinted with permission from Ref. 100. Copyright 2015 Springer.
Figure 73
Figure 73
Schematic for the preparation of KCC‐NH2, KCC‐NH2‐Ext, KCC‐NH2‐ E, and KCC‐NH2‐I. Reprinted with permission from Ref. 101. Copyright 2014 American Chemical Society.
Figure 74
Figure 74
Adsorption of salmon DNA in a) KCC‐1, KCC‐NH2, and KCC‐NH‐NH2 and in b) MCM‐41 and MCM‐NH2. Reprinted with permission from Ref. 101. Copyright 2014 American Chemical Society.
Figure 75
Figure 75
Top) Agarose gel electrophoresis of the supernatants after binding CpG ODN to aminated DMSNs at various weight ratios of a) DMSN97‐NH2/CPG, b) DMSN205‐NH2/CpG, and c) DMSN535‐NH2/CpG. Bottom) CpG ODN loading capacities on aminated DMSNs at various weight ratios of a) DMSN97‐NH2, b) DMSN205‐NH2/CpG, and c) DMSN535‐NH2/CpG and d) the release percentages of CpG ODN from the DMSN97‐NH2/CpG, DMSN205‐NH2/CpG, and DMSN535‐NH2/CpG complexes. Reprinted with permission from Ref. 102. Copyright 2016 American Scientific Publishers.
Figure 76
Figure 76
a) Bacterial growth kinetics of E. coli incubated with free lysozyme and MSNs loaded with lysozyme and b) a photograph of the agar plates of E. coli and MSNs loaded with lysozyme suspension with concentration of 500 mg mL−1 after 5 days of incubation. Reprinted with permission from Ref. 103. Copyright 2016 Royal Society of Chemistry.
Figure 77
Figure 77
Synthesis of Cur‐Ca@DMSNs‐FA and its pH‐responsive drug release. SA=succinic anhydride. Reprinted with permission from Ref. 105. Copyright 2016 American Chemical Society.
Figure 78
Figure 78
a) Solubility of free Cur and Cur‐Ca@DMSNs‐FA in different solvents: i) Free Cur (2 mg) in PBS at pH 7.4 (insoluble), ii) free Cur (2 mg) in EtOH (fully soluble), iii) Cur‐Ca@DMSNs‐FA (25 mg, equivalent of 2 mg Cur) in PBS at pH 7.4 (dispersed), and iv) Cur‐Ca@DMSNs‐FA (25 mg) in PBS (pH 5.0). b) Cur release profiles from Cur‐Ca@DMSNs‐FA in PBS at pH 5.0 and 7.4 containing Tween‐80 (10 % v/v). Reprinted with permission from Ref. 105. Copyright 2016 American Chemical Society.
Figure 79
Figure 79
Design and preparation of DOX/PPy@DSNs‐PEG for PTA therapy. Reprinted with permission from Ref. 107. Copyright 2016 Royal Society of Chemistry.
Figure 80
Figure 80
a) UV/Vis absorption spectra of PPy@DSNs‐NH2 and PPy@DSNs‐PEG. Photothermal heating curves of PPy@DSNs‐PEG aqueous dispersions b) at different concentrations under λ=808 nm laser irradiation (power density=1 W cm−2). c) 250 mg mL−1 dispersions at various power densities. d) Change in temperature of PPy@DSNs‐PEG aqueous dispersions (250 mg mL−1) over laser on–off cycles under λ=808 nm laser irradiation (power density=1 W cm−2). Reprinted with permission from Ref. 107. Copyright 2016 Royal Society of Chemistry.
Figure 81
Figure 81
a) N2 sorption isotherms and pore‐size distribution curves (inset). b) DOX loading efficiency (LE) and entrapment efficiency (EE), DOX solutions before and after loading (inset) of PPy@DSNs‐PEG. Cumulative release profiles of DOX from DOX/PPy@DSNs‐PEG at different pH values c) without and d) with 1 W cm−2 NIR irradiation. Reprinted with permission from Ref. 107. Copyright 2016 Royal Society of Chemistry.
Figure 82
Figure 82
DOPC lipid‐coated platinum drug‐loaded holmium‐165‐containing DFNS. Reprinted with permission from Ref. 108. Copyright 2014 AIP Publishing.
Figure 83
Figure 83
Fluorescence micrographs (400×) of L929 cells treated with 10 ppm magnetic and fluorescent DFNS for 1 h, followed by counterstaining of cell nuclei with 10 μmol L−1 DAPI. a) Phase contrast image of the cells colabeled with the composites and DAPI. b, c) Fluorescence images of the cells collected at λ exc=450 nm (green, from the composites) and λ exc=350 nm (blue, from the DAPI), respectively. d) Merged image of panels b and c. Reprinted with permission from Ref. 110. Copyright 2013 IOP Publishing.
Figure 84
Figure 84
Dependence of the water contact angle on the cycle number of dip‐coated HPSNs on the surface of glass slides. Reprinted with permission from Ref. 111. Copyright 2016 Royal Society of Chemistry.
Figure 85
Figure 85
SEM images of the a, b) 3‐dip SSN coatings, c, d) 3‐dip SSN+2‐dip HPSN coating, and e, f) 3‐dip SSN+4‐dip HPSN coating after calcination and hydrophobic modification. The inset in panel b is the corresponding cross‐sectional image. Reprinted with permission from Ref. 111. Copyright 2016 Royal Society of Chemistry.
Figure 86
Figure 86
Proposed illustration of a water drop on the surface of a treated glass slide, according to the Cassie–Baxter wetting state. Reprinted with permission from Ref. 111. Copyright 2016 Royal Society of Chemistry.
Figure 87
Figure 87
Synthesis of mSiO2@CdTe@SiO2 fluorescent nanoparticles.112 APS=(3‐aminopropyl)triethoxysilane, MPS=(3‐mercaptopropyl)trimethoxysilane.
Figure 88
Figure 88
STEM images and EDS elemental mapping of a) mSiO2@CdTe, b) mSiO2@CdTe@SiO2, and c) an ultramicrotomed mSiO2@CdTe@SiO2 slice. Reprinted with permission from Ref. 112. Copyright 2016 Wiley‐VCH.
Figure 89
Figure 89
Schematic for the synthesis of AQ‐Fe3O4@SiO2@DFNS. Reprinted with permission from Ref. 115. Copyright 2015 Royal Society of Chemistry.
Figure 90
Figure 90
a) Schematic for the detection of AsIII by using a DFNS‐loaded gold thin film by using the SPR technique and the b) SPR spectra before (orange line) and after (blue line) exposure of the DFNS‐loaded gold film to an AsIII solution (400 nm) under flow conditions for 1 h. Reprinted with permission from Ref. 118. Copyright 2014 Royal Society of Chemistry.
Figure 91
Figure 91
Comparison between a) conventional ELISA and b) ELISA+ with the use of DMSN. Reprinted with permission from Ref. 119. Copyright 2016 Royal Society of Chemistry.
Figure 92
Figure 92
Optical density (OD) values of commercial ELISA and ELISA+ at different insulin concentrations. The numbers (1, 1:10, 1:100, 1:1000, and 1:2000) on the x axis represent the insulin dilution times of LOD (detection limit of the commercial ELISA kit). Reprinted with permission from Ref. 119. Copyright 2016 Royal Society of Chemistry.
Figure 93
Figure 93
TEM image of solid core–fibrous shell silica nanoparticles. Reprinted with permission from Ref. 120. Copyright 2015 American Chemical Society.
Figure 94
Figure 94
HPLC separation of a mixture of five peptides with a back pressure of 21.7 MPa. Peaks: 0, solvent; 1, R‐V‐Y‐H‐P‐I (883.1 Da); 2, R‐V‐Y‐V‐H‐P‐F (917.1 Da); 3, A‐P‐G‐D‐R‐I‐Y‐V‐H‐P‐F (1271.4 Da); 4, D‐R‐V‐Y‐VH‐P‐F‐H‐L (1282.5 Da); 5, D‐R‐V‐Y‐I‐H‐P‐F‐H‐L (1296.5 Da). Reprinted with permission from Ref. 120. Copyright 2015 American Chemical Society.
Figure 95
Figure 95
SEM images of a) DFNS‐NH2 (FSS) and b–d) HCCSg1.0 and e, f) TEM images of HCCSg1.0. Reprinted with permission from Ref. 121. Copyright 2015 Elsevier B.V.
Figure 96
Figure 96
a) CV curves of the HCSSg1.0 electrode and b) gravimetric specific capacitance calculated based on the CV curves at a scan rate of 5 mV s−1. Reprinted with permission from Ref. 121. Copyright 2015 Elsevier B.V.
Figure 97
Figure 97
a) GCD curves of the HCSSg1.0 electrode at different current densities, b) gravimetric and volumetric specific capacitances versus current densities for the HCSSg1.0 electrode, c) comparison of the volumetric and gravimetric capacitance of HCSSg1.0 calculated on the basis of the discharge curve at a density of 0.5 A g−1 with other reported carbon electrodes, and d) gravimetric capacitance calculated from the corresponding discharge curves. Reprinted with permission from Ref. 121. Copyright 2015 Elsevier B.V.

References

    1. Davis M. E., Nature 2002, 417, 813–821. - PubMed
    1. Prieto G., Tüysüz H., Duyckaerts N., Knossalla J., Wang G.-H., Schüth F., Chem. Rev. 2016, 116, 14056–14119. - PubMed
    1. Catalysis: From Principles to Applications (Eds.: M. Beller, A. Renken, R. A. van Santen), Wiley-VCH, Weinheim, 2012.
    1. Catalysis: Concepts and Green Applications (Ed.: G. Rothenberg), Wiley-VCH, Weinheim, 2008.
    1. Nanocatalysis: Synthesis and Applications (Eds.: V. Polshettiwar, T. Asefa), Wiley, Hoboken, NJ, 2013.

Publication types

MeSH terms