

The modified south African triage scale system for mortality prediction in resource-constrained emergency surgical centers: a retrospective cohort study
- PMID: 28835247
- PMCID: PMC5569494
- DOI: 10.1186/s12913-017-2541-4
The modified south African triage scale system for mortality prediction in resource-constrained emergency surgical centers: a retrospective cohort study
Abstract
Background: The South African Triage Scale (SATS) was developed to facilitate patient triage in emergency departments (EDs) and is used by Médecins Sans Frontières (MSF) in low-resource environments. The aim was to determine if SATS data, reason for admission, and patient age can be used to develop and validate a model predicting the in-hospital risk of death in emergency surgical centers and to compare the model's discriminative power with that of the four SATS categories alone.
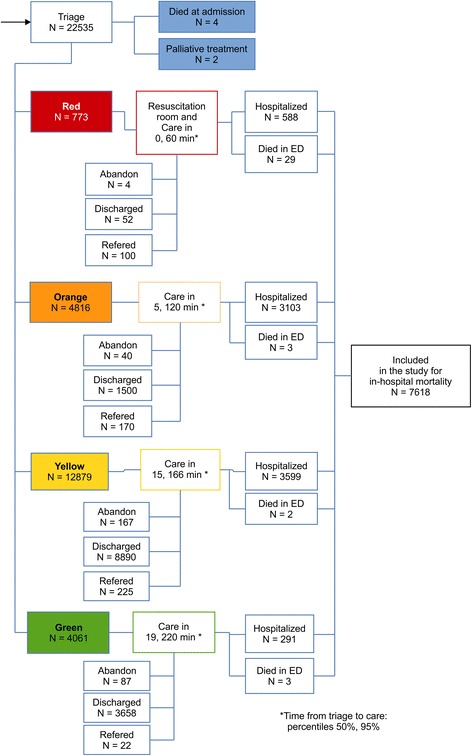
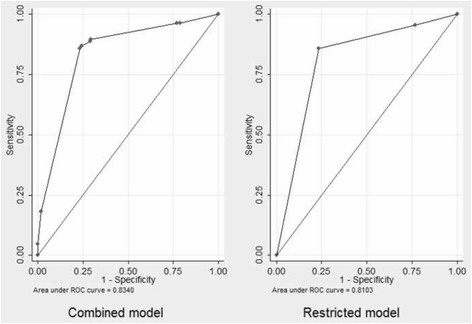
Methods: We used data from a cohort hospitalized at the Nap Kenbe Surgical Hospital in Haiti from January 2013 to June 2015. We based our analysis on a multivariate logistic regression of the probability of death. Age cutoff, reason for admission categorized into nine groups according to MSF classifications, and SATS triage category (red, orange, yellow, and green) were used as candidate parameters for the analysis of factors associated with mortality. Stepwise backward elimination was performed for the selection of risk factors with retention of predictors with P < 0.05, and bootstrapping was used for internal validation. The likelihood ratio test was used to compare the combined and restricted models. These models were also applied to data from a cohort of patients from the Kunduz Trauma Center, Afghanistan, to validate mortality prediction in an external trauma patients population.
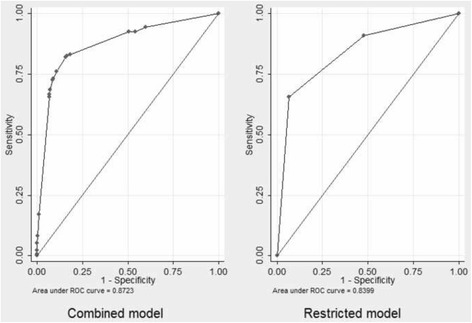
Results: A total of 7618 consecutive hospitalized patients from the Nap Kenbe Hospital were analyzed. Variables independently associated with in-hospital mortality were age > 45 and < = 65 years (odds ratio, 2.04), age > 65 years (odds ratio, 5.15) and the red (odds ratio, 65.08), orange (odds ratio, 3.5), and non-trauma (odds ratio, 3.15) categories. The combined model had an area under the receiver operating characteristic curve (AUROC) of 0.8723 and an AUROC corrected for optimism of 0.8601. The AUROC of the model run on the external data-set was 0.8340. The likelihood ratio test was highly significant in favor of the combined model for both the original and external data-sets.
Conclusions: SATS category, patient age, and reason for admission can be used to predict in-hospital mortality. This predictive model had good discriminative ability to identify ED patients at a high risk of death and performed better than the SATS alone.
Keywords: Emergency department; Limited resource setting; Prognostic model; Triage.
Conflict of interest statement
Ethics approval and consent to participate
Ethical approval was obtained from the
Consent for publication
Not applicable.
Competing interests
On behalf of all the authors, the corresponding author states that there is no conflict of interest.
Publisher’s Note
Springer Nature remains neutral with regard to jurisdictional claims in published maps and institutional affiliations.
Figures
References
Publication types
MeSH terms
LinkOut - more resources
Full Text Sources
Other Literature Sources
Research Materials
Miscellaneous
