. 2017 Aug 23;18(1):158.
doi: 10.1186/s13059-017-1291-2.

Conservation and divergence of small RNA pathways and microRNAs in land plants

Affiliations

Conservation and divergence of small RNA pathways and microRNAs in land plants

Chenjiang You et al. Genome Biol. .

Abstract

Background: As key regulators of gene expression in eukaryotes, small RNAs have been characterized in many seed plants, and pathways for their biogenesis, degradation, and action have been defined in model angiosperms. However, both small RNAs themselves and small RNA pathways are not well characterized in other land plants such as lycophytes and ferns, preventing a comprehensive evolutionary perspective on small RNAs in land plants.

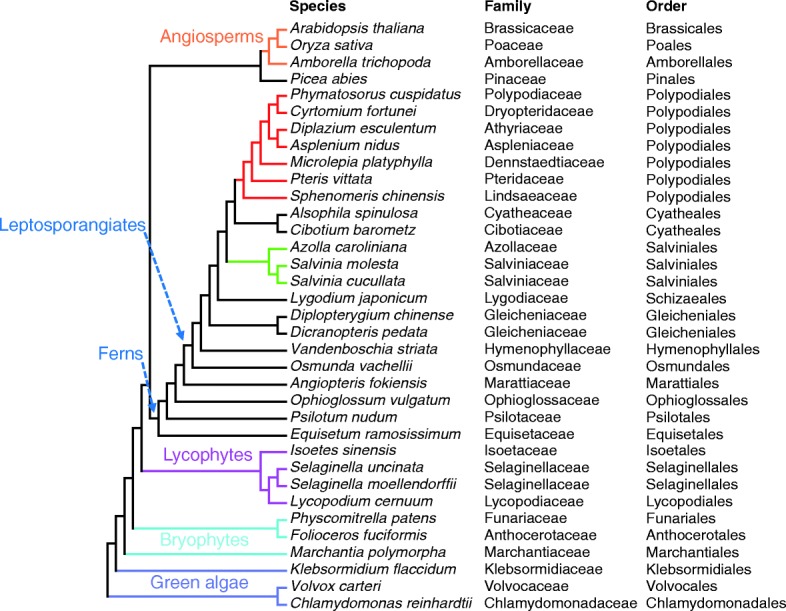
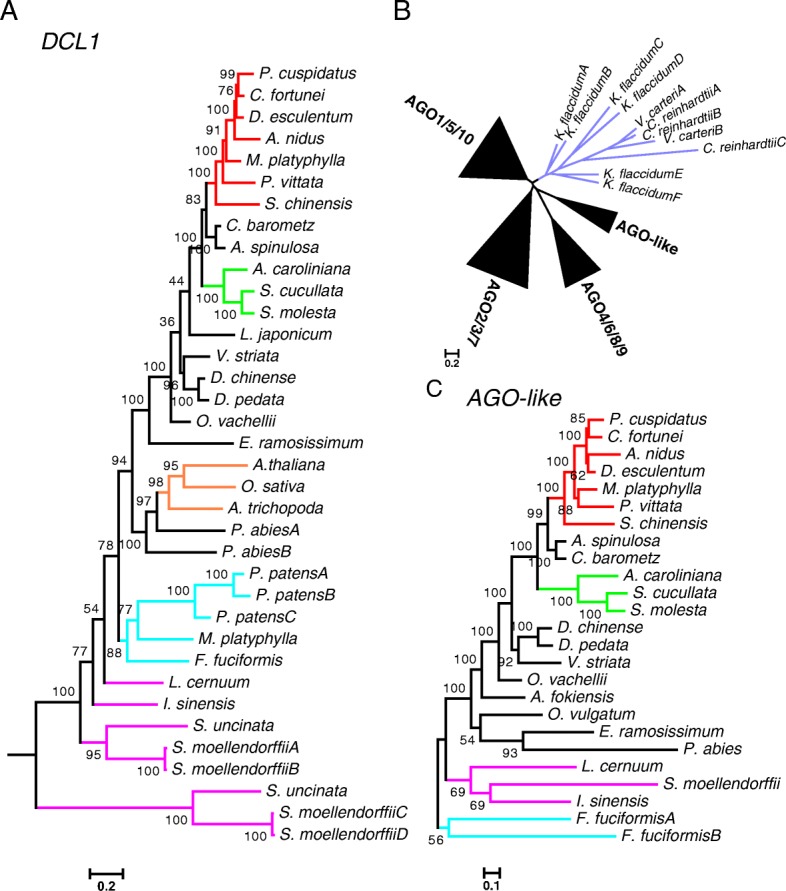
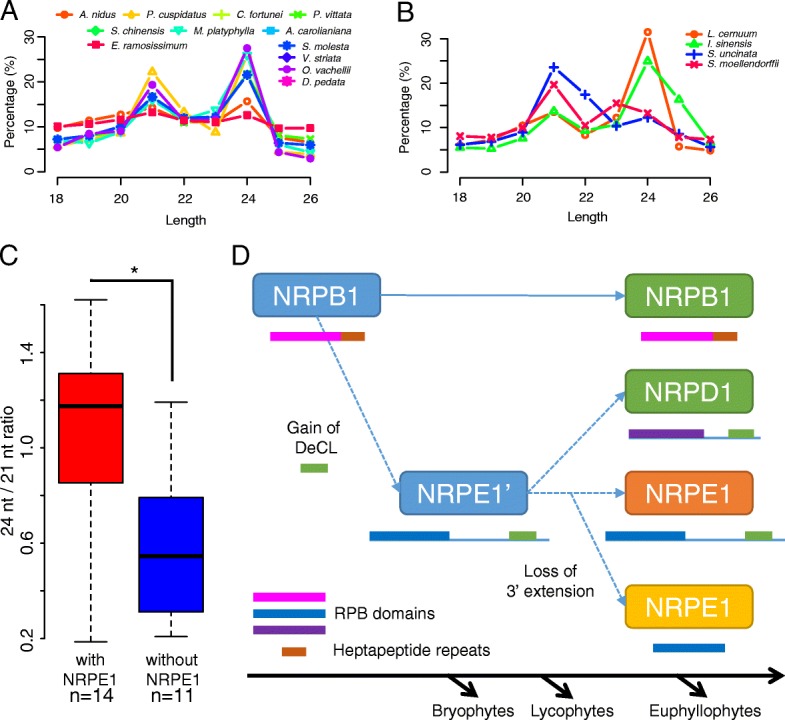
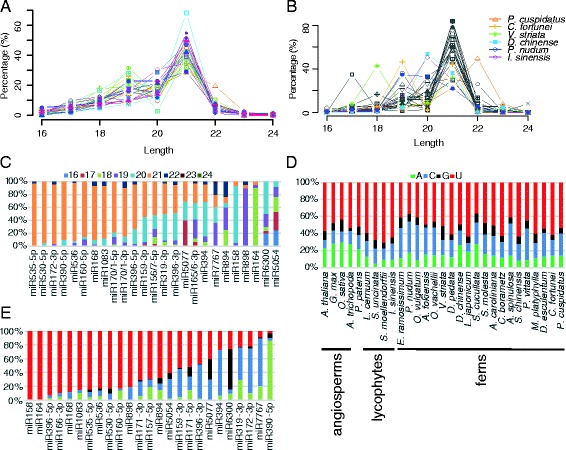
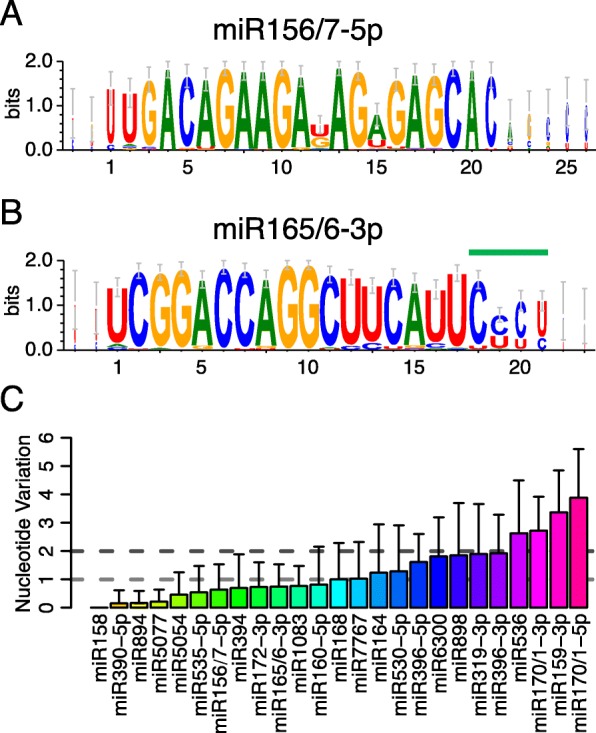
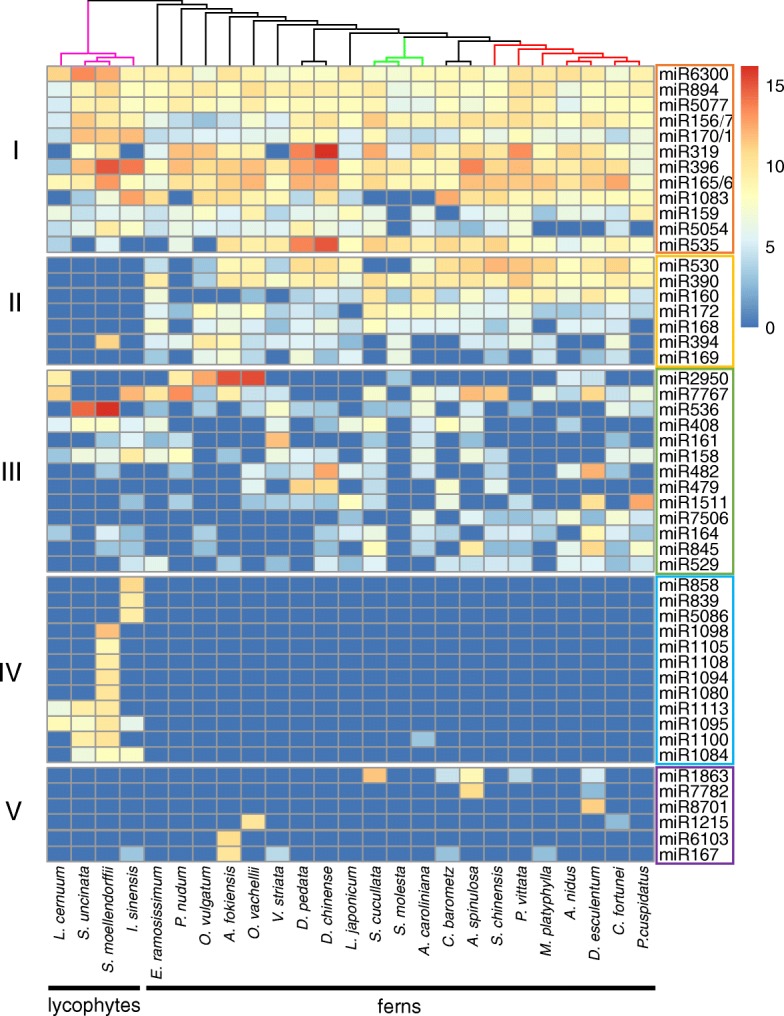
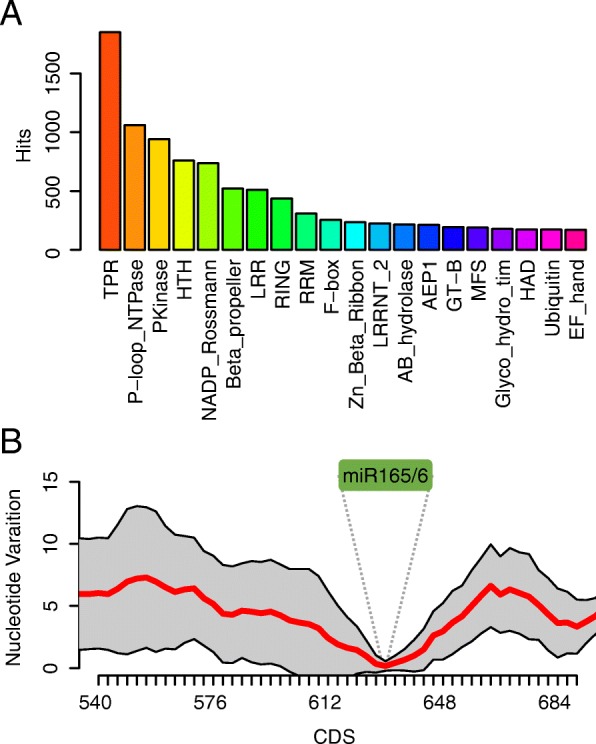
Results: Using 25 representatives from major lineages of lycophytes and ferns, most of which lack sequenced genomes, we characterized small RNAs and small RNA pathways in these plants. We identified homologs of DICER-LIKE (DCL), ARGONAUTE (AGO), and other genes involved in small RNA pathways, predicted over 2600 conserved microRNA (miRNA) candidates, and performed phylogenetic analyses on small RNA pathways as well as miRNAs. Pathways underlying miRNA biogenesis, degradation, and activity were established in the common ancestor of land plants, but the 24-nucleotide siRNA pathway that guides DNA methylation is incomplete in sister species of seed plants, especially lycophytes. We show that the functional diversification of key gene families such as DCL and AGO as observed in angiosperms occurred early in land plants followed by parallel expansion of the AGO family in ferns and angiosperms. We uncovered a conserved AGO subfamily absent in angiosperms.

Conclusions: Our phylogenetic analyses of miRNAs in bryophytes, lycophytes, ferns, and angiosperms refine the time-of-origin for conserved miRNA families as well as small RNA machinery in land plants.

Keywords: Argonaute; DICER-LIKE; Evolution; Fern; Lycophyte; RdDM; Small RNA; miRNA.


Conflict of interest statement

Ethics approval and consent to participate

Not applicable.

Consent for publication

Not applicable.

Competing interests

The authors declare that they have no competing interests.

Publisher’s Note

Springer Nature remains neutral with regard to jurisdictional claims in published maps and institutional affiliations.

Figures

Fig. 1
Fig. 1
Phylogeny of green plants showing the species included in this study. Phylogeny was adopted from the new classification of extant lycophytes and ferns as described in [21]. The taxonomy (family and order) of each species is shown to the right of the full species names. Higher taxonomic ranks are labeled on the tree. The leptosporangiate ferns form the largest class of ferns, the Polypodiopsida. Purple, green algae; light blue, bryophytes; magenta, lycophytes; red, Polypodiales (ferns); green, Salviniales (ferns); orange, angiosperms; black, other ferns and gymnosperms
Fig. 2
Fig. 2
Phylogenetic trees of vital genes involved in small RNA pathways in land plants. a A maximun likelihood (ML) tree for DCL1 genes in representative land plants. The other subclades of DCL genes (such as DCL3 and DCL4) are shown in Additional file 2: Figure S1. Alignment length, 22,788 nt. b A schematic tree of AGO genes. The sequences from green algae (Chlamydomonas reinhardtii, Volvox carteri, and Klebsormidium flaccidum) are clustered. The AGO genes from land plants form four clades, three of which are named after the AGO genes from A. thaliana. c A ML tree for the AGO-like clade in b. Other AGO clades in land plants (such as AGO1/5/10) are shown in Additional file 2: Figure S2. Purple, green algae; light blue, bryophytes; magenta, lycophytes; red, Polypodiales (ferns); green, Salviniales (ferns); orange, angiosperms; black, other ferns and gymnosperms. The scale bar represents nucleotide substitution rates. Numbers beside nodes are bootstrap support values showing confidence (from 0 to 100). Alignment length, 3075 nt
Fig. 3
Fig. 3
A phylogenetic tree of NRPD1/E1 in land plants. A maximun likelihood (ML) tree for NRPD1/E1 is shown in a radial format. Sequences in bryophytes, lycophytes, and ferns were obtained from assembled transcripts in this study, and sequences in angiosperms were from Phytozome. Simplified protein structures are shown beside the sequence accessions and in the upper left corner. RPB domains are represented by the blue rectangles and the DeCL domain is represented by the green rectangles. Light blue, bryophytes; magenta, lycophytes; red, Polypodiales (ferns); green, Salviniales (ferns); orange, angiosperms; black, other ferns. Numbers beside nodes are bootstrap support values showing confidence (from 0 to 100). Key values are enlarged and labeled with different colors: red (over 50) for the clustering of genes from ferns and angiosperms and blue (less than 50) for the clustering of earlier-divergent species and ferns/angiosperms. Alignment length, 1830 nt
Fig. 4
Fig. 4
Size distribution of small RNA reads. a Relative proportions of small RNA reads as percentages for each size category in total reads in species with NRPE1 as shown in Fig. 3. b Relative proportions of small RNA reads as percentages for each size category in total reads in four lycophytes. There are no obvious 24-nt peaks in S. moellendorffii (red) and Selaginella uncinata (blue). For a and b, the total numbers of small RNA reads for each sample are included in Additional file 1: Table S1. c Ratio of counts of 24- and 21-nt small RNAs. Ratios in species with NRPE1 and without NRPE1 are grouped and plotted, and the difference between these two groups is significant (as shown with asterisk). The P value (0.018) was determined with a Wilcoxon test. d Model for NRPD1/E1 origination. In the most recent common ancestor of land plants, an extra NRPB1 copy from a duplication event fused with a DeCL domain at the C-terminus and formed the ancestral NRPE1. In the most recent common ancestor of euphyllophytes, this copy duplicated and one copy lost some C-terminal sequences and formed NRPD1. The other copy retained the whole protein structure as NRPE1 in ancient seed plants, but lost the long C-terminal extension in the most recent common ancestors of ferns. RPB domains are represented by the magenta (NRPB1), blue (NRPE1), or purple (NRPD1) rectangles and the DeCL domain is represented by the green rectangles. Heptapeptide repeats of NRPB1 are shown as brown rectangles. NRPE1 is shown in orange for bryophytes and angiosperms and in yellow for lycophytes and ferns
Fig. 5
Fig. 5
Sequence features of conserved miRNA candidates. a Relative proportions of miRNA candidates for each size category in all 25 species. The miRNA population sizes for each sample are shown in Table 1. b Relative abundance of miRNA candidates for each size category in the species in this study. Only species in which 21-nt miRNA candidates are not the most abundant are labeled. The population sizes for each sample are included in Additional file 1: Table S1. c Length distributions of miRNA candidates shown as percentages in each conserved miRNA family. The miRNAs of angiosperms and P. patens are from miRBase v21 (http://www.mirbase.org/). d, e The 5′ nucleotide composition of miRNA candidates shown as percentages of each of the four nucleotides. d The 5′ nucleotide composition of miRNA candidates in 25 lycophytes and ferns in this study and annotated miRNAs from five other species. All miRNA candidates or annotated miRNAs from each species were included in the analysis. e The 5′ nucleotide composition of conserved miRNA families from lycophytes and ferns in this study. miRNA candidates from all species from which the miRNA candidates were detected are included. Sequences of all predicted miRNA candidates in lycophytes and ferns are included in Additional file 4
Fig. 6
Fig. 6
Conservation of miRNA candidates in conserved miRNA families. a, b Sequence logos showing the consensus sequences of miR156/157-3p and miR165/166-3p families from lycophytes and ferns. The overall height of each position indicates the conservation at this position (in bits), and the height of each nucleotide shows the relative frequency of this nucleotide at this position. In the miR165/166-3p family, nucleotides 19–21 (marked by the green line) are not as conserved as the 5′ end; this is probably because of 3′ truncation and U tailing. c Barplot for nucleotide variations in conserved miRNA families. Only the top one or two most abundant miRNAs in each miRNA family from each species were included in the analyses. The horizontal dotted lines indicate the average nucleotide variations of 1 and 2, respectively, and divide these miRNA families into three groups, families with average nucleotide variations less than 1, between 1 and 2, and more than 2. Different colors in the columns indicate various miRNA families and error bars represent standard deviations of nucleotide variations in each miRNA family
Fig. 7
Fig. 7
Heatmap for conserved miRNA candidates. Each row represents a miRNA family. Colors indicate the scaled expression levels of these miRNA families (log2(RPM)). Rows are divided into five groups: class I miRNA candidates were found at high levels in all species; class II miRNA candidates were found in most ferns but few or no lycophytes; class III miRNA candidates were detected at high levels in multiple species in both lycophytes and ferns; class IV miRNA candidates were detected mainly in lycophytes; and class V miRNA candidates were at high levels in specific species
Fig. 8
Fig. 8
Predicted targets of miRNA candidates in lycophytes and ferns. a Top 20 protein superfamily or domain hits in predicted targets of miRNA candidates. Each color represents one type of protein family or domain. The y-axis shows the numbers of hits in domain searches using all predicted targets of miRNA candidates from lycophytes and ferns. b Nucleotide variations in a group of orthologous genes targeted by miR166 family members. The coding sequences of these genes were aligned using 21-nt sliding windows. The sequences were perfectly aligned at the miR166 binding sites. Nucleotide variations within each window were calculated and plotted. The x-axis positions represent those of the 5′ ends of windows. The red line indicates the average nucleotide variations at each position and the grey area shows the standard errors of averages. The greenmiR166” label and dotted lines mark the location of the binding sites of miR166 family members

Similar articles

Cited by

References

    1. Crick F. Central dogma of molecular biology. Nature. 1970;227:561–3. doi: 10.1038/227561a0. - DOI - PubMed
    1. Fedor MJ, Williamson JR. The catalytic diversity of RNAs. Nat Rev Mol Cell Biol. 2005;6:399–412. doi: 10.1038/nrm1647. - DOI - PubMed
    1. Morris KV, Mattick JS. The rise of regulatory RNA. Nat Rev Genet. 2014;15:423–37. doi: 10.1038/nrg3722. - DOI - PMC - PubMed
    1. Borges F, Martienssen RA. The expanding world of small RNAs in plants. Nat Rev Mol Cell Biol. 2015;16:727–41. doi: 10.1038/nrm4085. - DOI - PMC - PubMed
    1. Rogers K, Chen X. Biogenesis, turnover, and mode of action of plant microRNAs. Plant Cell. 2013;25:2383–99. doi: 10.1105/tpc.113.113159. - DOI - PMC - PubMed

Publication types