. 2017 Aug 23;8(1):326.
doi: 10.1038/s41467-017-00337-6.

Myosin efflux promotes cell elongation to coordinate chromosome segregation with cell cleavage

Affiliations

Myosin efflux promotes cell elongation to coordinate chromosome segregation with cell cleavage

Emilie Montembault et al. Nat Commun. .

Abstract

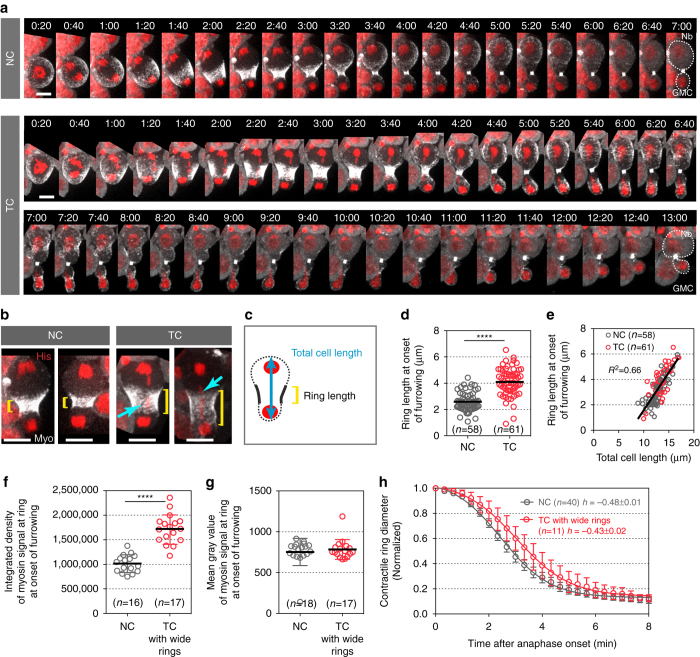
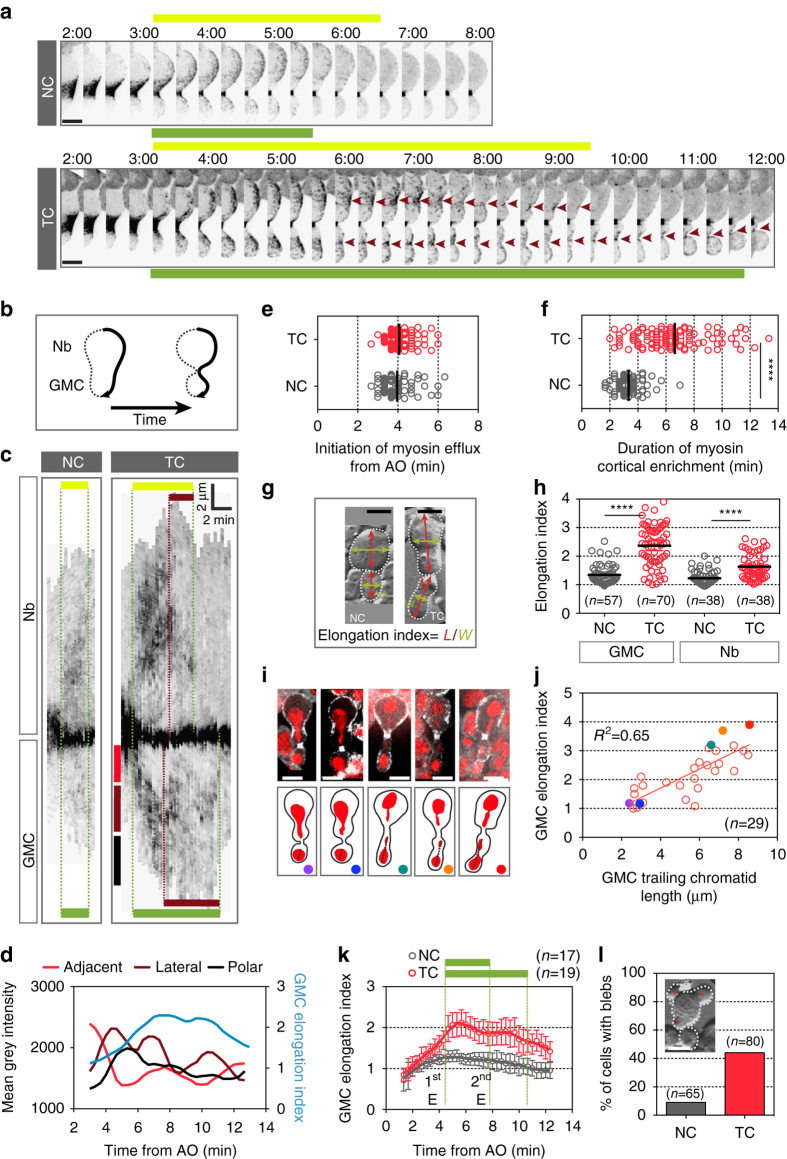
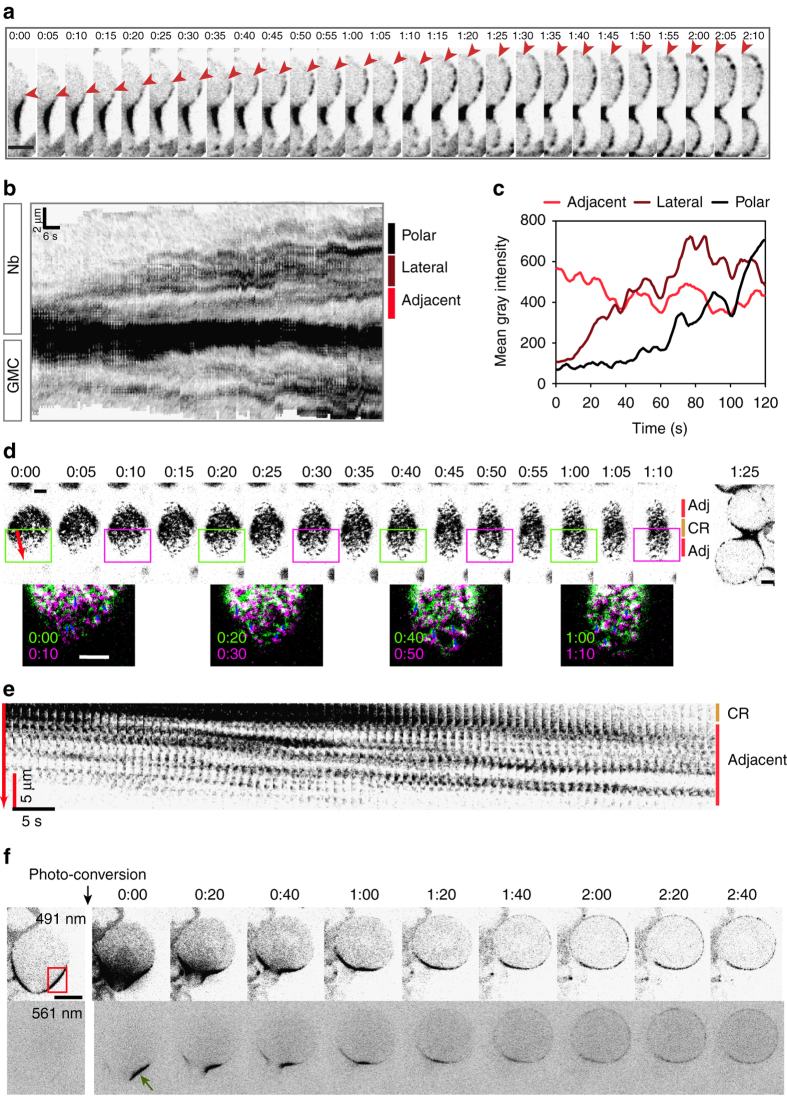
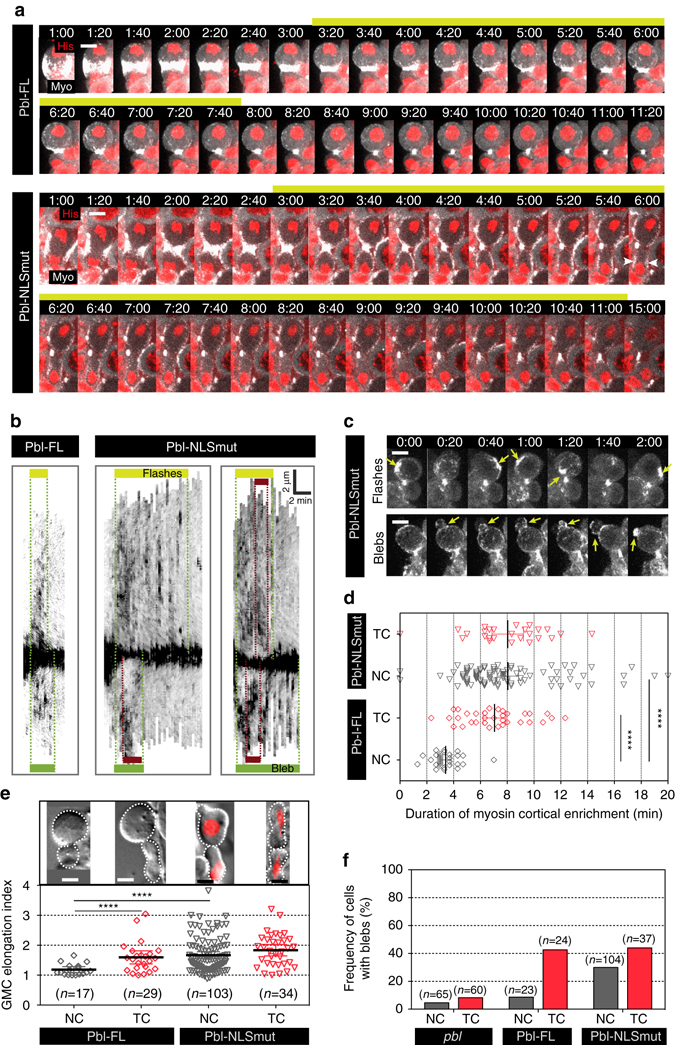
Chromatid segregation must be coordinated with cytokinesis to preserve genomic stability. Here we report that cells clear trailing chromatids from the cleavage site by undergoing two phases of cell elongation. The first phase relies on the assembly of a wide contractile ring. The second phase requires the activity of a pool of myosin that flows from the ring and enriches the nascent daughter cell cortices. This myosin efflux is a novel feature of cytokinesis and its duration is coupled to nuclear envelope reassembly and the nuclear sequestration of the Rho-GEF Pebble. Trailing chromatids induce a delay in nuclear envelope reassembly concomitant with prolonged cortical myosin activity, thus providing forces for the second elongation. We propose that the modulation of cortical myosin dynamics is part of the cellular response triggered by a "chromatid separation checkpoint" that delays nuclear envelope reassembly and, consequently, Pebble nuclear sequestration when trailing chromatids are present at the midzone.Chromatid segregation must be coordinated with cytokinesis to preserve genomic stability. Here the authors show that cells clear trailing chromatids from the cleavage site in a two-step cell elongation and demonstrate the role of myosin efflux in the second phase.


Conflict of interest statement

The authors declare no competing financial interests.

Figures

Figure 1
Figure 1
The presence of trailing chromatids at the midzone triggers the assembly of a wide contractile ring. a Myosin dynamics in cells carrying normal-length chromatid arms (NC) and cells with trailing chromatid arms (TC). Time-lapse images of live Drosophila third instar larvae neuroblasts expressing a chromatin marker, H2Az::mRFP (His, red) and a non-muscle myosin II marker, Sqh::GFP (Myo, gray). Neuroblasts divide asymmetrically to give rise to two daughter cells of different sizes, a large neuroblast (Nb) and a small ganglion mother cell (GMC) (white dashed lines). See Supplementary Movie 1. Time = min:s. Scale bars = 5 µm. b Images of two different cells with NC or TC expressing H2Az::mRFP (His, red) and Sqh::GFP (Myo, gray) at the onset of furrowing. The length of the contractile ring is indicated with yellow brackets. The cyan arrows point to TC. Scale bars = 5 µm. c Scheme of a cell at onset of furrowing to illustrate the measurements of ring length and total cell length. d Scatter dot plot showing the distribution of ring length at the onset of furrowing. e Graph showing the linear correlation (R 2 = 0.66) of the total cell length with the ring length at the onset of furrowing. f, g Scatter dot plots showing the integrated density (f) and mean intensity (g) of myosin signal at the contractile ring of cells with NC and cells with TC specifically exhibiting wide rings at the onset of furrowing. h Graph showing the diameter of the contractile ring over time for cells with NC or TC with wide rings from AO. Data points were fit to a sigmoid curve. The Hillslope (h) is used to compare the rate of furrow invagination. All cells are oriented so that the daughter Nb is apical and the daughter GMC is basal. Time 0:00 corresponds to anaphase onset (AO, initiation of sister chromatids separation). n = number of cells. The mean ± 95% CI is presented for all graphs and scatter dot plots. A Mann-Whitney test was used to calculate P values (**** corresponds to P < 0.0001)
Figure 2
Figure 2
Myosin transiently decorates the cortex of the nascent daughter cells and reorganizes into lateral rings in the presence of trailing chromatids. a Time-lapse images of cells with NC or TC expressing Sqh::GFP during cytokinesis. Half of the cell cortex is shown starting 2 min after anaphase onset. At mid cytokinesis, myosin undergoes outward flow from the contractile ring toward the polar cortex (called efflux) in NC and TC cells. The duration of myosin enrichment at Nb and GMC cortices are illustrated above (yellow line) and below (green line) the images, respectively. The brown arrowheads point to the reorganization of myosin into broad lateral rings, whose constriction forms pseudo cleavage furrows. Time = min:s. b Scheme showing the method for generating kymographs in Fig. 2c. c Kymographs of cortical myosin for cells with NC or TC presented in Fig. 2a. The yellow and green horizontal bars represent the duration of myosin efflux from initiation to disappearance in Nb and GMC, respectively. The brown horizontal bars correspond to the time of contraction of the lateral ectopic myosin rings. The red, brown, and black vertical bars designate the regions where the mean gray intensity of the myosin signal is measured and plotted in Fig. 2d. The x and y axes scale bars correspond to 2 min and 2 µm, respectively. d Graph showing the average myosin level at three distinct cortical regions (adjacent to the contractile ring (red curve), lateral (brown curve), and polar (black curve)) of the GMC over time (left y axis). The GMC elongation index (cyan curve) is indicated in the same graph (right y axis). e Scatter dot plot showing the time of myosin efflux initiation from anaphase onset. (NC, n = 57; TC, n = 84). f Scatter dot plot showing the duration of myosin cortical enrichment from initiation of efflux to disappearance. (NC, n = 69; TC, n = 100). g DIC images of cells with NC and TC to illustrate the calculation of the elongation index plotted in Fig. 2h, j, k, which correspond to the ratio: length (L) (red double arrow) over width (W) (green double arrow) of each daughter cell. h Scatter dot plot showing the distribution of the elongation index of the GMC and Nb daughter cells with NC or TC. i Still images of live cells expressing H2Az::mRFP (red) and Sqh::GFP (gray) with TC and the corresponding scheme below. These cells are examples of cells where the length of the trailing chromatid was measured (black dashed line) at the time the elongation index was calculated and plotted in Fig. 2j. The colored dots correspond to the colored dots plotted in Fig. 2j. j Graph showing the correlation between the length of the TC and the elongation index for the GMC. The colored dots correspond to the cells shown in Fig. 2i. k Graph showing the GMC elongation index plotted over time for NC and TC that illustrates the first (1st E) and second elongation (2nd E). The green horizontal bars above the graph correspond to the average duration of myosin cortical enrichment for NC and TC, respectively. The vertical green dotted lines correspond to the average initiation of efflux and disassembly of myosin from the cortex. l Frequency of cells with NC and TC that bleb. The DIC image illustrates a cell with blebs (red stars). All cells are oriented so that the daughter Nb is apical and the daughter GMC is basal. Scale bars = 5 µm. n = number of cells. The mean ± 95% CI is presented for all graphs and scatter dot plots. A Mann-Whitney test was used to calculate P values (**** corresponds to P < 0.0001)
Figure 3
Figure 3
A pool of myosin undergoes efflux from the contractile ring and enriches the daughter cell cortices during cytokinesis. a Sagittal view of a cell with NC expressing Sqh::GFP. Half of the cell cortex is presented at the time of myosin efflux initiation (Time 0:00). The red arrowheads indicate the edge of the myosin signal propagating in the nascent Nb cortex. Myosin reaches the Nb pole within 2 min. See Supplementary Movie 2. b Kymograph of cortical myosin of the cell presented in a showing Sqh::GFP dynamics from one pole to the other as described in Fig. 2b and method section. The x and y axes scale bars indicate 6 s and 2 µm, respectively. The red, brown, and black vertical bars designate the regions where the mean gray intensity of the myosin signal is measured and plotted in c. c Graph showing the mean gray intensity of myosin in three regions (adjacent to the contractile ring (red), lateral (brown), and polar (black)) of the Nb cortex over time. Time = 0 corresponds to the time of myosin efflux initiation. d Surface view of a sqh::GFP labeled cell with NC showing the contractile ring (CR, orange vertical bar) and the regions adjacent to the ring (adj, red vertical bars) at the time of myosin efflux initiation. The last image is a sagittal view of the same cell at 1 min25s. The red arrow represents the region used for the kymograph in e. The green and magenta rectangles correspond to the insets below. The insets show the overlay of two time points of 10 s interval (early time point in green, late time point in magenta). Blue arrows represent the displacement of some myosin patches within 10 s. e Kymograph of the cell shown in d. Patches of myosin move out of the contractile ring (CR, orange vertical bar) and diffuse along the region adjacent to the ring (red vertical bar) toward the pole. The x and y axes scale bars correspond to 5 s and 5 µm, respectively. f Time lapse of a cell with NC expressing Sqh::Dendra2. Dendra2 undergoes green to red photoconversion upon absorption of 405 nm light. No signal is detected with a 561 nm excitation wavelength before photoconversion. The red rectangle corresponds to the area photoconverted with the 405 nm laser. Upon irradiation at the site of the contractile ring (time 0:00), the pool of photoconverted Sqh::Dendra2 is rapidly visible with the 561 nm laser (green arrow). Two minutes after irradiation, the pool of photoconverted Sqh::Dendra2 is detected around the cortex similar to the Sqh::Dendra2 detected with the 491 nm laser. Time = min:s. Scale bars = 5 µm
Figure 4
Figure 4
The RhoGEF Pebble mediates myosin efflux. a Time-lapse of pebble (pbl) mutant cells expressing H2Az::mRFP (His, red) and Sqh::GFP (Myo, gray) with NC or TC. The blue arrowheads indicate trailing chromatid arms. See Supplementary Movie 3. b Images of wild type (WT) and pbl mutant cells with NC or TC expressing H2Az::mRFP (red) and Sqh::GFP (Myo, gray) from time-lapse movies at the onset of furrowing. The length of the contractile ring is indicated with yellow brackets. The blue arrows point to TC arms. Scale bars = 5 µm. c Scatter dot plot showing the distribution of the ring length at the onset of furrowing in WT (as shown in Fig. 1d) and pbl mutant cells with NC or TC. (pbl NC, n = 17; pbl TC, n = 16). d Time-lapse images of pbl mutant cells with NC or TC expressing Sqh::GFP during cytokinesis. Half of the cell cortex is shown starting 2 min after anaphase onset. e Kymographs of WT or pbl mutant cells with TC showing Sqh::GFP dynamics from one pole to the other. The yellow and green horizontal bars show the duration of myosin cortical efflux from initiation to disappearance in Nb and GMC, respectively. The brown bars correspond to the time of lateral myosin ring contraction. The scale bars on the x and y axes indicate 2 min and 2 µm, respectively. f Scatter dot plot showing the duration of myosin efflux in WT cells with NC or TC (as shown in Fig. 2f) and pbl mutant cells with NC or TC. No myosin efflux is visible in more than 60% of pbl mutant cells regardless of the presence of trailing chromatid arms. (pbl NC, n = 17; pbl TC, n = 14). g Scatter dot plot showing the GMC elongation index of WT with NC or TC (as shown in Fig. 2h) and pbl mutant cells with NC or TC (pbl NC, n = 37; pbl TC, n = 38). h DIC images of WT and pbl mutant cells at 6 min after anaphase onset to illustrate the elongation of the nascent daughter cells associated with myosin efflux. The white dashed lines outline the cells. i Graph showing the GMC elongation index over time in WT (as shown in Fig. 2k) and pbl mutant cells. Time 0:00 corresponds to anaphase onset (AO). Time = min:s. n = number of cells. Scale bars = 5 µm. The mean ± 95% CI is presented for all graphs and scatter dot plots. A Mann-Whitney test was used to calculate P values (**** corresponds to P < 0.0001)
Figure 5
Figure 5
Initiation and completion of nuclear envelope reassembly are delayed in cells with trailing chromatids. a Time-lapse images of cells with NC or TC expressing H2Az::mRFP (His, red) and GFP::Nup107, a marker for nuclear pores (Nup107, gray). Images highlighted by a green rectangle correspond to the time of appearance of GFP::Nup107 around the mass of chromosomes in the daughter Nb, which defines the time of initiation of nuclear envelope reassembly (NER). Images highlighted with a cyan rectangle correspond to the time of completion of NER in the daughter Nb. The white arrowheads point to the trailing chromatid arms. The white dotted lines outline the cells. The white dashed square indicates the zone selected for the insets. The insets correspond to the GFP::Nup107 signal. See Supplementary Movie 4. b Scatter dot plot showing the time of NER initiation as defined in a in GMC and Nb daughter cells with NC (n = 48) or TC (n = 56). c Duration of NER from initiation to completion as defined in a in GMC and Nb daughter cells with NC (n = 38) or TC (n = 41). d Time-lapse images of cells with NC or TC expressing GFP::NLS starting 1 min after anaphase onset. Cyan asterisks indicate the time of appearance of the GFP::NLS signal in the nucleus of the GMC and Nb. e Scatter dot plot showing the time of appearance of GFP::NLS in the nucleus in GMC and Nb daughter cells with NC (n = 59) or TC (n = 37 and 32, respectively) after anaphase onset. The time of GFP::NLS nuclear accumulation is severely delayed in cells with TC compared to cells with NC. f Graph showing the ratio of nuclear/cytoplasmic average intensity of GFP::NLS signal, over time from anaphase onset in cells with NC or TC. Data points were fit to a sigmoid curve. The Hillslope (h) is used to compare the kinetics of GFP::NLS accumulation in the nucleus, which is indicative of the formation of a functional nuclear envelope. Time 0:00 corresponds to anaphase onset (AO). Time = min:s. Scale bars = 5 µm. n = number of cells. The mean ± 95% CI is presented for all scatter dot plots and graphs. A Mann-Whitney test was used to calculate P values (**** corresponds to P < 0.0001)
Figure 6
Figure 6
The retention of Pbl in the cytoplasm during mitotic exit prolongs myosin activity at the polar cortex. a Time-lapse images of pbl mutant cells expressing Pbl full length (Pbl-FL) or a Pbl NLS mutant (Pbl-NLSmut) expressed from the endogenous promoter. The cells carry normal chromosomes and express Sqh::GFP (Myo, gray) and H2Az::mRFP (His, red). The yellow bars correspond to the time of myosin efflux in the Nb daughter cell. White arrowheads point to the position of ectopic myosin rings at the lateral regions of daughter cells. Time 0:00 corresponds to anaphase onset. See Supplementary Movie 5. b Kymographs of cortical myosin labeled with Sqh::GFP from one pole to the other over time for pbl mutant cells expressing Pbl-FL (one example) or Pbl-NLSmut (two examples) with NC. The first example illustrates a cell undergoing myosin flashes at the polar cortex (as shown in c). The second example shows a cell blebbing. The yellow and green bars show the duration of myosin cortical enrichment in Nb and GMC, respectively. The x and y axes of scale bars correspond to 2 min and 2 µm, respectively. c Time-lapse images of Pbl-NLSmut cells with NC expressing Sqh::GFP well after anaphase onset. The top row represents a cell where myosin flashes at the polar cortex and the bottom row shows a cell blebbing. Yellow arrows indicate myosin flashes (top panels) and blebs (bottom panels). d Scatter dot plot showing the duration of myosin cortical enrichment in pbl mutant cells expressing Pbl-FL (NC, n = 29; TC, n = 33) or Pbl-NLSmut (NC, n = 87; TC, n = 26). e Scatter dot plot showing the elongation index in pbl mutant cells expressing Pbl-FL or Pbl-NLSmut with NC or TC. The DIC images of cells expressing or not H2Az::mRFP (red) above the graph provides a representative example of each genotype at the time of elongation index measurement. A significant proportion of cells expressing Pbl-NLSmut elongates in the absence of trailing chromatids. f Frequency of blebs in pbl mutant cells expressing Pbl-FL or Pbl-NLSmut with NC or TC. Time = min:s. n = number of cells. Scale bars = 5 µm. The mean ± 95% CI is presented for all scatter dot plots and graphs. A Mann-Whitney test was used to calculate P values (**** corresponds to P < 0.0001)
Figure 7
Figure 7
Model for cell elongation in the presence of trailing chromatids. The top and bottom panels illustrate key mitotic exit events in cells with normal (NC) and trailing chromatids (TC), respectively, from anaphase onset (AO). The red, black, cyan, and blue rectangles represent the average duration of chromatids poleward movement, cleavage furrow ingression, nuclear envelope reassembly (NER), and myosin cortical enrichment, respectively. The rectangles are timely positioned with respect to AO. The variability in the duration of NER and myosin efflux is symbolized by color fading at the extremities. The green shape symbolizes putative pebble cytoplasmic activity throughout mitotic exit. The schemes illustrate the state of the four events listed above at key moments during mitotic exit. Three minutes after AO, Pbl (green dots) concentrates at the midzone where a tight contractile ring (black circles) assembles when chromatids (red) have segregated to the poles. The presence of trailing chromatids at the midzone favors the assembly of a wide ring, whose contraction generates the first cell elongation. Next, myosin initiates Pbl-mediated efflux and invades the polar cortex (blue dashed thin curves) while nuclear envelope starts reassembling on the chromosome mass at the poles (cyan dashed lines). In control cells, myosin disassembles from the polar cortex upon completion of NER (cyan lines), 7 min, on average, after AO. The presence of TC near the midzone induces a severe delay in NER completion. Consequently, the delay in Pbl nuclear import prolongs active cortical myosin, which reorganizes into ectopic lateral rings (blue dashed thick curves). The partial contraction of the rings promotes the second phase of elongation, allowing the clearance of the trailing chromatids from the cleavage plane. Myosin dissociates from the cortex upon completion of NER 12 min, on average, after AO

References

    1. Rappaport, R. Cytokinesis in Animal Cells (Cambridge University Press, 1996).
    1. Green RA, Paluch E, Oegema K. Cytokinesis in animal cells. Annu. Rev. Cell. Dev. Biol. 2012;28:29–58. doi: 10.1146/annurev-cellbio-101011-155718. - DOI - PubMed
    1. D’Avino PP. How to scaffold the contractile ring for a safe cytokinesis - lessons from Anillin-related proteins. J. Cell. Sci. 2009;122:1071–1079. doi: 10.1242/jcs.034785. - DOI - PubMed
    1. Piekny AJ, Glotzer M. Anillin is a scaffold protein that links RhoA, actin, and myosin during cytokinesis. Curr. Biol. 2008;18:30–36. doi: 10.1016/j.cub.2007.11.068. - DOI - PubMed
    1. Sun L, et al. Mechanistic insights into the anchorage of the contractile ring by anillin and Mid1. Dev. Cell. 2015;33:413–426. doi: 10.1016/j.devcel.2015.03.003. - DOI - PMC - PubMed

Publication types

MeSH terms