. 2017 Aug 23;7(1):9172.
doi: 10.1038/s41598-017-08028-4.

Maximum entropy models capture melodic styles

Affiliations

Maximum entropy models capture melodic styles

Jason Sakellariou et al. Sci Rep. .

Abstract

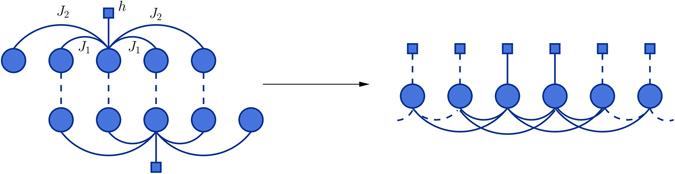
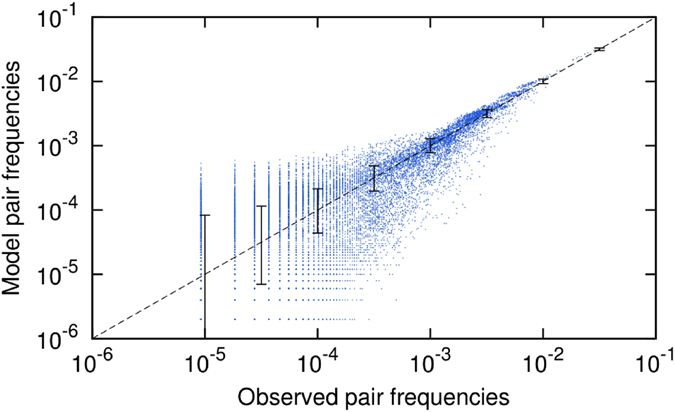
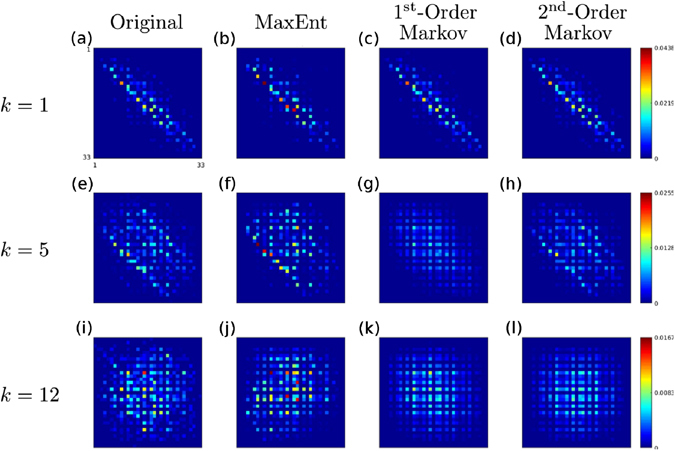
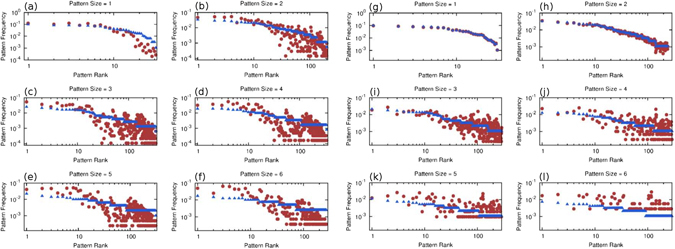
We introduce a Maximum Entropy model able to capture the statistics of melodies in music. The model can be used to generate new melodies that emulate the style of a given musical corpus. Instead of using the n-body interactions of (n-1)-order Markov models, traditionally used in automatic music generation, we use a k-nearest neighbour model with pairwise interactions only. In that way, we keep the number of parameters low and avoid over-fitting problems typical of Markov models. We show that long-range musical phrases don't need to be explicitly enforced using high-order Markov interactions, but can instead emerge from multiple, competing, pairwise interactions. We validate our Maximum Entropy model by contrasting how much the generated sequences capture the style of the original corpus without plagiarizing it. To this end we use a data-compression approach to discriminate the levels of borrowing and innovation featured by the artificial sequences. Our modelling scheme outperforms both fixed-order and variable-order Markov models. This shows that, despite being based only on pairwise interactions, our scheme opens the possibility to generate musically sensible alterations of the original phrases, providing a way to generate innovation.


Conflict of interest statement

The authors declare that they have no competing interests.

Figures

Figure 1
Figure 1
The Graph Representation. Section of a graph representing the factorization of the distribution (1) for K max = 2. The topology of the graph reflects the way variables interact in the Hamiltonian. Interaction potentials (edges in the graph) and local fields (square nodes) are connected to variables (circle nodes) according to (1). A model is built by taking the union of smaller modules shifted by one variable, avoiding duplicate edges. Each module models the way each note depends on its local context (refer to the method section).
Figure 2
Figure 2
Model VS Corpus pair frequencies. The Corpus ones are from the corpus Weimar Jazz Database (that contains detailed transcriptions of famous jazz improvisations. As of march 2015 the database contains 257 songs) (see Section S3 in the SI for additional information). The model frequencies come from a N = 200000 sequence generated by a K max = 10 model trained on the above corpus. Since the corpus is finite we added 99% confidence intervals for the estimated corpus frequencies. Their values were computed using the Wilson Score interval which is well adapted for values very close to 0.
Figure 3
Figure 3
Matrices of pair frequencies. Color-maps representing matrices obtained by counting pair frequencies (see eq. (3)). (ad) Pair frequences at distance k = 1 for the followig models: the original sequence by J.S. Bach (see Section S3 of the SI), our Maximum Entropy model with K max = 10, a first-order and a second-order Markov model. (e–h) the same for k = 5. (i–l) the same for k = 12.
Figure 4
Figure 4
Frequency-rank plots for pattern frequencies. In blue, all patterns appearing in the corpus of sizes 1 to 6 are ranked according to their frequency. Here the corpus is the Bach Partita used previously (see Section S3 of the SI). Then, the same patterns are located in a N = 15000 sequence generated from the Maximum Entropy model (a–f) and a first-order Markov model (gl). In red we plot their frequencies in the generated sequence but using the same order as before in order to compare with the corresponding frequencies in the corpus. For the Markov model, note that there is a good agreement for small patterns and worse for large ones. Note also that for the larger patterns (especially for size = 6) much fewer corpus patterns were found in the generated sequence, i.e. there are fewer red points than in the corresponding Maximum Entropy panel.
Figure 5
Figure 5
Borrowing vs. similarity. This figure reports the Average Common Substring (ACS) vs. the values of the cross-entropies for all the artificial sequences generated with the Maximum Entropy (ME) model (a), the variable-order (VO) Markov model (b) and the fixed-order (FO) Markov model (c). Everything is computed with respect to the sequence of J.S. Bach’s first violin Partita (see Section S3 of the SI). Filled circles correspond to the artificial sequences. Colors code for the values of K max in each different model. In addition in each panel the empty circles reports the same quantities for other original sequences of Bach (represented with blue circles) and other classical authors - Beethoven, Schumann, Chopin, Liszt and Albeniz - (AllClass represented with grey circles). Note that the main panel for FO is truncated at values of ACS equal to 8, while the complete plot is shown in the inset.
Figure 6
Figure 6
Training data. The corpus, a sequence of type indices, is segmented by overlapping substrings of size 2K max + 1 (here K max = 2). These samples provide the information needed to train the basic module of our model, which describes the way a variable depends on its local context, i.e., on K max variables to its left and to its right.

References

    1. Schneidman E, Berry MJ, Segev R, Bialek W. Weak pairwise correlations imply strongly correlated network states in a neural population. Nature. 2006;440:1007–1012. doi: 10.1038/nature04701. - DOI - PMC - PubMed
    1. Lezon TR, Banavar JR, Cieplak M, Maritan A, Fedoroff NV. Using the principle of entropy maximization to infer genetic interaction networks from gene expression patterns. Proceedings of the National Academy of Sciences. 2006;103:19033–19038. doi: 10.1073/pnas.0609152103. - DOI - PMC - PubMed
    1. Bialek, W. & Ranganathan, R. Rediscovering the power of pairwise interactions. arXiv preprint arXiv:0712.4397 (2007).
    1. Weigt M, White RA, Szurmant H, Hoch JA, Hwa T. Identification of direct residue contacts in protein?protein interaction by message passing. Proceedings of the National Academy of Sciences. 2009;106:67–72. doi: 10.1073/pnas.0805923106. - DOI - PMC - PubMed
    1. Mora T, Walczak AM, Bialek W, Callan CG. Maximum entropy models for antibody diversity. Proceedings of the National Academy of Sciences. 2010;107:5405–5410. doi: 10.1073/pnas.1001705107. - DOI - PMC - PubMed

Publication types

LinkOut - more resources