. 2017 Aug 23;7(1):9237.
doi: 10.1038/s41598-017-09300-3.

Amoeboid-mesenchymal migration plasticity promotes invasion only in complex heterogeneous microenvironments

Affiliations

Amoeboid-mesenchymal migration plasticity promotes invasion only in complex heterogeneous microenvironments

Katrin Talkenberger et al. Sci Rep. .

Abstract

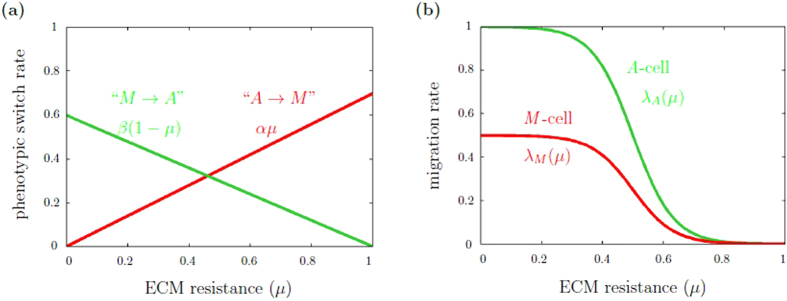
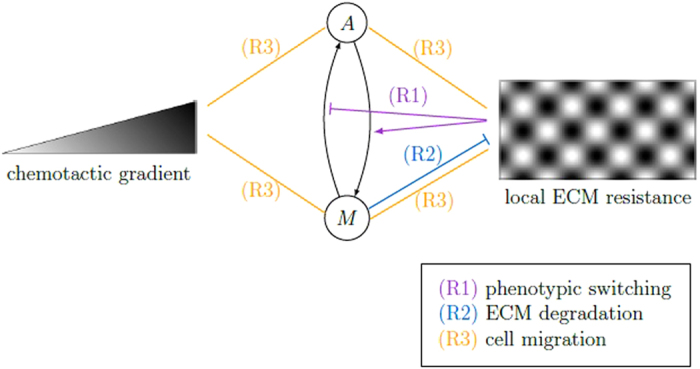
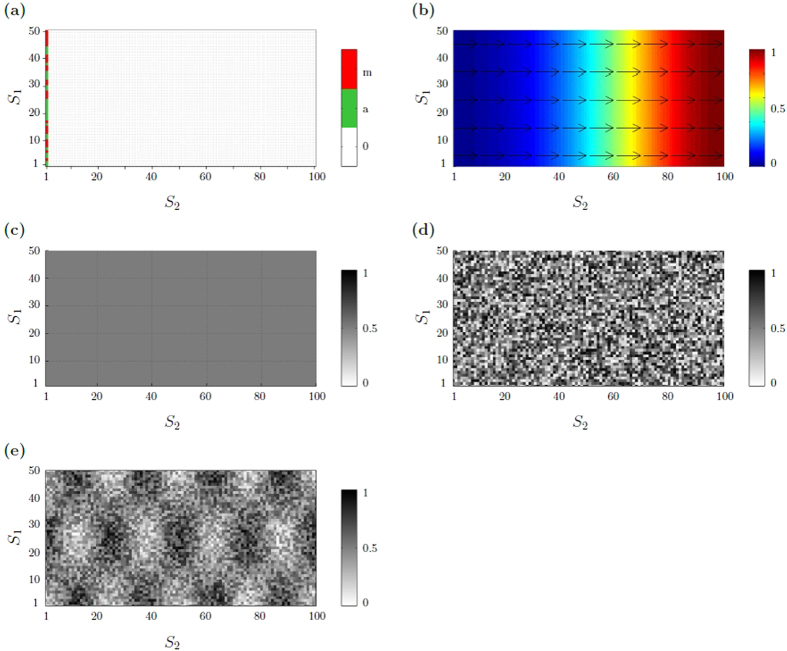
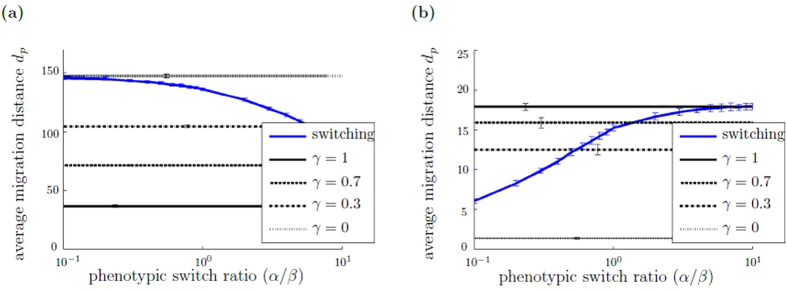
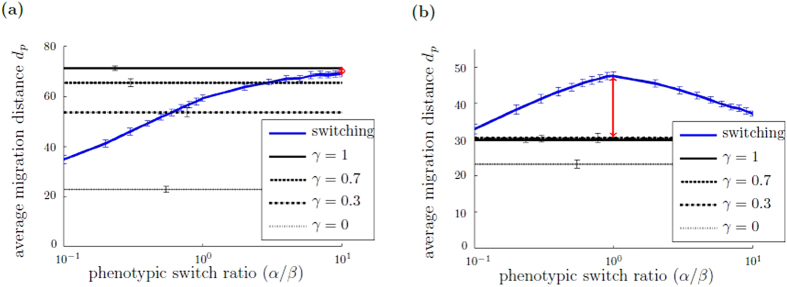
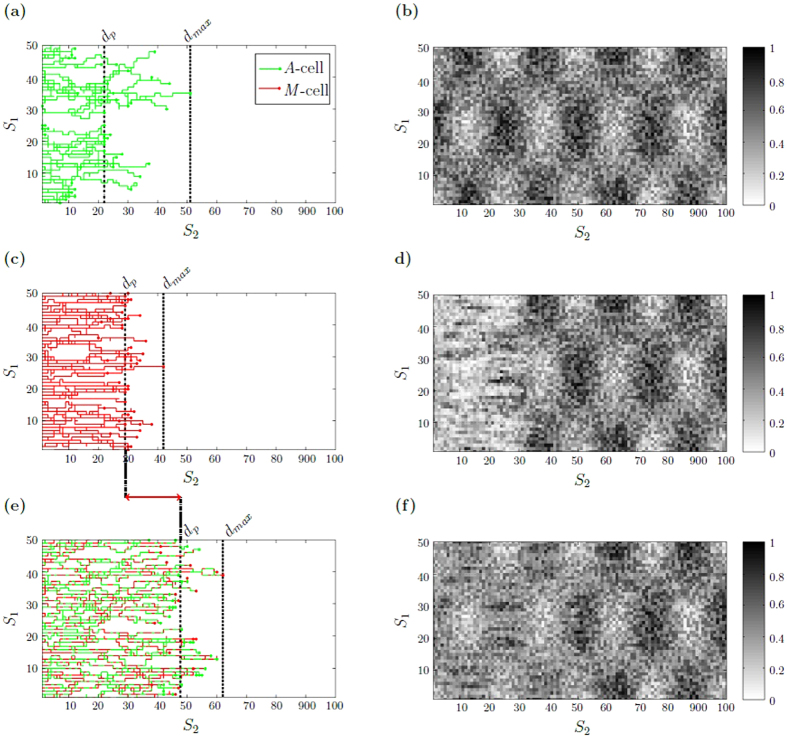
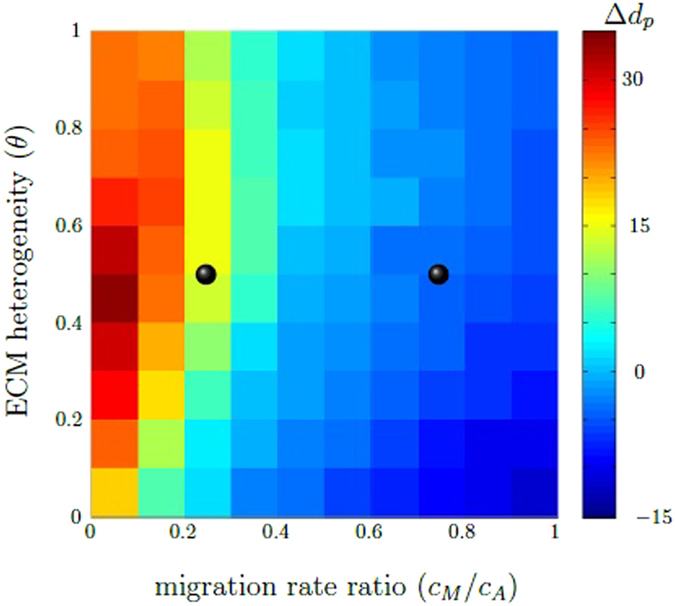
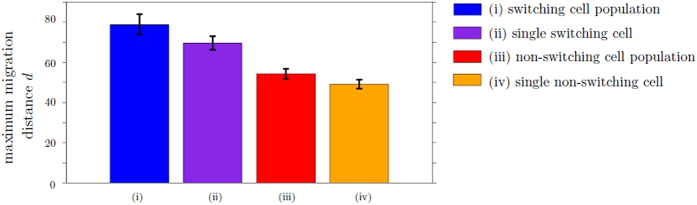
During tissue invasion individual tumor cells exhibit two interconvertible migration modes, namely mesenchymal and amoeboid migration. The cellular microenvironment triggers the switch between both modes, thereby allowing adaptation to dynamic conditions. It is, however, unclear if this amoeboid-mesenchymal migration plasticity contributes to a more effective tumor invasion. We address this question with a mathematical model, where the amoeboid-mesenchymal migration plasticity is regulated in response to local extracellular matrix resistance. Our numerical analysis reveals that extracellular matrix structure and presence of a chemotactic gradient are key determinants of the model behavior. Only in complex microenvironments, if the extracellular matrix is highly heterogeneous and a chemotactic gradient directs migration, the amoeboid-mesenchymal migration plasticity allows a more widespread invasion compared to the non-switching amoeboid and mesenchymal modes. Importantly, these specific conditions are characteristic for in vivo tumor invasion. Thus, our study suggests that in vitro systems aiming at unraveling the underlying molecular mechanisms of tumor invasion should take into account the complexity of the microenvironment by considering the combined effects of structural heterogeneities and chemical gradients on cell migration.


Conflict of interest statement

The authors declare that they have no competing interests.

Figures

Figure 1
Figure 1
Phenotypic switch rates and migration rates as functions of ECM resistance. (a) Phenotypic switch rate. A-cells change their phenotype with rate αμ and M-cells with rate β(1μ). In the plot, the switch parameters are α = 0.7 and β = 0.6. (b) Migration rate. For A-cells, the migration rate is given by equation (3a), for M-cells by equation (3b). Parameters are the migration rate constants c A and c M, which are chosen cA = 1 and cM = 0.5 in the plot.
Figure 2
Figure 2
Schematic illustration of model rules. The time evolution of our CA model arises from the repeated application of three rules: (R1) phenotypic switching between A- and M-cells depending on ECM resistance, (R2) ECM degradation by M-cells and (R3) cell migration depending on the ECM resistance, preferentially in direction of the chemotactic gradient. The black arrows indicate the switch ability between A- and M-cells. Relations between chemotactic gradient, A/M-cells and local ECM resistance are indicated by arrows (positive influence), stopped lines (negative influence) and straight lines (positive or negative influence).
Figure 3
Figure 3
Initial model conditions. (a) Initial cell distribution. A- and M-cells are placed at random along the left border of a rectangular lattice. Periodic boundary conditions are applied along the S 1 axis. At S 2 = 1 reflecting boundary conditions are imposed. (b) Chemotactic gradient field defined by equation (1). The color code indicates the chemotactic gradient concentration function, where blue corresponds to low, red is related to high concentrations. The arrows illustrate the local gradient direction. (c–e) Initial ECM resistance distribution of differently structured ECM: (c) homogeneous, moderate ECM resistance distribution, modeled by a constant value μ(r 1,r 2) = 0.5; (d) heterogeneous, weakly structured ECM resistance distribution, defined by equation (2) with heterogeneity parameter θ = 0.1; (e) heterogeneous, highly structured ECM resistance distribution, defined by equation (2) with heterogeneity parameter θ = 0.5. The gray scale in (c–e) indicates the level of matrix resistance on cell migration: low (white) to high (black).
Figure 4
Figure 4
Advantage of non-switching behavior under homogeneous ECM conditions. The figure shows the average migration distance dp of switching and non-switching populations depending on the switch ratio α/β for different homogeneous ECM conditions: (a) homogeneous, low ECM resistance modeled by μ(r 1,r 2) = 0.1 and (b) homogeneous, high ECM resistance with μ(r 1,r 2) = 0.9. The blue line represents the switching populations, the black lines display non-switching populations with different M-cell fraction γ{0,0.3,0.7,1}. Each simulation is run with 50 cells. Simulations are evaluated after 200 Monte Carlo steps, averaged over 50 independent simulations. The errorbars show the standard deviation of the average migration distance d p between the simulations. The standard deviation within the simulations is shown in Supplementary Fig. S5. Simulation parameters are c M/c A = 0.25, κ = 1, δ = 0.1.
Figure 5
Figure 5
Migration plasticity can be advantageous under heterogeneous, highly structured ECM conditions. The figure shows the average migration distance d p of switching and non-switching populations depending on the switch ratio α/β under heterogeneous ECM condition (modeled by equation (2) with θ = 0.5, see Fig. 3(e)) and with different migration rate ratios: (a) c M/c A = 0.75 and (b) c M/c A = 0.25. The blue line represents the switching populations, the black lines display non-switching populations with different M-cell fraction γ{0,0.3,0.7,1}. Each simulation is run with 50 cells. Simulations are evaluated after 200 Monte Carlo steps, averaged over 50 independent simulations. The errorbars show the standard deviation of the average migration distance d p between the simulations. The standard deviation within the simulations is shown in Supplementary Fig. S6. Simulation parameters are κ = 1, δ=0.1. The red arrow indicates the difference Δd p between the switching population with maximum average migration distance d p with respect to varied α/β ratio and the non-switching population with maximum d p with respect to varied γ fraction, which is the observable analyzed in Fig. 7.
Figure 6
Figure 6
Individual cell trajectories under heterogeneous ECM conditions with small migration rate ratio. Individual cell trajectories (a,c,e) are visualized together with the ECM resistance distribution (b,d,f) after 200 Monte Carlo steps. A-cells and their trajectory are color indicated by green, M-cells by red. (a) non-switching cell population with γ = 0 (pure A-cell population) for which (b) the ECM after the cell migration has not being changed. (c) non-switching cell population with γ = 1 (pure M-cell population) with (d) corresponding ECM after cell migration. (e) switching cell population with α/β=1 and (f) corresponding ECM. The vertical dashed lines in (a), (c) and (e) mark the average distance d p, the dotted line specifies the maximum migration distance dmax. The red arrow indicates the difference Δdp between the maximum average migration distance d p of the switching population and the non-switching population with γ = 0. The initial ECM resistance distribution is modeled by equation (2) with θ = 0.5, see Fig. 3(e). Simulation parameters are c M/c A = 0.25, κ = 0.01, δ = 0.1. Supplementary movies of the cell population trajectories can be found the supplementary material.
Figure 7
Figure 7
The difference Δd p between the maximum average migration distance d p of switching and non-switching populations depends on the ECM heterogeneity (θ) and the migration rate ratio (cM/cA). The phase diagram shows the difference Δd p between the switching population with maximum average migration distance d p with respect to varied switch ratio α/β and the non-switching population with maximum average migration distance d p. Red to turquois areas indicate parameter combinations (θ,cM/cA) for which the maximum average migration distance d p of the switching population is highest, whereas blue refers to an advantage of the non-switching behavior. The black dots illustrate points in the parameter space, which corresponds to the parameter situation of Fig. 5(a) and (b). Simulation parameters are κ = 1, δ=0.1.
Figure 8
Figure 8
An individual cell within a switching population can migrate further compared to a situation where only a single switching cell is moving. CA simulations of (i) a switching population of 500 cells, (ii) a scenario with only a single switching cell repeated 500 times, (iii) a non-switching population of 500 cells and (iv) a scenario with only a single non-switching cell repeated 500 times. The figure shows the maximum migration distance d, which refers to the maximum distance the individual cells within a population migrate from the initial position (i, iii), or to the maximum distance the single cell migrates among the 500 repetitions (ii, iv), respectively. Each simulation, (i)-(iv), is performed for 200 Monte Carlo steps and repeated 100 times to account for stochastic fluctuations. The ECM condition and model parameters are chosen as in Fig. 5, with phenotypic switch ratio α/β = 1.

References

    1. Roussos ET, Condeelis JS, Patsialou A. Chemotaxis in cancer. Nat Rev Cancer. 2011;11:573–87. doi: 10.1038/nrc3078. - DOI - PMC - PubMed
    1. Lu P, Weaver VM, Werb Z. The extracellular matrix: a dynamic niche in cancer progression. J Cell Biol. 2012;196:395–406. doi: 10.1083/jcb.201102147. - DOI - PMC - PubMed
    1. Taddei ML, Giannoni E, Comito G, Chiarugi P. Microenvironment and tumor cell plasticity: an easy way out. Cancer Lett. 2013;341:80–96. doi: 10.1016/j.canlet.2013.01.042. - DOI - PubMed
    1. Brábek J, Mierke C, Rösel D, Veselý P, Fabry B. The role of the tissue microenvironment in the regulation of cancer cell motility and invasion. Cell Commun Signal. 2010;8:22. doi: 10.1186/1478-811X-8-22. - DOI - PMC - PubMed
    1. Panková K, Rösel D, Novotný M, Brábek J. The molecular mechanisms of transition between mesenchymal and amoeboid invasiveness in tumor cells. Cell Mol Life Sci. 2010;67:63–71. doi: 10.1007/s00018-009-0132-1. - DOI - PMC - PubMed

Publication types

LinkOut - more resources