. 2017 Aug 23;7(1):9174.
doi: 10.1038/s41598-017-09525-2.

Hypoxia imaging in cells and tumor tissues using a highly selective fluorescent nitroreductase probe

Affiliations

Hypoxia imaging in cells and tumor tissues using a highly selective fluorescent nitroreductase probe

Dan Yang et al. Sci Rep. .

Abstract

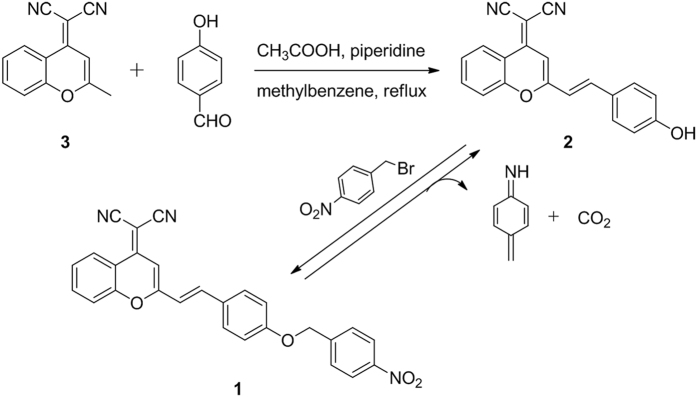
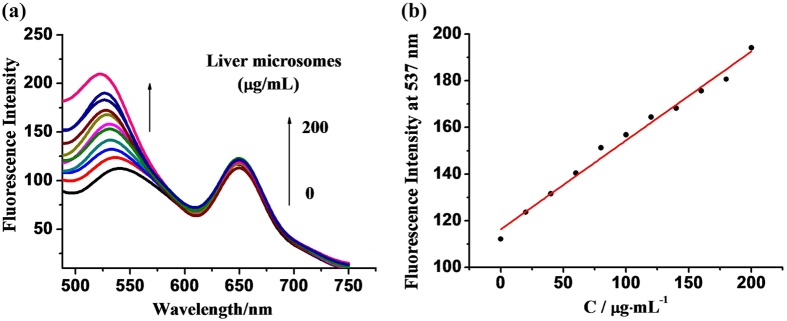
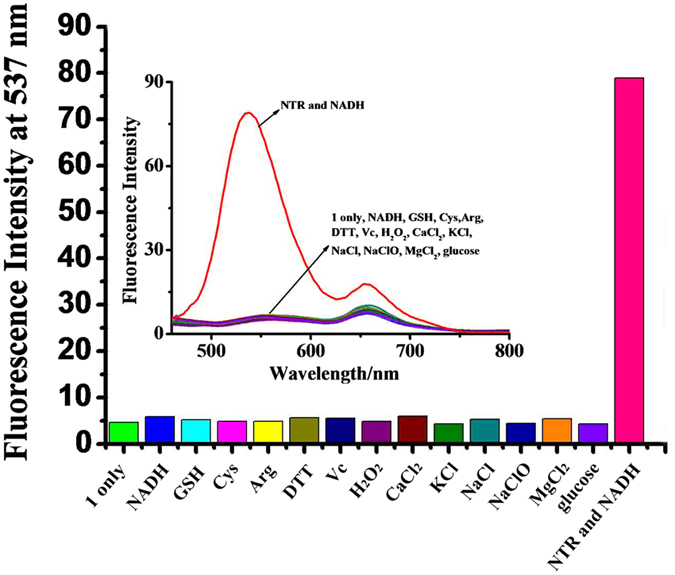
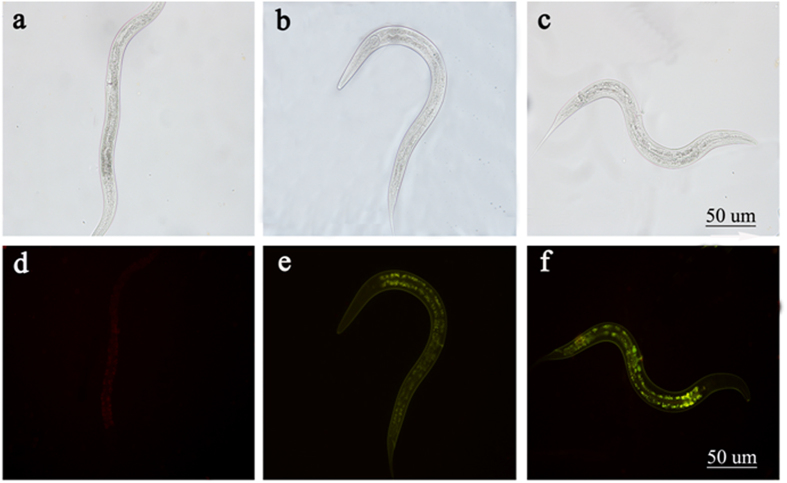
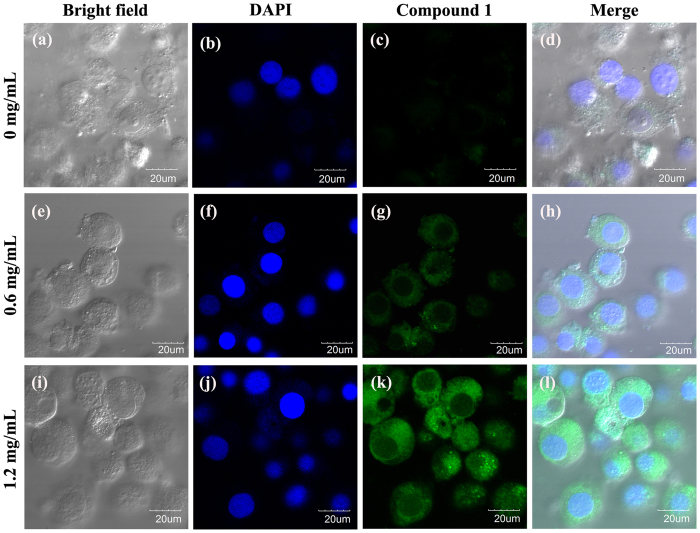
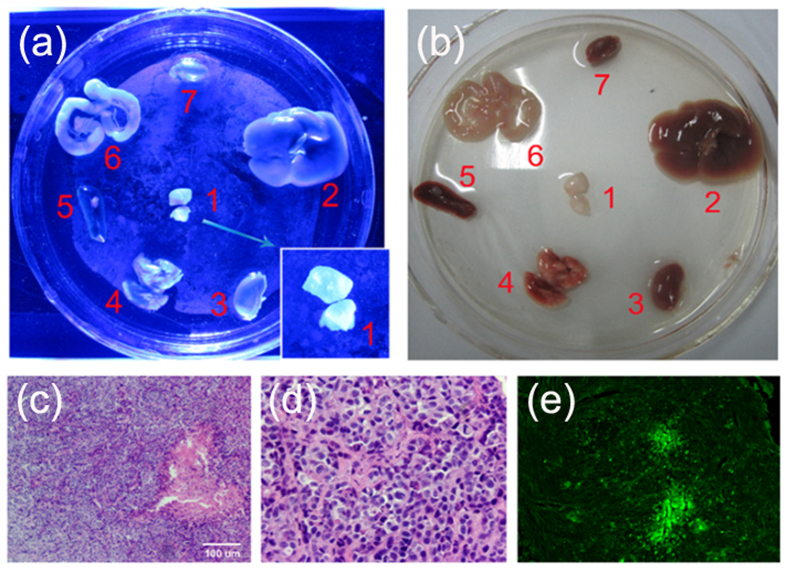
Hypoxia is a characteristic of locally advanced solid tumors, resulting from an imbalance between oxygen consumption and supply. In hypoxic solid tumors, an increased expression of nitroreductase (NTR) is detected, therefore, the development of NTR-targeted fluorescent probes to selectively and efficiently detect hypoxia in vivo is of utmost importance. In this study, a probe (1) has been designed and tested for effective optical detection of NTR in vitro and in vivo. The reduction of probe (1), catalyzed by NTR, resulted in changes of the electron-withdrawn nitrogen group into an electron-donation amino group. In addition, breakage of the O-C bond ensured selective fluorescence enhancement. The in vitro response towards exogenous NTR, from rat liver microsomes, resulted in the optical enhancement during the detection process. In vivo imaging of caerorhabditis elegans (C.elegan) further confirmed the detection of NTR by probe (1). Moreover, probe (1) was successfully used for the detection of hypoxia in both HI5 cells, and a murine tumor model, which demonstrates the potential of probe (1) for application in fluorescence bioimaging studies, and tumor hypoxia diagnosis.


Conflict of interest statement

The authors declare that they have no competing interests.

Figures

Figure 1
Figure 1
Synthetic route of probe (1), and the reactivity of probe (1) with nitroreductase.
Figure 2
Figure 2
(a) Fluorescence responses of probe (1) (1.0 × 10−5 M) to different concentrations of nitroreductase (NTR) in PBS buffer with 1% DMSO and 10 μM NADH. (b) A plot showing the fluorescence intensityof probe (1) (1.0 × 10−5 M) at 537 nm vs. the reaction time in the presence of different concentration of NTR: 0 (control), 2.5, 5, and 7.5 µg/mL. Measurements were performed in 10 mM PBS buffer at 37 °C (pH = 7.4).
Figure 3
Figure 3
(a) Fluorescence emission titration spectra of probe (1) (3.0 × 10−5 M) in the presence of varying concentrations of rat liver microsome (0~200 ug/mL) in PBS (0.01 M, pH = 7.4)with 1% DMSO and 80 µM NADH. (b) Correlation between emission intensities at 537 nm and concentrations of liver microsome.
Figure 4
Figure 4
Fluorescence activities of probe (1) (1.0 × 10−5 M) to various species: probe (1) only, NADH (10 µM), GSH (1 mM), Cys (1 mM), Arg (1 mM), DTT (1 mM), Vc (1 mM), H2O2 (1 mM), CaCl2 (1 mM), KCl (1 mM), NaCl (1 mM), NaClO (1 mM), MgCl2 (1 mM), glucose (1 mM), nitroreductase, and NADH. All measurements were performed in PBS (0.01 M, pH 7.4) with 1% DMSO.
Figure 5
Figure 5
Bright-field image (top) and fluorescent image (bottom) in C. elegans. (a) Probe (1)(20 µM) only. (b) Probe (1) (20 µM), NADH (100 µM), and nitroreductase (NTR) (10 µg/ml). (c) Probe1(20 µM), NADH (100 µM), and NTR (20 µg/ml).
Figure 6
Figure 6
Confocal luminescence images of live Hi5 cells, incubated in PBS for 2 h, at different oxygen levels. (ad) Probe (1) only (20 μM); (eh) Probe (1) (20 μM), and antioxidant (0.6 mg/mL); (il) Probe (1) (20 μM), and antioxidant (1.2 mg/mL). (a,e) and (i) Are bright-field images. (b,f) and (j) Are blue channels collected at 425–475 nm, stained with DAPI. (c,g) and (k) are green channels collected at 495–550 nm, stained with probe 1. (d,h and l) Are mergedimages.
Figure 7
Figure 7
(a) and (b) Representative images of dissected organs of amouse bearing HEPG-2-induced tumors. The mouse was sacrificed and organs were removed and incubated with 100 μM of 1 for 5 hours under hypoxic conditions. 1. HEPG-2 tumor; 2. lung; 3. liver; 4.kidney; 5. spleen; 6. intestine; 7. heart. (c) H&E staining of murine sarcoma HEPG-2-induced tumor (×100). (d) H&E staining of murine sarcoma HEPG-2-induced tumor (×400). (e) Immunofluorescence of HEPG-2 tumor by Glypican 3 staining.

References

    1. Palmer BD, Zijl PV, Denny WA, Wilson WR. Reductive Chemistry of the Novel Hypoxia-Selective Cytotoxin 5-[N,N-Bis(2-chloroethyl)amino] -2,4-dinitrobenzamide. J Med Chem. 1995;38:1229–1241. doi: 10.1021/jm00007a019. - DOI - PubMed
    1. Bae J, et al. Nitroreductase-triggered activation of a novel caged fluorescent probe obtained from methylene blue. Chem Comm. 2015;51:12787–12790. doi: 10.1039/C5CC03824C. - DOI - PMC - PubMed
    1. Wong RH, Kwong T, Yau KH, Au-Yeung HY. Real time detection of live microbes using a highly sensitive bioluminescent nitroreductase probe. Chem Comm. 2015;51:4440–4442. doi: 10.1039/C4CC10345A. - DOI - PubMed
    1. Zhang J, et al. Efficient Two-Photon Fluorescent Probe for Nitroreductase Detection and Hypoxia Imaging in Tumor Cells and Tissues. Anal Chem. 2015;87:11832–11839. doi: 10.1021/acs.analchem.5b03336. - DOI - PubMed
    1. Kiyose K, et al. Hypoxia-Sensitive Fluorescent Probes for in Vivo Real-Time Fluorescence Imaging of Acute Ischemia. JAm Chem Soc. 2010;132:15846–15848. doi: 10.1021/ja105937q. - DOI - PubMed

Publication types

LinkOut - more resources