. 2017 Aug 23;7(1):9228.
doi: 10.1038/s41598-017-10050-5.

In vivo photothermal optical coherence tomography of endogenous and exogenous contrast agents in the eye

Affiliations

In vivo photothermal optical coherence tomography of endogenous and exogenous contrast agents in the eye

Maryse Lapierre-Landry et al. Sci Rep. .

Abstract

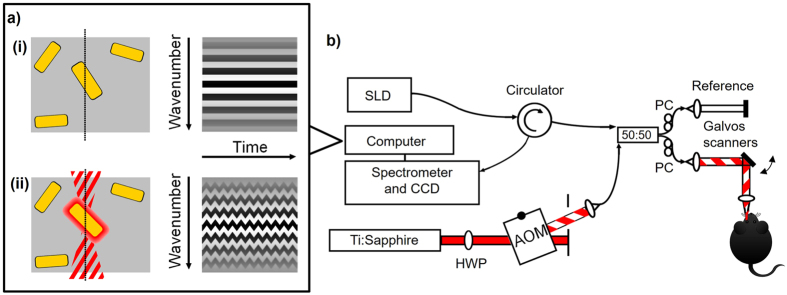
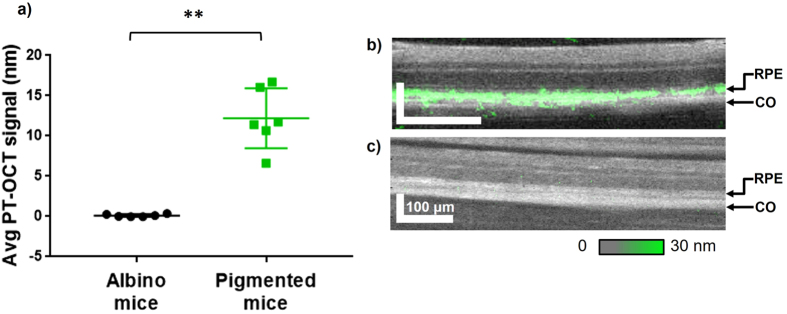
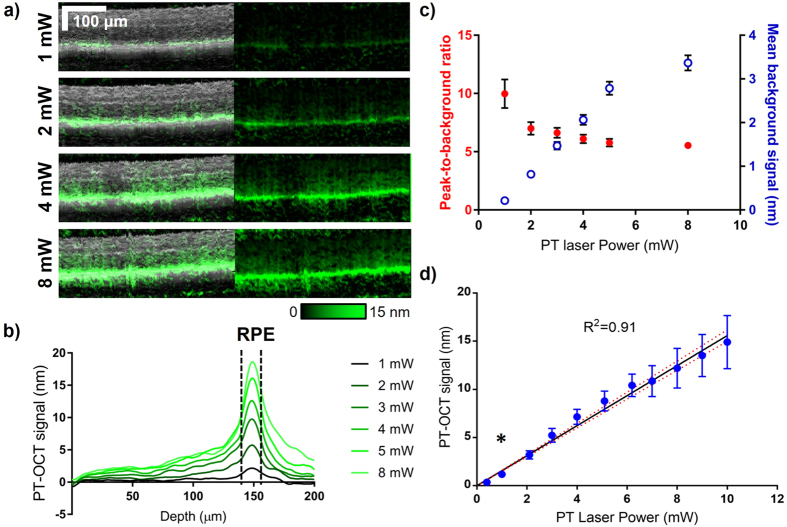
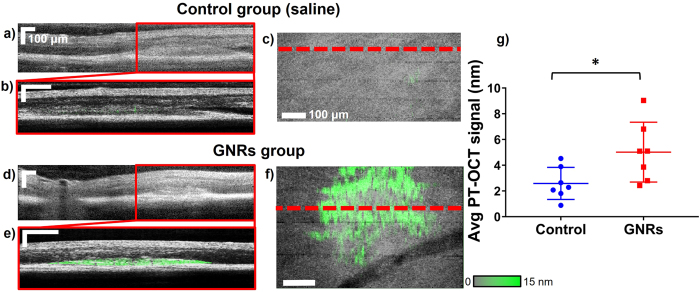
Optical coherence tomography (OCT) has become a standard-of-care in retinal imaging. OCT allows non-invasive imaging of the tissue structure but lacks specificity to contrast agents that could be used for in vivo molecular imaging. Photothermal OCT (PT-OCT) is a functional OCT-based technique that has been developed to detect absorbers in a sample. We demonstrate in vivo PT-OCT in the eye for the first time on both endogenous (melanin) and exogenous (gold nanorods) absorbers. Pigmented mice and albino mice (n = 6 eyes) were used to isolate the photothermal signal from the melanin in the retina. Pigmented mice with laser-induced choroidal neovascularization lesions (n = 7 eyes) were also imaged after a systemic injection of gold nanorods to observe their passive accumulation in the retina. This experiment demonstrates the feasibility of PT-OCT to image the distribution of both endogenous and exogenous absorbers in the mouse retina.


Conflict of interest statement

The authors declare that they have no competing interests.

Figures

Figure 1
Figure 1
Photothermal OCT principle and instrumentation. (a) Illustration of the OCT raw signal over time (i) in the absence of a photothermal beam and (ii) in the presence of an amplitude-modulated photothermal beam for a sample containing some gold nanorods (yellow). (b) PT-OCT instrumentation. Imaging beam (SLD) centered at λ = 860 nm is divided between the reference and sample arm using a 50:50 fiber coupler. The photothermal beam (Ti:Sapphire, λ = 750 nm) is amplitude modulated with an acousto-optic modulator (AOM), and coupled to the sample arm. A circulator redirects the light from the sample to the detector. HWP: Half-wave plate. PC: polarization controller.
Figure 2
Figure 2
In vivo PT-OCT of melanin. (a) Average PT-OCT signal from the retina for albino mice (no melanin) and pigmented mice (melanin) cohorts (n = 6 eyes per group). Photothermal laser power at 8 mW. Mean with standard deviation shown. **p < 0.01. (b) Example OCT B-scan of a pigmented mouse retina (grayscale) with PT-OCT signal overlaid (green). (c) Example OCT B-scan of an albino mouse retina (grayscale) with PT-OCT signal overlaid (green, no signal visible). The OCT images show fewer retinal layers than in a typical OCT B-scan of a human retina because of the smaller dimensions of a mouse retina and the axial resolution of standard 860 nm OCT systems, which are also used for human retina imaging. The PT-OCT signal represents the change in optical path length, in units of nm. Scale bar: 100 μm. RPE: retinal pigment epithelium. CO: choroid.
Figure 3
Figure 3
In vivo PT-OCT of melanin for different photothermal laser powers. (a) Example OCT B-scans (grayscale, left) of a pigmented mouse retina with corresponding PT-OCT signal (overlaid in green on the left, signal alone on the right) collected for different photothermal laser powers (1–8 mW). Scale bar: 100 μm. (b) Average PT-OCT signal for one B-scan (400 A-scans) collected at different photothermal laser powers (same eye as presented in (a)). The width at half-maximum of the signal peaks (dashed black lines) corresponds to the location of the RPE in depth. (c) Mean background signal (excludes the dashed region from (b)) and peak-to-background ratio for one example eye at different photothermal laser powers. Error bar: standard error. (d) Mean PT-OCT signal as a function of photothermal laser power for n = 6 eyes. Error bar: standard deviation. Linear fit y = 1.56x with 95%CI on the fit (red dashed). R2 = 0.91. *p < 0.05 between 1 mW and 0.4 mW (Mann-Whitney U test).
Figure 4
Figure 4
In vivo PT-OCT of gold nanoparticles. (a,d) OCT B-scan of the retina showing an LCNV lesion (boxed area) in, respectively, a mouse of the control group and a mouse of the gold nanorods group. (b,e) OCT B-scan of the LCNV lesion (grayscale) with PT-OCT signal overlaid (green) in, respectively, a mouse of the control group and a mouse of the gold nanorods group. (c,f) 2D en face mean projection of the OCT (grayscale) and PT-OCT (green) data volume in a control mouse and a mouse injected with gold nanorods. The location of the B-scan shown on the left are indicated by the red dashed line. Scale bar 100 μm. (g) Average PT-OCT signal normalized to the volume of the LCNV lesion for n = 7 eyes per group. Mean with standard deviation shown. *p < 0.05.

References

    1. Zysk AM, Nguyen FT, Oldenburg AL, Marks DL, Boppart SA. Optical coherence tomography: a review of clinical development from bench to bedside. Journal of biomedical optics. 2007;12(5):051403–051403. doi: 10.1117/1.2793736. - DOI - PubMed
    1. Kanagasingam Y, et al. Progress on retinal image analysis for age related macular degeneration. Progress in retinal and eye research. 2014;38:20–42. doi: 10.1016/j.preteyeres.2013.10.002. - DOI - PubMed
    1. Regatieri CV, Branchini L, Carmody J, Fujimoto JG, Duker JS. Choroidal thickness in patients with diabetic retinopathy analyzed by spectral-domain optical coherence tomography. Retina. 2012;32(3) doi: 10.1097/IAE.0B013E31822F5678. - DOI - PMC - PubMed
    1. Bussel II, Wollstein G, Schuman JS. OCT for glaucoma diagnosis, screening and detection of glaucoma progression. British Journal of Ophthalmology. 2014;98:15–19. doi: 10.1136/bjophthalmol-2013-304326. - DOI - PMC - PubMed
    1. Kim JH, et al. The inhibition of retinal neovascularization by gold nanoparticles via suppression of VEGFR-2 activation. Biomaterials. 2011;32(7):1865–1871. doi: 10.1016/j.biomaterials.2010.11.030. - DOI - PubMed

Publication types