. 2017 Nov;79(8):2376-2395.
doi: 10.3758/s13414-017-1404-8.

Interactions between visual working memory representations

Affiliations

Interactions between visual working memory representations

Gi-Yeul Bae et al. Atten Percept Psychophys. 2017 Nov.

Abstract

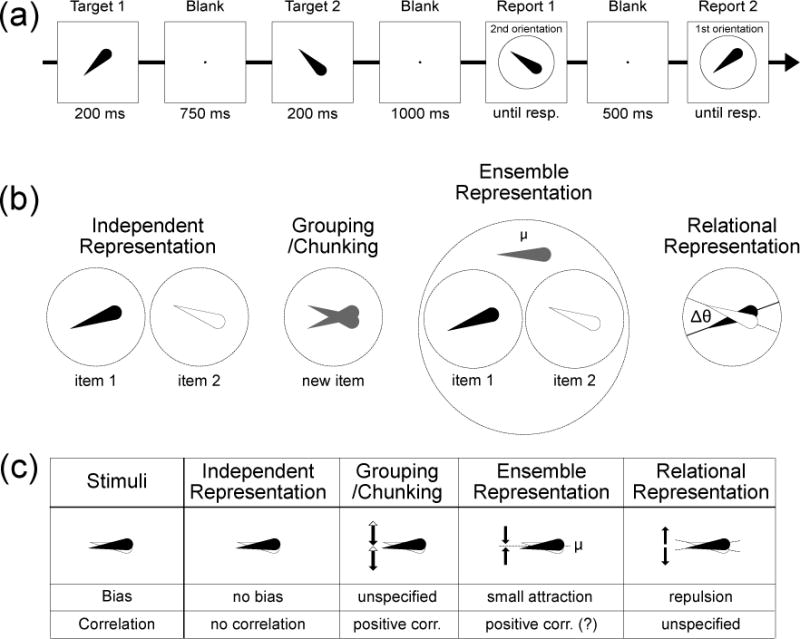
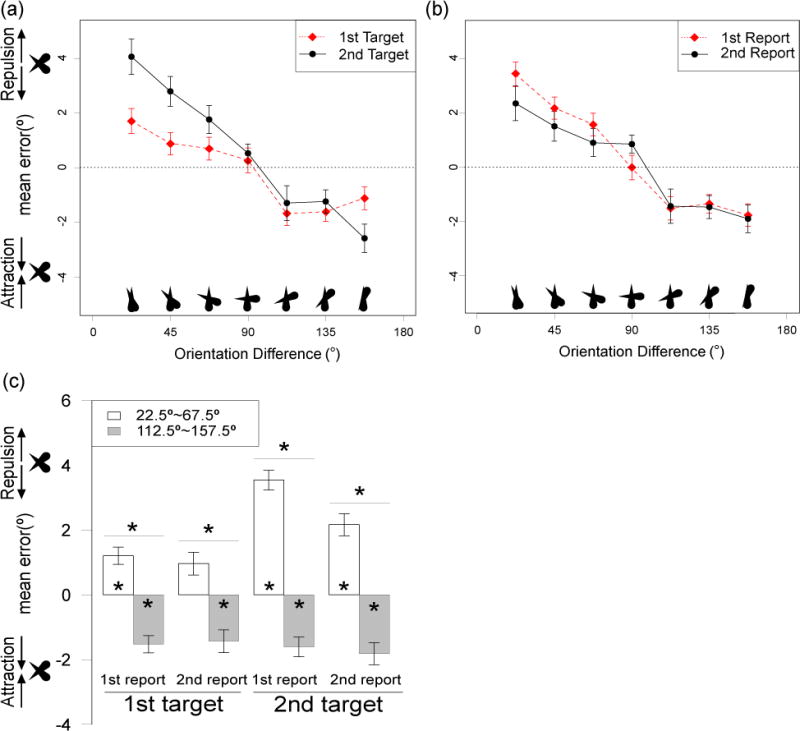
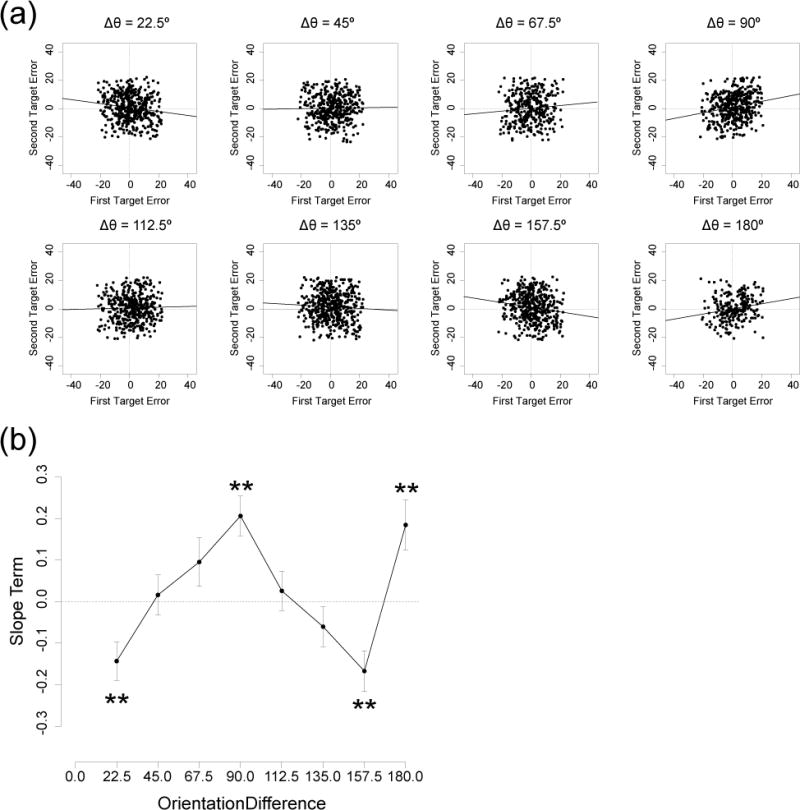
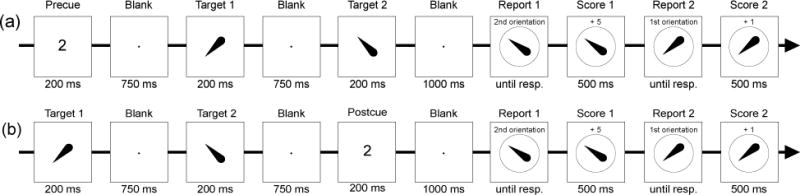
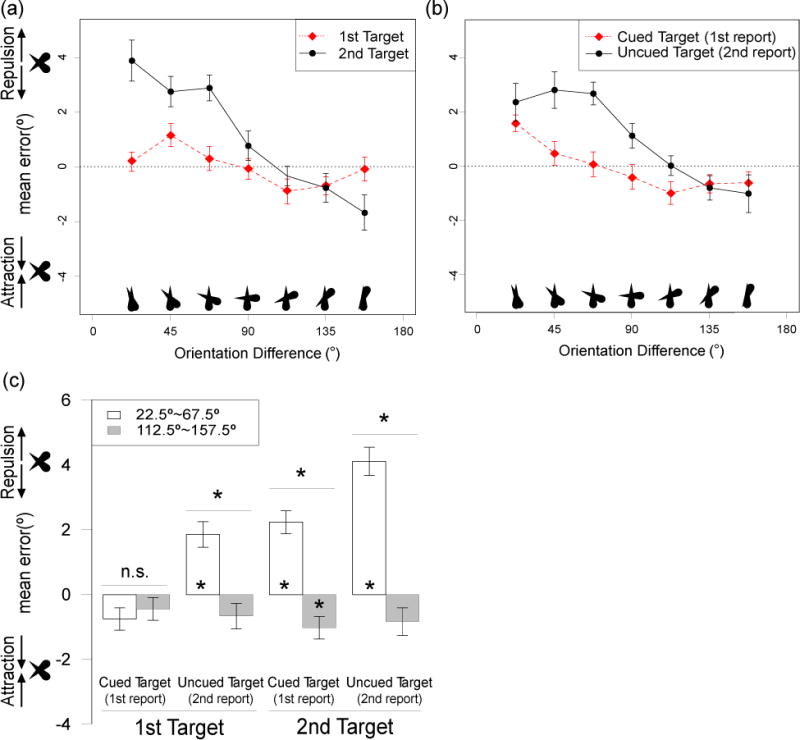
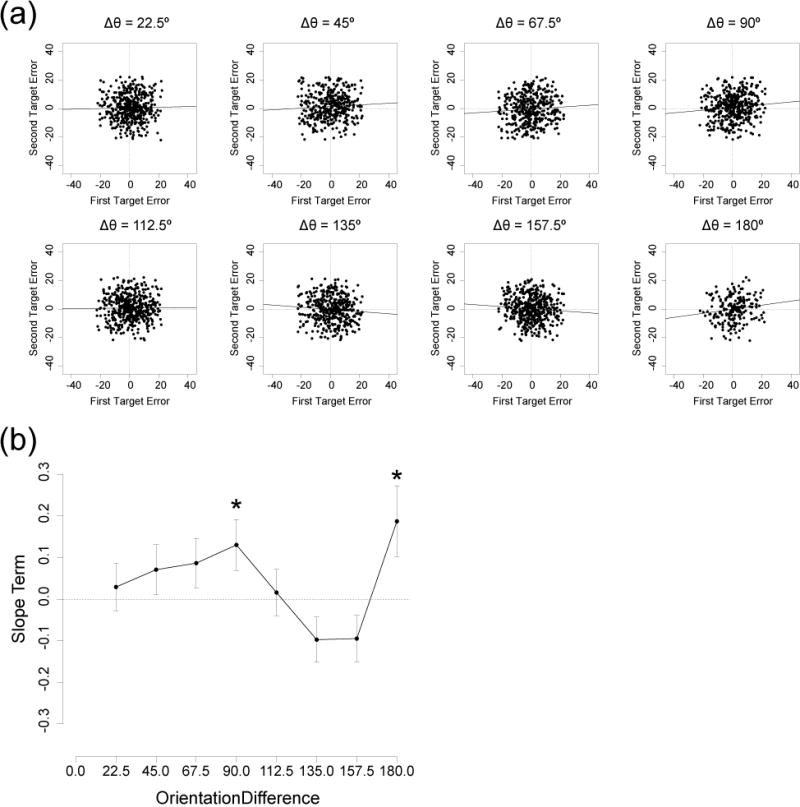
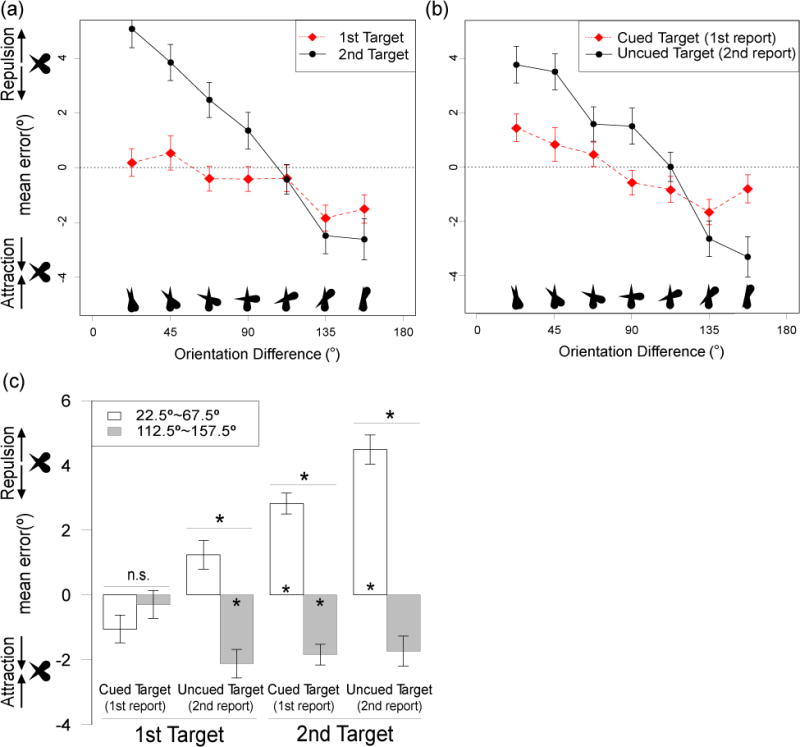
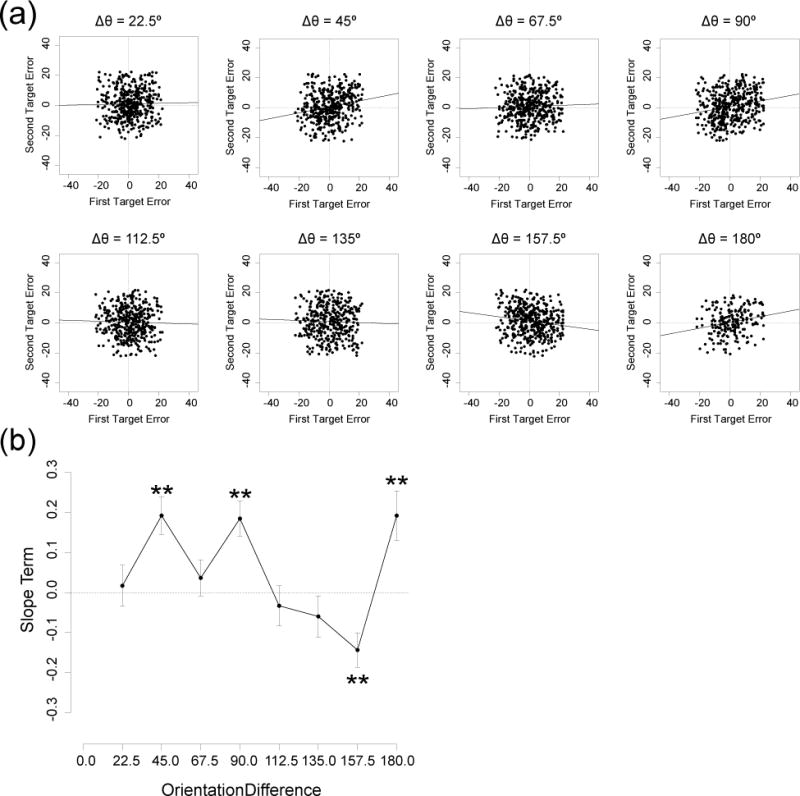
We investigated whether the representations of different objects are maintained independently in working memory or interact with each other. Observers were shown two sequentially presented orientations and required to reproduce each orientation after a delay. The sequential presentation minimized perceptual interactions so that we could isolate interactions between memory representations per se. We found that similar orientations were repelled from each other whereas dissimilar orientations were attracted to each other. In addition, when one of the items was given greater attentional priority by means of a cue, the representation of the high-priority item was not influenced very much by the orientation of the low-priority item, but the representation of the low-priority item was strongly influenced by the orientation of the high-priority item. This indicates that attention modulates the interactions between working memory representations. In addition, errors in the reported orientations of the two objects were positively correlated under some conditions, suggesting that representations of distinct objects may become grouped together in memory. Together, these results demonstrate that working-memory representations are not independent but instead interact with each other in a manner that depends on attentional priority.

Keywords: Attention; Attraction; Interaction; Repulsion; Working memory.


Figures

Figure 1
Figure 1
(a) Example of a single trial in Experiment 1. Observers remembered two serially presented target orientations and reproduced each orientation in a cued order. The second target is reported first in this example, but the order of report varied unpredictably across trials. (b) Four alternative models of the interactions between orientation memories. (c) Predictions of each model for the bias and correlation of the two orientation reports for a small difference in orientation between the two items being remembered. The independent representation models predict no bias or correlation in the memories. The grouping/chunking models predict that any noise in the memory of the group on a given trial will lead to errors in the same direction for both items, producing a positive correlation. The ensemble representation models predict that reports of the two items will be biased toward the mean of the two items and that the two reports will be positively correlated (because any noise in the mean will impact both reports in the same way). The relational representation models predict that nearby orientations will repel each other and that orientations differences near 180° will attract each other.
Figure 2
Figure 2
(a, b) Mean response error as a function of the orientation difference between the two items in Experiment 1. Data in a are plotted separately for the first and second targets on each trial, collapsed across order of report. Data in (b) are plotted separately for the first- and second-reported item on each trial, collapsed across the initial order of presentation. Dependent variable is the angular distance between reported orientation and actual orientation of the target being reported, reflected according to the direction of the other target. Positive error indicates bias away from the other target, and negative error represents bias toward the other target; the zero line indicates no bias. (c) Mean response error, collapsed into groups of trials with relatively small orientation differences (<90°) and groups of trials with relatively large orientation differences (>90°). Reported orientation of a given target was biased away from the orientation of the other target when the orientation difference was <90°, but biased toward the other item when the difference was >90°. This effect was larger for the second than for the first target, but was comparable for the first and second responses. Error bars show the within-subjects standard error of the mean (Morey, 2008). Asterisks over a pair of bars indicate significant difference between the means. Asterisks inside the bar indicate that the mean is significantly different from zero. *p < .05, FDR corrected
Figure 3
Figure 3
Trial-by-trial dependency between the two orientation reports in Experiment 1. (a) Scatterplots of response errors for the first (x-axis) and second (y-axis) targets on a given trial, with separate points for every trial in each observer, separated into the eight orientation differences. Trials with response errors larger than 22.5° were excluded to avoid contamination from random guesses and swapping errors. Solid line indicates maximum likelihood slope estimate from a linear mixed-effects model. (b) Slope term of the mixed-effects linear model obtained at each orientation difference. Error bars show standard error of each slope estimate. Asterisks indicate slopes that were significantly different from zero. **p < .01
Figure 4
Figure 4
(a) Example of a single trial in Experiment 2. Each trial began with a precue indicating which of the two upcoming orientations should be prioritized. The two targets were then presented, followed by report of the two orientations. The cued orientation was always reported first. Observers received 5 points for an accurate report of the cued item and 1 point for an accurate report of the uncued item. In this example, the second target is cued and reported first. (b) Example of a single trial in Experiment 3. This experiment was identical to Experiment 2 except that the precue was replaced with a postcue that was presented after the second target.
Figure 5
Figure 5
(a–b) Mean response error as a function of the orientation difference between the two items. Data in a are separated for the first and second targets on each trial, collapsed across which item was cued (and therefore collapsed across order of report). Data in (b) are separated according to which item was cued (and therefore reported first), collapsed across order of presentation. Positive error indicates bias away from the other target, and negative error represents bias toward the other target; the zero line indicates no bias. (c) Mean response error, collapsed into trials with relatively small orientation differences (<90°) and trials with relatively large orientation differences (>90°). Reported orientation of the reported target was biased away from the orientation of the other target when the orientation difference was <90°, but biased toward the other item when the difference was >90°. These repulsion and attraction effects were larger for the uncued target than for the cued target. Error bars show the within-subjects standard error of the mean (Morey, 2008). Asterisks over a pair of bars indicate significant difference between the means. Asterisks inside the bar indicate that the mean is significantly different from zero. *p < .05, FDR corrected
Figure 6
Figure 6
Trial-by-trial dependency between the two orientation reports in Experiment 2. (a) Scatterplots of response errors for the first target (x-axis) and the second target (y-axis) on a given trial, with a separate point for every trial in each observer, separated in the eight orientation differences. Trials with a response error larger than 22.5° were excluded to avoid contamination from random guesses and swapping errors. Solid line indicates maximum likelihood slope estimate from a linear mixed-effect model. (b) Slope term of the mixed-effect linear model obtained at each orientation difference. Error bars show the standard error of each slope estimate. Asterisks indicate slopes that were significantly different from zero. *p < .05
Figure 7
Figure 7
(a–b) Mean response error as a function of the orientation difference between the two items. Data in (a) are separated for the first and second targets on each trial, collapsed across which item was cued (and therefore collapsed across order of report). Data in (b) are separated according to which item was cued (and therefore reported first), collapsed across order of presentation. Positive error indicates bias away from the other target, and negative error represents bias toward the other target; the zero line indicates no bias. (c) Mean response error, collapsed into trials with relatively small orientation differences (<90°) and trials with relatively large orientation differences (>90°). Reported orientation of the reported target was biased away from the orientation of the other target when the orientation difference was <90°, but biased toward the other item when the difference was >90°. These repulsion and attraction effects were larger for the uncued than for the cued target. Error bars show the within-subjects standard error of the mean (Morey, 2008). Asterisks over a pair of bars indicate significant difference between the means. Asterisks inside the bar indicate that the mean is significantly different from zero. *p < .05, FDR corrected
Figure 8
Figure 8
Trial-by-trial dependency between the two orientation reports in Experiment 3. (a) Scatterplots of response errors for the first (x-axis) and second (y-axis) targets on a given trial, with separate points for every trial in each observer, separated into the eight orientation differences. Trials with response errors larger than 22.5° were excluded to avoid contamination from random guesses and swapping errors. Solid line indicates maximum likelihood slope estimate from a linear mixed-effects model. (b) Slope term of the mixed-effects linear model obtained at each orientation difference. Error bars show standard error of each slope estimate. Asterisks indicate slopes that were significantly different from zero. **p < .01

Similar articles

Cited by

References

    1. Albrecht AR, Scholl BJ. Perceptually averaging in a continuous visual world extracting statistical summary representations over time. Psychological Science. 2010;2:560–567. - PubMed
    1. Alvarez G, Cavanagh P. The capacity of visual short-term memory is set both by visual information load and by number of objects. Psychological Science. 2004;15:106–111. - PubMed
    1. Bae GY, Olkkonen M, Allred SR, Wilson C, Flombaum JF. Stimulus specific variability in color working memory with delayed estimation. Journal of Vision. 2014;14:1–23. - PubMed
    1. Bae GY, Olkkonen M, Allred S, Flombaum J. Why some colors appear more memorable than others: A model combining categories and particulars in color working memory. Journal of Experimental Psychology: General. 2015;144:744–763. - PubMed
    1. Bays PM, Catalo RFG, Husain M. The precision of visual working memory is set by allocation of a shared resource. Journal of Vision. 2009;9:1–11. - PMC - PubMed