. 2017 Nov;38(11):1435-1444.
doi: 10.1038/aps.2017.114. Epub 2017 Aug 24.

Pharmacokinetic and metabolomic analyses of the neuroprotective effects of salvianolic acid A in a rat ischemic stroke model

Affiliations

Pharmacokinetic and metabolomic analyses of the neuroprotective effects of salvianolic acid A in a rat ischemic stroke model

Si-Qi Feng et al. Acta Pharmacol Sin. 2017 Nov.

Abstract

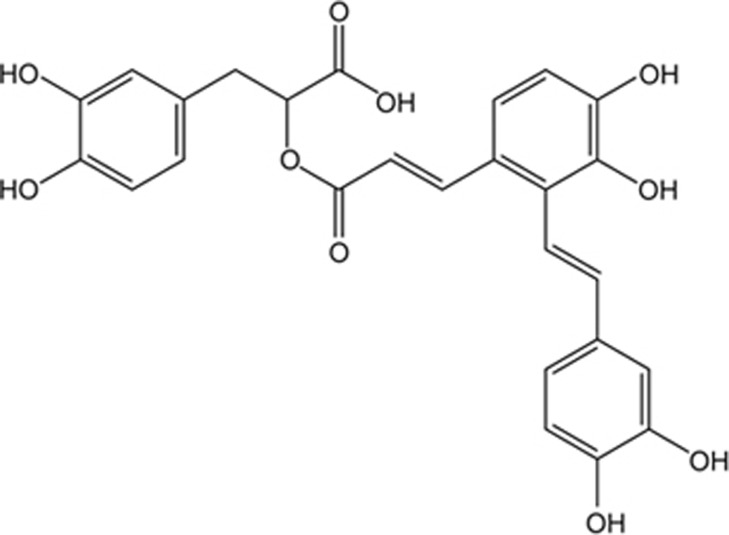
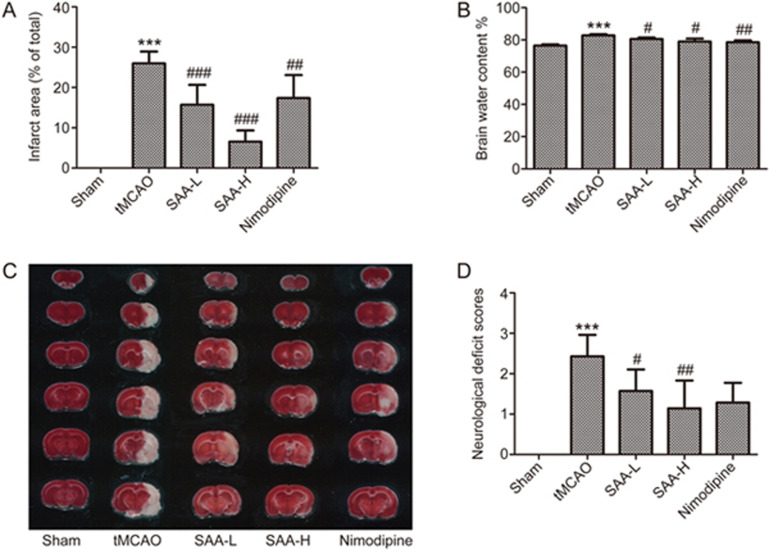
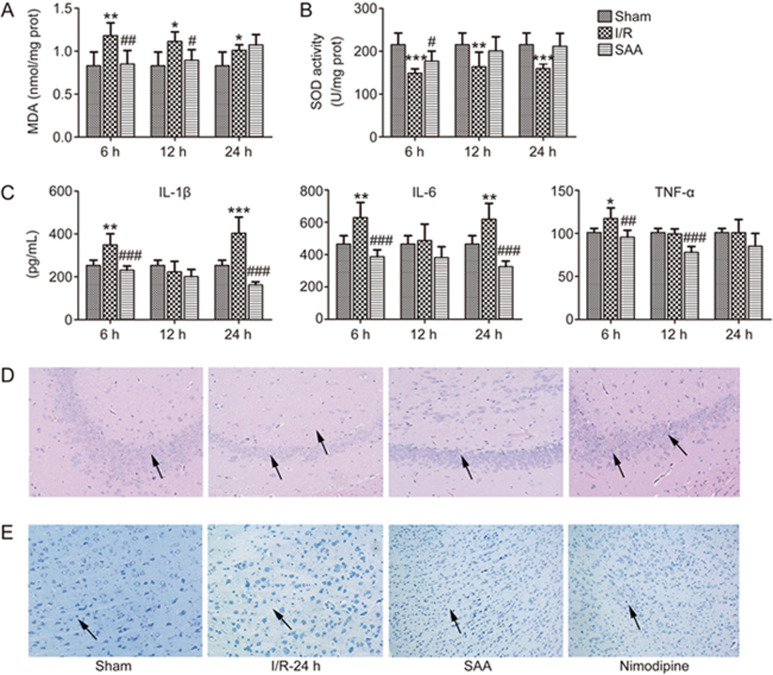
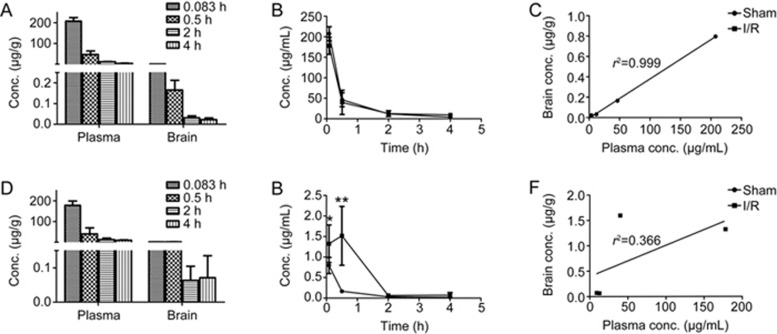
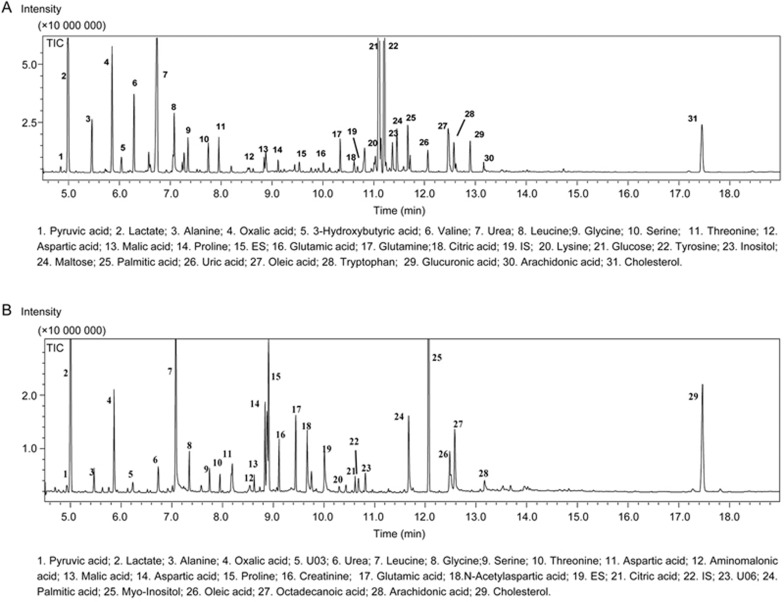
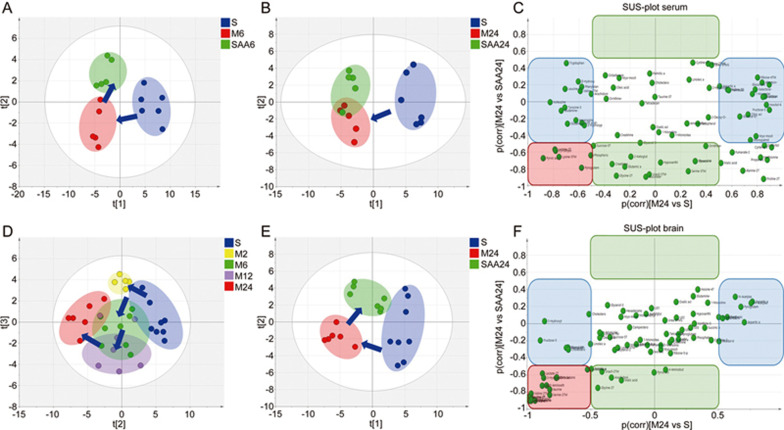
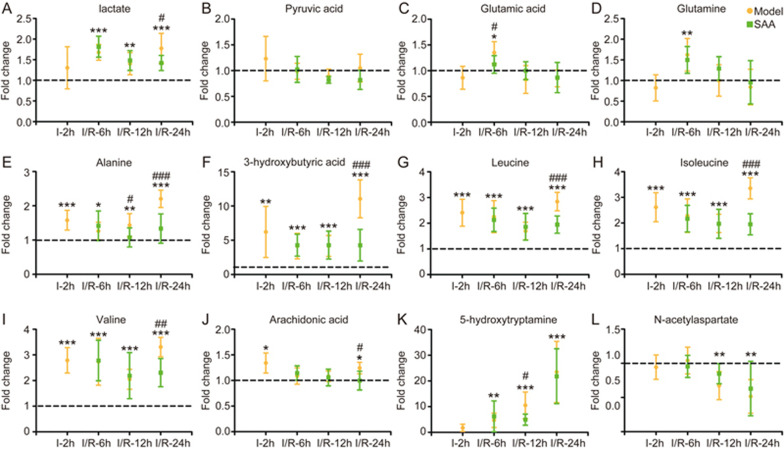
Salvianolic acid A (SAA), a water-soluble phenolic acid isolated from the root of Dan Shen, displays distinct antioxidant activity and effectiveness in protection against cerebral ischemia/reperfusion (I/R) damage. However, whether SAA can enter the central nervous system and exert its protective effects by directly targeting brain tissue remains unclear. In this study, we evaluated the cerebral protection of SAA in rats subjected to transient middle cerebral artery occlusion (tMCAO) followed by reperfusion. The rats were treated with SAA (5, 10 mg/kg, iv) when the reperfusion was performed. SAA administration significantly decreased cerebral infarct area and the brain water content, attenuated the neurological deficit and pathology, and enhanced the anti-inflammatory and antioxidant capacity in tMCAO rats. The concentration of SAA in the plasma and brain was detected using LC-MS/MS. A pharmacokinetic study revealed that the circulatory system exposure to SAA was equivalent in the sham controls and I/R rats, but the brain exposure to SAA was significantly higher in the I/R rats than in the sham controls (fold change of 9.17), suggesting that the enhanced exposure to SAA contributed to its cerebral protective effect. Using a GC/MS-based metabolomic platform, metabolites in the serum and brain tissue were extracted and profiled. According to the metabolomic pattern of the tissue data, SAA administration significantly modulated the I/R-caused perturbation of metabolism in the brain to a greater extent than that in the serum, demonstrating that SAA worked at the brain tissue level rather than the whole circulation system. In conclusion, a larger amount of SAA enters the central nervous system in ischemia/reperfusion rats to facilitate its protective and regulatory effects on the perturbed metabolism.


Figures

Figure 1
Figure 1
The chemical structure of salvianolic acid A.
Figure 2
Figure 2
Effects of SAA on neurological deficit, infarct area and brain water content. (A) The neurological deficit scores of the rats (measured at 24 h of reperfusion after ischemia). Each value represents the mean±SD of independent experiments (n=7). (B) Brain water content (n=3). (C) Representative photographs of TTC staining of coronal brain sections (2-mm thickness) from rats (stained at 24 h of reperfusion after ischemia). The normal tissue stained red and the infarct area remained pale. (D) Infarct area. SAA-L (low dose, 5 mg/kg) and SAA-H (high dose, 10 mg/kg) were administered by intravenous injection when the reperfusion was performed. Each value represents the mean±SD of independent experiments (n=6–9). *P<0.05, **P<0.01, and ***P<0.001, I/R-24 h vs sham; #P<0.05, ##P<0.01, and ###P<0.001, SAA vs I/R-24 h group.
Figure 3
Figure 3
(A) The content of MDA in brain tissue homogenate (measured at 6, 12, 24 h of reperfusion after ischemia). Each value represents the mean±SD of independent experiments (n=5). (B) The activity of SOD in brain tissue homogenate (measured at 6, 12 and 24 h of reperfusion after ischemia). Each value represents the mean±SD of independent experiments (n=5). (C) The assessment of interleukin-1β (IL-1β), interleukin-6 (IL-6) and tumor necrosis factor-α (TNF-α) (measured at 6, 12 and 24 h of reperfusion after ischemia). Each value represents the mean±SD of independent experiments (n=6). Representative photographs of H&E (D) and Nissl (E) staining (stained at 24 h of reperfusion after ischemia) with a magnification of 200×. SAA (10 mg/kg) was administered by intravenous injection when the reperfusion was performed. *P<0.05, **P<0.01, and ***P<0.001, I/R vs Sham; #P<0.05, ##P<0.01, and ###P<0.001, SAA vs I/R.
Figure 4
Figure 4
Brain distribution of SAA in the sham and I/R groups. The concentrations of SAA in the brains of the sham group (A) and the I/R group (D) at 0.083, 0.5, 2 and 4 h after treatment with SAA (n=3–7). The dynamic concentrations of SAA in the plasma (B) and the brain (E) between the sham and I/R rats. The linear correlativity between the SAA concentrations in the plasma and the brain in the rats of the sham group (C) and the I/R group (F). SAA (10 mg/kg) was administered by intravenous injection when the reperfusion was performed. *P<0.05 and **P<0.01, I/R vs Sham.
Figure 5
Figure 5
Total ion chromatograms (TICs) of serum (A) and brain (B) extracts and some identified compounds marked in the chromatograms.
Figure 6
Figure 6
The partial least squares discriminant analysis (PLS-DA) of metabolites changes in serum (A, B) (n=5–6) and in brain tissue (D, E) (n=6–8) after ischemia/reperfusion injury. Shared and unique structure plot (SUS plot) of serum (C) and brain tissue (F) correlating the OPLS-DA models of M24 versus S (x-axis) and M24 versus SAA24 (y-axis). Accordingly, the variables in the lower left corners are the compounds that showed the reserved effect of SAA on ischemia/reperfusion injury (red box). However, metabolites located along the axes are specifically altered in the model group (blue boxes) and the SAA group (green boxes). S for Sham, M2 for I-2 h, M6 for I/R-6 h, M12 for I/R-12 h, M24 for I/R-24 h, SAA6 for I/R-6 h treated with SAA, and SAA24 for I/R-24 treated with SAA. SAA (10 mg/kg) was administered by intravenous injection when the reperfusion was performed.
Figure 7
Figure 7
The representative metabolites changes compared to the sham group (dotted line) in the brain tissue during the ischemia/reperfusion time. SAA (10 mg/kg) was administered by intravenous injection when the reperfusion was performed. *P<0.05, **P<0.01, and ***P<0.001, Model vs Sham; #P<0.05, ##P<0.01, and ###P<0.001, SAA vs Model.

References

    1. Siesjo BK. Mechanisms of ischemic brain damage. Crit Care Med 1988; 16: 954–63. - PubMed
    1. Di Carlo A. Human and economic burden of stroke. Age Ageing 2009; 38: 4–5. - PubMed
    1. Hacke W, Kaste M, Fieschi C, Von Kummer R, Davalos A, Meier D, et al. Randomised double-blind placebo-controlled trial of thrombolytic therapy with intravenous alteplase in acute ischaemic stroke (ECASS II). Second European-Australasian Acute Stroke Study Investigators. Lancet 1998; 352: 1245–51. - PubMed
    1. Marler JR, Tilley BC, Lu M, Brott TG, Lyden PC, Grotta JC, et al. Early stroke treatment associated with better outcome: the NINDS rt-PA stroke study. Neurology 2000; 55: 1649–55. - PubMed
    1. Allen CL, Bayraktutan U. Oxidative stress and its role in the pathogenesis of ischaemic stroke. Int J Stroke 2009; 4: 461–70. - PubMed

MeSH terms