

Identifying highly informative genetic markers for quantification of ancestry proportions in crossbred sheep populations: implications for choosing optimum levels of admixture
- PMID: 28836937
- PMCID: PMC5571632
- DOI: 10.1186/s12863-017-0526-2
Identifying highly informative genetic markers for quantification of ancestry proportions in crossbred sheep populations: implications for choosing optimum levels of admixture
Abstract
Background: Understanding the relationship between genetic admixture and performances is crucial for the success of crossbreeding programs. Use of small sets of ancestry informative markers (AIMs) is a cost effective option to estimate the levels of admixture in situations where pedigree recording is difficult. In this study we select AIMs from Ovine 50KSNP data (SNP – single nucleotide polymorphism) and validate their ability in estimating the contributions of parental breeds to get information about optimum admixture levels for smallholders.
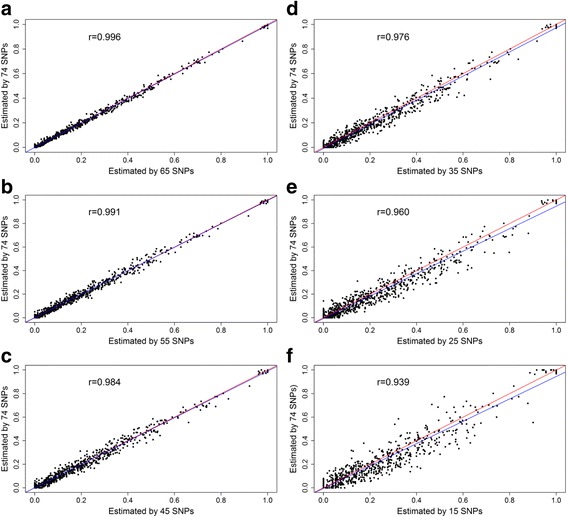
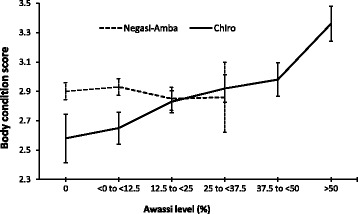
Results: We estimated admixture levels using ADMIXTURE software based on 74 AIMs selected from Ovine 50KSNP data. Awassi x Ethiopian fat-tailed crossbred sheep populations kept in government farms and farmer villages in different districts were included in the study. Mean Awassi levels estimated based on the selected AIMs were close to the Awassi levels obtained from pedigree information. Estimates from the 74 SNPs were compared to subsets of 65, 55, 45, 35, 25 and 15 SNPs selected based on both top and bottom fixation index (FST) rank using Spearman’s rank correlation (r = 0.862–0.996). A t-test comparison revealed that all SNP subsets had produced similar (P > 0.05) estimates with the 74 SNPs, except for the bottom 15 SNPs (P < 0.05). However estimates based on 45 and above SNP subsets were relatively close to the fitted regression line (r = 0.969–0.996). Association of admixture levels with lamb growth showed that Awassi level affected (P < 0.05) eight months weight in both farmer locations, lambs with higher Awassi levels were heavier. Lambing interval of ewes was longer as Awassi level increased, but this drawback was outweighed by the increased productivity of ewes in terms of eight months lamb weight per year.
Conclusions: The results indicate that the Ovine 50KSNP array is a powerful tool to identify small sets of AIMs for admixture studies. The results of this study reveal about 45AIMs to accurately estimate admixture levels. If admixture estimation service with such low cost SNP chip would be available, farmers would have a clear market advantage without the need to rely on incomplete or possibly inaccurate pedigree records. Based on the results presented here, we were able to suggest optimum levels of breed composition for the two farmer environments investigated.
Electronic supplementary material: The online version of this article (doi:10.1186/s12863-017-0526-2) contains supplementary material, which is available to authorized users.
Keywords: Ancestry informative markers; Awassi; Crossbreeding; Ethiopia; Menz; Ovine; SNP; Wollo.
Conflict of interest statement
Ethics approval
Ear tissue samples were collected from village sheep flocks using Allflex ear tissue sampler (Allflex USA Inc., 2014) as part of routine data and sample collection in Department of Animal Science, Debre Berhan Agricultural Research Center, P.O.Box 112, Debre Berhan, Ethiopia according to local legislation and standard procedure. The phenotype data of genotyped animals were gathered for previous projects by the same institution, with formal consent and agreement of sheep owners of use of data for exploring the best type of breeding strategy for the communities involved. This project used genotype and phenotype information for the same purpose, therefore no additional ethics statement was needed.
Consent for publication
Not applicable.
Competing interests
The authors declare that they have no competing interests.
Publisher’s Note
Springer Nature remains neutral with regard to jurisdictional claims in published maps and institutional affiliations.
Figures


References
-
- Kosgey IS, Baker RL, Udo HMJ, Van Arendonk JAM. Successes and failures of small ruminant breeding programmes in the tropics: a review. Small Rumin Res. 2006;61:13–28. doi: 10.1016/j.smallrumres.2005.01.003. - DOI
-
- Haile A, Tembely S, Anindo D, Mukasa-Mugerwa E, Rege JE, Yami A, et al. Effects of breed and dietary protein supplementation on the responses to gastrointestinal nematode infections in Ethiopian sheep. Small Rumin Res. 2002;44:247–261. doi: 10.1016/S0921-4488(02)00080-9. - DOI
Publication types
MeSH terms
Substances
LinkOut - more resources
Full Text Sources
Other Literature Sources
