Comparative Study
. 2017 Aug 24;24(1):60.
doi: 10.1186/s12929-017-0370-8.

Comprehensive comparison of three different animal models for systemic inflammation

Affiliations
Comparative Study

Comprehensive comparison of three different animal models for systemic inflammation

Semjon Seemann et al. J Biomed Sci. .

Abstract

Background: To mimic systemic inflammation in humans, different animal models have been developed. Since these models are still discussed controversially, we aimed to comparatively evaluate the most widely used models with respect to the systemic effects, the influence on organ functions and to the underlying pathophysiological processes.

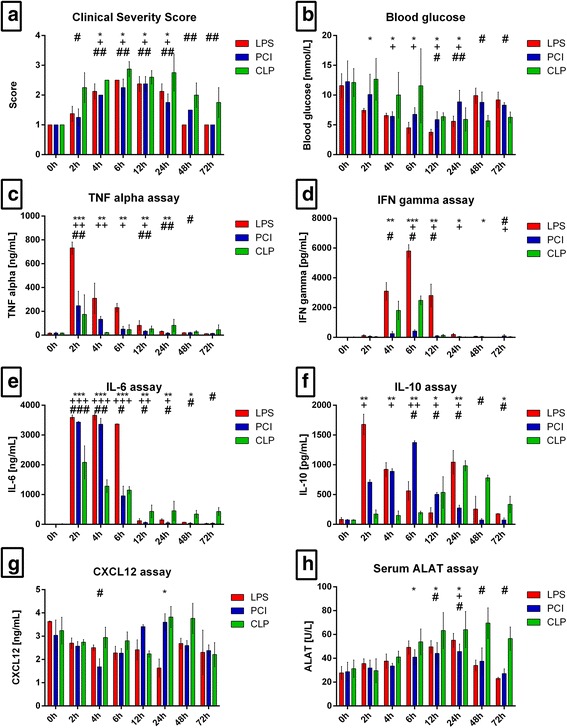
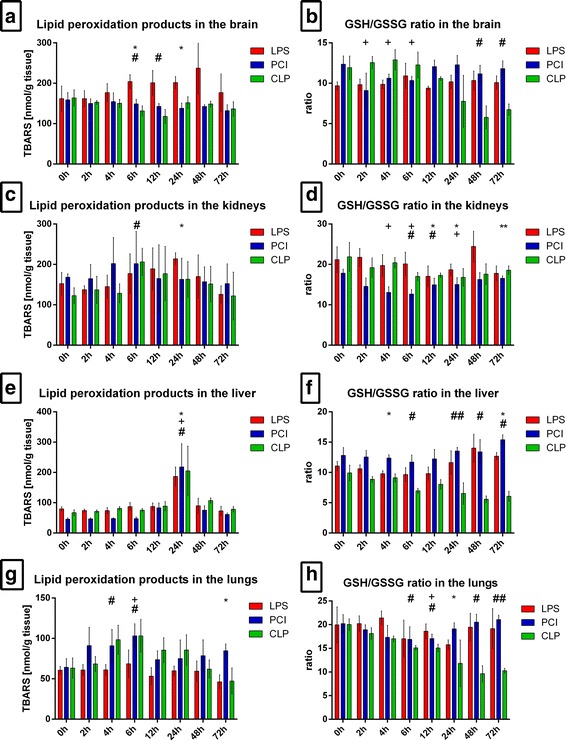
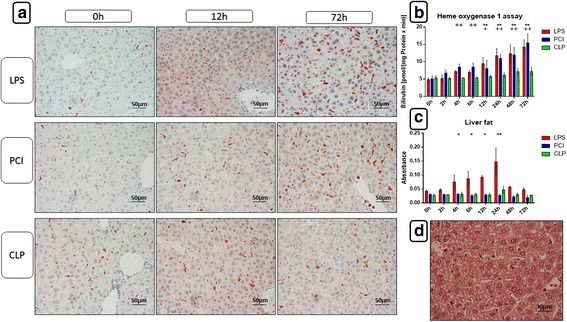
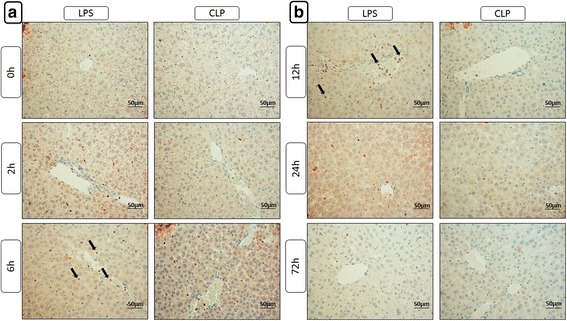
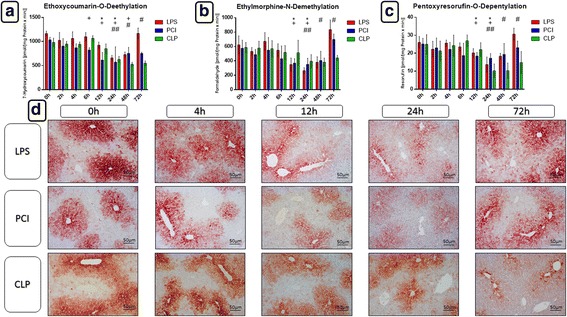
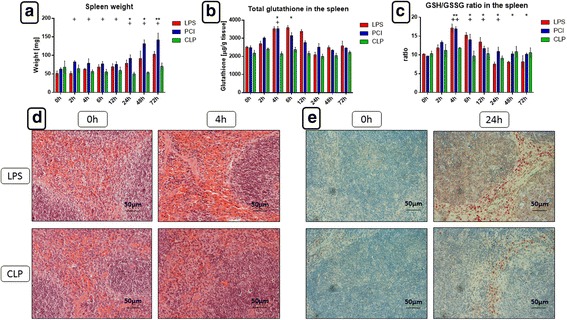
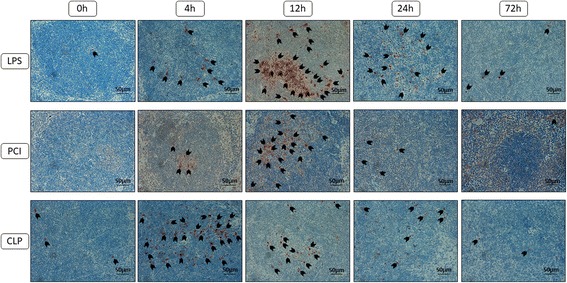
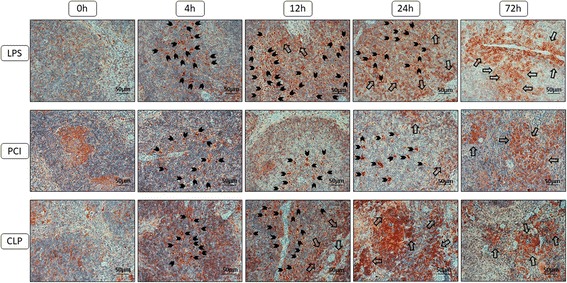
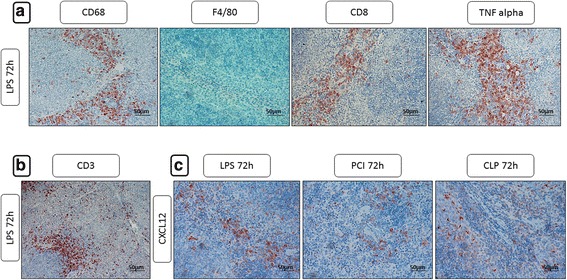
Methods: Systemic inflammation was induced in C57BL/6N mice with lipopolysaccharide (LPS) treatment, peritoneal contamination and infection (PCI), or cecal ligation and puncture (CLP). Blood glucose and circulating cytokine levels were evaluated at 0, 2, 4, 6, 12, 24, 48, and 72 h after induction of inflammation. Additionally, oxidative stress in various organs and liver biotransformation capacity were determined. Markers for oxidative stress, apoptosis, infiltrating immune cells, as well as cytokine expression patterns, were assessed in liver and spleen tissue by immunohistochemistry.

Results: Treating mice with LPS and PCI induced a very similar course of inflammation; however, LPS treatment elicited a stronger response. In both models, serum pro-inflammatory cytokine levels rapidly increased whereas blood glucose decreased. Organs showed early signs of oxidative stress, and apoptosis was increased in splenic cells. In addition, liver biotransformation capacity was reduced and there was pronounced immune cell infiltration in both the liver and spleen. Mice exposed to either LPS or PCI recovered after 72 h. In contrast, CLP treatment induced comparatively fewer effects, but a more protracted course of inflammation.

Conclusions: The LPS model of systemic inflammation revealed to be most suitable when being interested in the impact of new therapies for acute inflammation. When using the CLP model to mimic human sepsis more closely, a longer time course should be employed, as the treatment induces delayed development of systemic inflammation.

Keywords: CLP; Cytokines; LPS; Oxidative stress; PCI; Systemic inflammation.


Conflict of interest statement

Ethics approval and consent to participate

The study was conducted under the licence of the Thuringian Animal Protection Committee (Approval number: 02–044/14). The principles of laboratory animal care and the German Law on the Protection of Animals as well as the Directive 2010/63/EU were followed.

Consent for publication

Not applicable.

Competing interests

The authors declare that there is no conflict of interest that could be perceived as prejudicing the impartiality of the research reported.

Publisher’s Note

Springer Nature remains neutral with regard to jurisdictional claims in published maps and institutional affiliations.

Figures

Fig. 1
Fig. 1
General condition and systemic parameters. Mice were treated either with LPS, PCI, CLP, or were left untreated (control). 0 h (control), 2 h, 4 h, 6 h, 12 h, 24 h, 48 h and 72 h after inflammation onset, the Clinical Severity Score (a) was assessed and the mice were sacrificed. Blood glucose content was determined from whole blood (b) and serum was obtained for TNF-α, IFN-γ, IL-6, IL-10, CXCL12 and ALAT measurements (c-h). Data are given as mean ± standard deviation (SD) or as median with interquartile ranges (CSS), respectively; n = 4–6 for each group and time point. Statistical significance was determined by using the non-parametric Kruskal-Wallis test, followed by pairwise Mann-Whitney U tests. Statistical comparisons were made versus the control of each group and are denoted as follows: LPS (asterisk, *), PCI (plus, +), CLP (diamond, #). A p value <0.05 (*,+,#) was considered statistically significant; a p value <0.01 (**,++,##) and a p value <0.001 (***,+++,###) are further specified
Fig. 2
Fig. 2
Oxidative stress in different organs. At the time point indicated, mice were sacrificed and different organs were collected for the analysis of the tissue content of lipid peroxidation products as determined by thiobarbituric acid reactive substances (TBARS) (a, c, e, g). Additionally, the glutathione status was assessed and the GSH/GSSG ratio was calculated (b, d, f, h). Data are given as mean ± standard deviation (SD), n = 4–6 for each group and time point. Statistical significance was determined by using the non-parametric Kruskal-Wallis test, followed by pairwise Mann-Whitney U tests. Statistical comparisons were made versus the control of each group and are denoted as follows: LPS (asterisk, *), PCI (plus, +), CLP (diamond, #). A p value <0.05 (*,+,#) was considered statistically significant; a p value <0.01 (**,++,##) and a p value <0.001 (***,+++,###) are further specified
Fig. 3
Fig. 3
Heme oxygenase-1 expression and activitiy and total fat content in the livers. At the time point indicated, mice were sacrificed and livers were collected for further biochemical and histological analysis. Representative photomicrographs from one of 4–6 different tissue samples stained for HO-1 expression at 0 h, 24 h and 72 h after LPS, PCI or CLP treatment are shown (immunohistochemistry (red-brown color), counterstaining with hematoxylin, original magnification: (a, 400×)). Additionally, HO-1 activities were assessed in the liver 9000 g supernatants of liver homogenates as described in the Materials and Methods section (b). As an approximate measurement for the fat content, the turbidity value in the 9000 g supernatants of the livers was determined (c) and HE stainings were performed. The photomicrograph in (d) shows a representative liver of an endotoxin treated mouse after 24 h, displaying large amounts of fat droplets. Data are given as mean ± standard deviation (SD), n = 4–6 for each group and time point. Statistical significance was determined by using the non-parametric Kruskal-Wallis test, followed by pairwise Mann-Whitney U tests. Statistical comparisons were made versus the control of each group and are denoted as follows: LPS (asterisk, *), PCI (plus, +), CLP (diamond, #). A p value <0.05 (*,+,#) was considered statistically significant; a p value <0.01 (**,++,##) and a p value <0.001 (***,+++,###) are further specified
Fig. 4
Fig. 4
Immunohistochemical evaluation of iNOS expression. At the time point indicated, mice were sacrificed and the livers were collected for immunohistochemical analysis of iNOS expression (red-brown color, counterstaining with hematoxylin). Representative photomicrographs from one of 4–6 different tissue samples each are shown (original magnification: (a, b) 400×, arrows are used to exemplarily show iNOS expressing infiltrating neutrophil granulocytes). The time points 0 h, 4 h, 12 h, 24 h and 72 h were chosen as representative time points to show the course. The staining results after PCI treatment are not depicted separately but can be found in the additional file 3 as the course was very similar to that observed after LPS administration, with the only difference, however, that less iNOS positive cells are to be seen
Fig. 5
Fig. 5
Biotransformation capacity in the livers. At the time point indicated, mice were sacrificed and the livers were collected for biochemical and histological analysis. Ethoxycoumarin-O-deethylation [ECOD] (a), ethylmorphine-N-demethylation [EMND] (b) and pentoxyresorufin-O-depentylation [PROD] (c) activities in 9000 g supernatants are shown exemplarily. Data are given as mean ± standard deviation (SD), n = 4–6 for each group and time point. Statistical significance was determined by using the non-parametric Kruskal-Wallis test, followed by pairwise Mann-Whitney U tests. Statistical comparisons were made versus the control of each group and are denoted as follows: LPS (asterisk, *), PCI (plus, +), CLP (diamond, #). A p value <0.05 (*,+,#) was considered statistically significant; a p value <0.01 (**,++,##) and a p value <0.001 (***,+++,###) are further specified. d: CYP 3A2 isoforms expressions in liver tissue as determined by immunohistochemistry (red-brown color, counterstaining with hematoxylin). Representative photomicrographs from one of 4–6 different liver tissue samples are shown (original magnification: 400×). 0 h, 4 h, 12 h, 24 h and 72 h were chosen as representative time points to depict the course
Fig. 6
Fig. 6
Spleen weights, glutathione status, histomorphology and iNOS expression in the spleen. At the time point indicated, mice were sacrificed and the spleens were collected for further analysis. (a) Spleen weights. (b, c) Total glutathione content and GSH/GSSG ratio in the spleen tissue. Data are given as mean ± standard deviation (SD), n = 4–6 for each group and time point. Statistical significance was determined by using the non-parametric Kruskal-Wallis test, followed by pairwise Mann-Whitney U tests. Statistical comparisons were made versus the control of each group and are denoted as follows: LPS (asterisk, *), PCI (plus, +), CLP (diamond, #). A p value <0.05 (*,+,#) was considered statistically significant; a p value <0.01 (**,++,##) and a p value <0.001 (***,+++,###) are further specified. (d) HE staining showing a large amount of erythrocytes in the red pulp of endotoxic mice after 4 h and a less pronounced effect after CLP. (e) iNOS expression in the spleens, 24 h after LPS and CLP treatment (immunohistochemistry [red-brown color], counterstaining with hematoxylin). Representative photomicrographs from one of 4–6 different tissue samples each are shown (original magnification: 400×)
Fig. 7
Fig. 7
Cleaved caspase-3 expression in the spleens. At the time point indicated, mice were sacrificed and the spleens were collected for immunohistological analysis. Representative photomicrographs from one of 4–6 different tissue samples stained for cleaved caspase-3 expression are shown (red-brown color, counterstaining with hematoxylin; original magnification: 400×). 0 h, 4 h, 12 h, 24 h and 72 h were chosen as representative time points to depict the course. Furthermore, arrowheads were added to obtain an overview about the amount of cells expressing the enzyme
Fig. 8
Fig. 8
CXCR4 expression in the spleens. At the time point indicated, mice were sacrificed and the spleens were collected for immunohistological analysis. Representative photomicrographs from one of 4–6 different tissue samples stained for CXCR4 expression are shown (red-brown color, counterstaining with hematoxylin; original magnification: 400×). 0 h, 4 h, 12 h, 24 h and 72 h were chosen as representative time points to depict the course. Additionally, arrowheads were added to mark the CXCR4 positive cells that were engulfed by the tingible body macrophages and larger arrows were used to show the infiltrating immune cells exhibiting membrane-bound CXCR4 expression at later time points
Fig. 9
Fig. 9
CD68, F4/80, CD8, TNF-α, CD3 and CXCL12 expression in the spleens after 72 h. At the time point indicated, mice were sacrificed and the spleens were collected for immunohistological analysis. Representative photomicrographs from one of 4–6 different tissue samples stained 72 h after inflammation onset for CD68, F4/80, CD8, TNF-α, CD3 and CXCL12 expression are shown (red-brown color, counterstaining with hematoxylin; original magnification: 400×)

References

    1. Martin G, Brunkhorst FM, Janes JM, Reinhart K, Sundin DP, Garnett K, Beale R. The international PROGRESS registry of patients with severe sepsis: Drotrecogin alfa (activated) use and patient outcomes. Crit Care. 2009;13:R103. doi: 10.1186/cc7936. - DOI - PMC - PubMed
    1. Stortz JA, Raymond SL, Mira JC, Moldawer LL, Mohr AM, Efron PA. Murine models of sepsis and trauma: can we bridge the gap? ILAR J. 2017:1–16. 10.1093/ilar/ilx007. - PMC - PubMed
    1. Remick DG, Newcomb DE, Bolgos GL, Call DR. Comparison of the mortality and inflammatory response of two models of sepsis: Lipopolysaccharide vs. cecal ligation and puncture. Shock. 2000;13:110–116. doi: 10.1097/00024382-200013020-00004. - DOI - PubMed
    1. Recknagel P, Gonnert FA, Halilbasic E, Gajda M, Jbeily N, Lupp A, et al. Mechanisms and functional consequences of liver failure substantially differ between endotoxaemia and faecal peritonitis in rats. Liver Int. 2013;33:283–293. doi: 10.1111/liv.12012. - DOI - PubMed
    1. Deitch EA. Animal models of sepsis and shock: a review and lessons learned. Shock. 1998;9:1–11. doi: 10.1097/00024382-199801000-00001. - DOI - PubMed

Publication types