. 2017 Aug 24:6:e25008.
doi: 10.7554/eLife.25008.

Modelling the drivers of the spread of Plasmodium falciparum hrp2 gene deletions in sub-Saharan Africa

Affiliations

Modelling the drivers of the spread of Plasmodium falciparum hrp2 gene deletions in sub-Saharan Africa

Oliver J Watson et al. Elife. .

Abstract

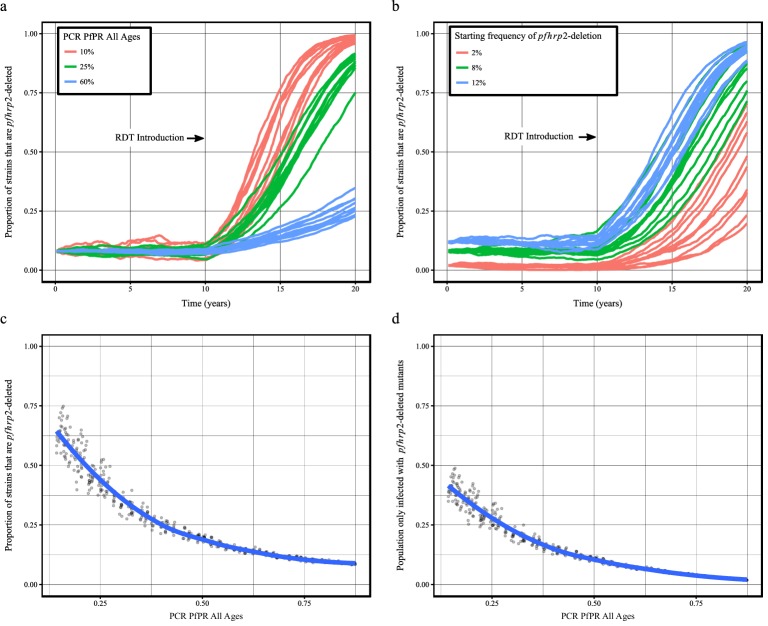
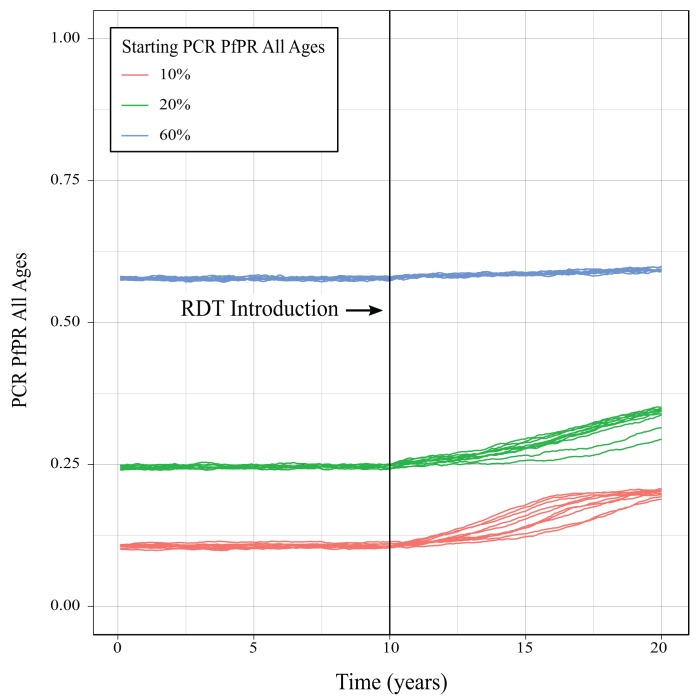
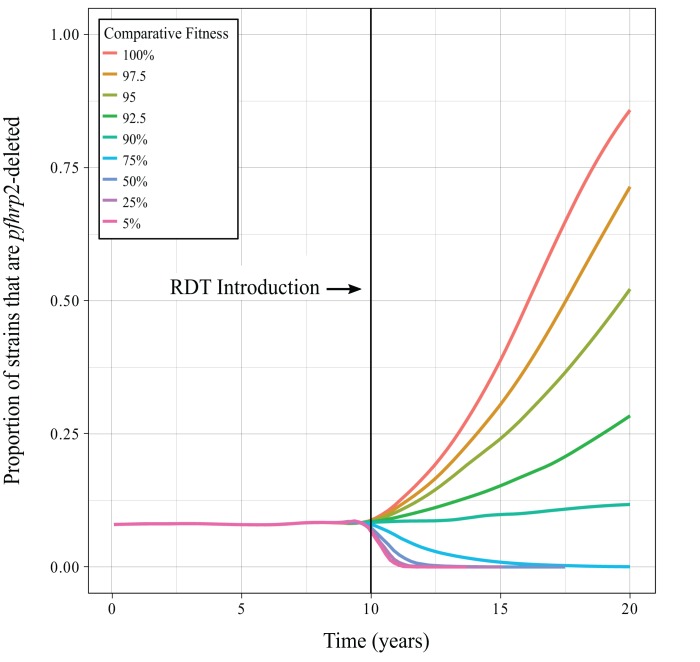
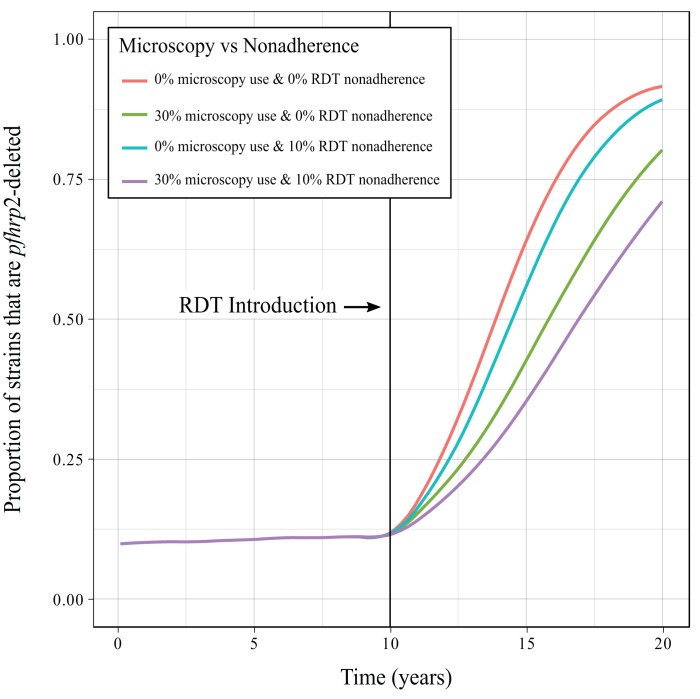
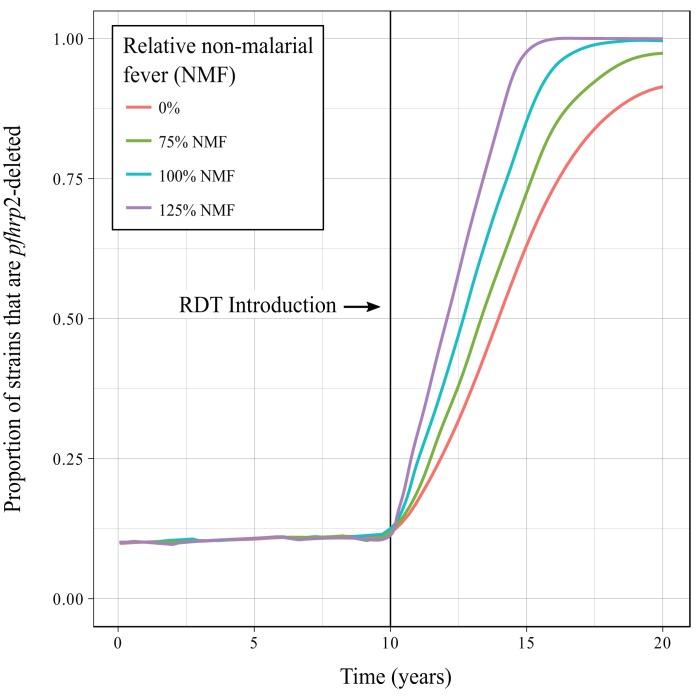
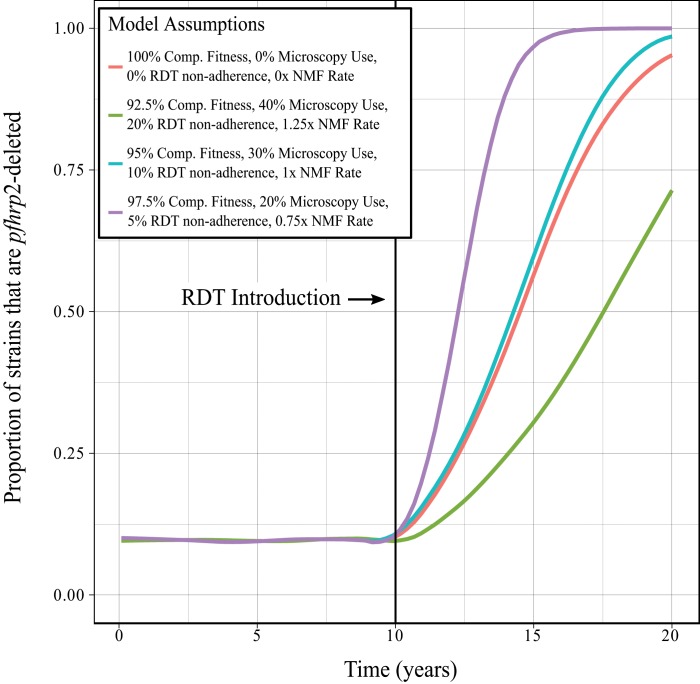
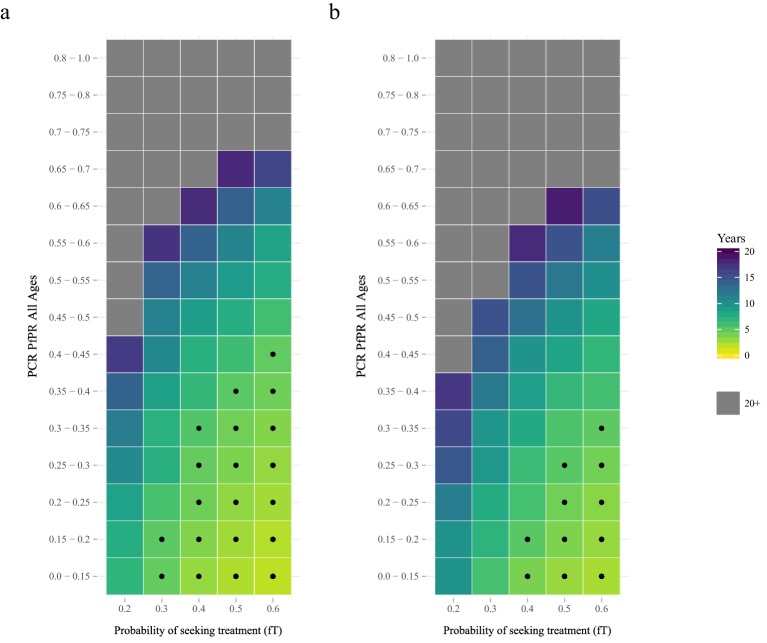
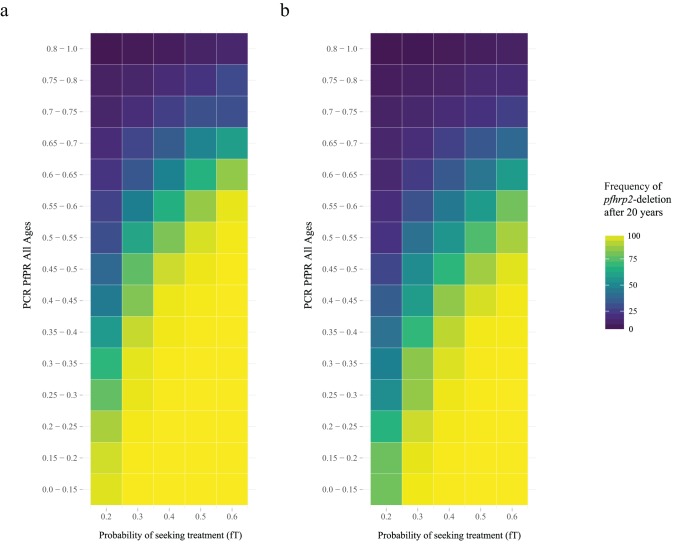
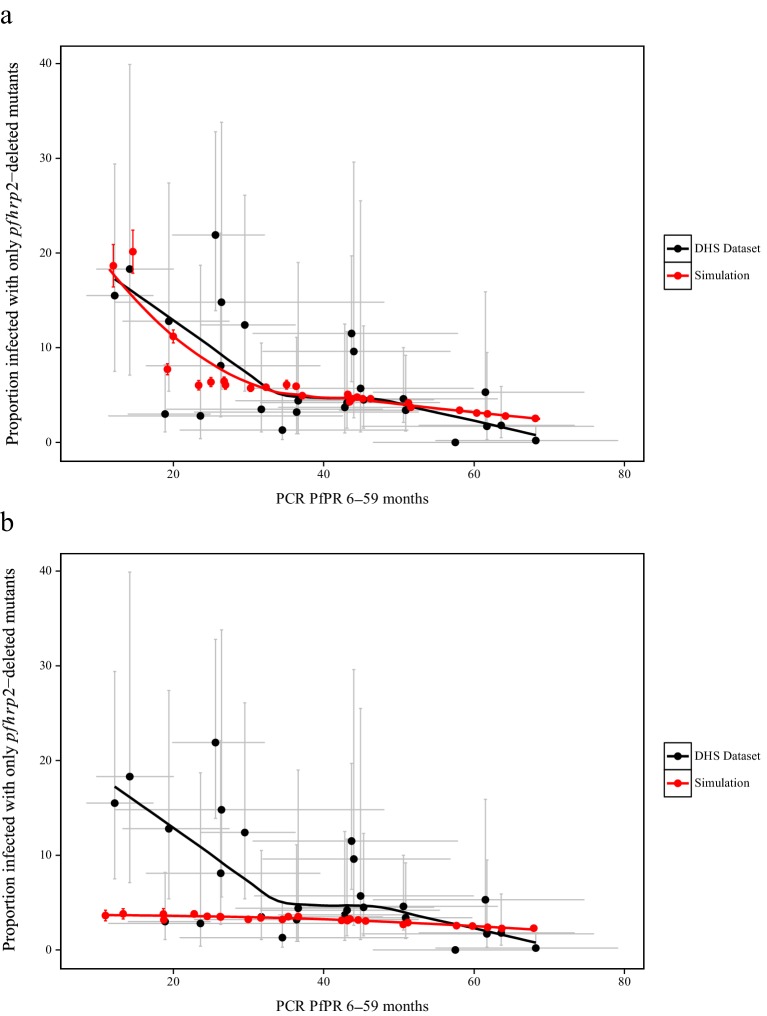
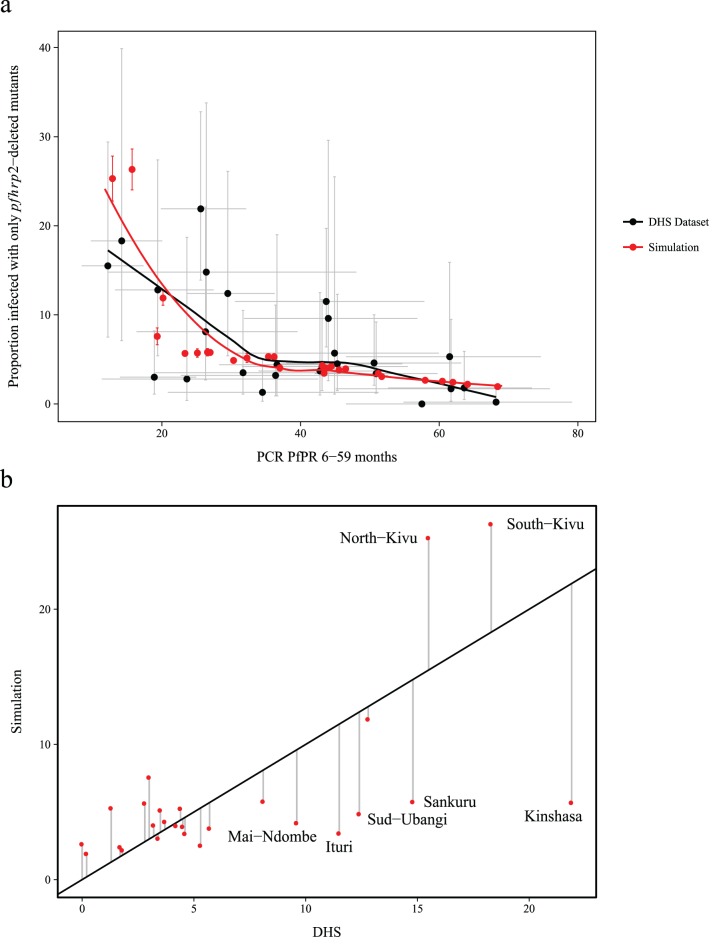
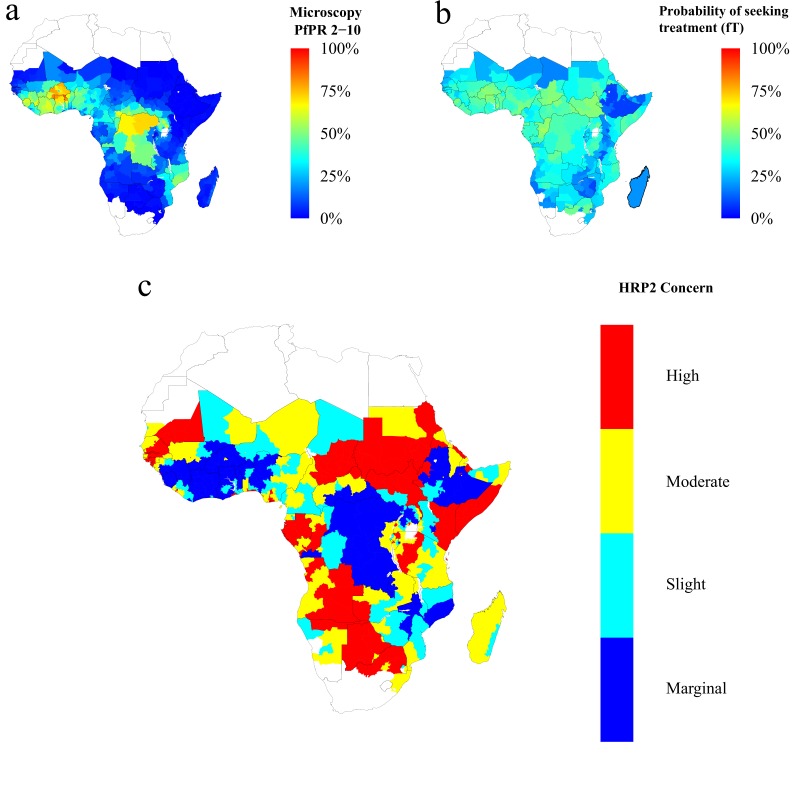
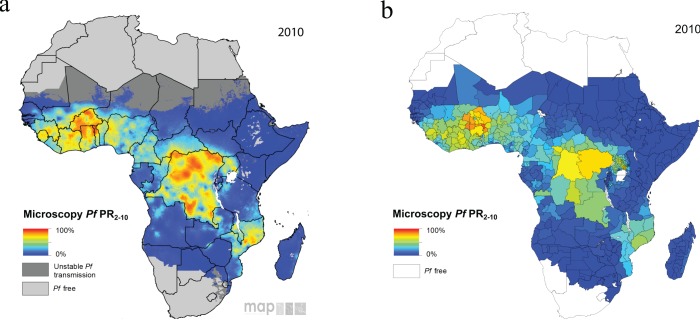
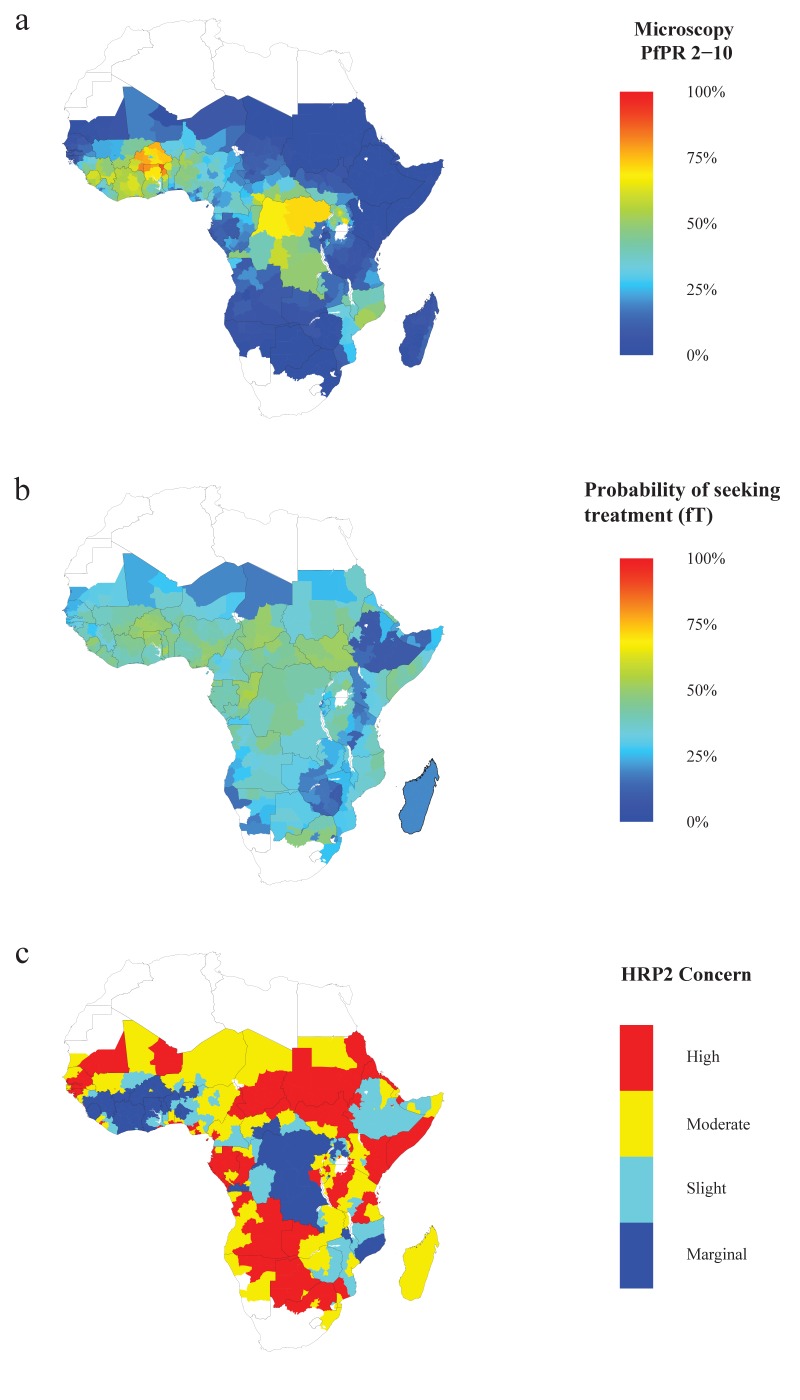
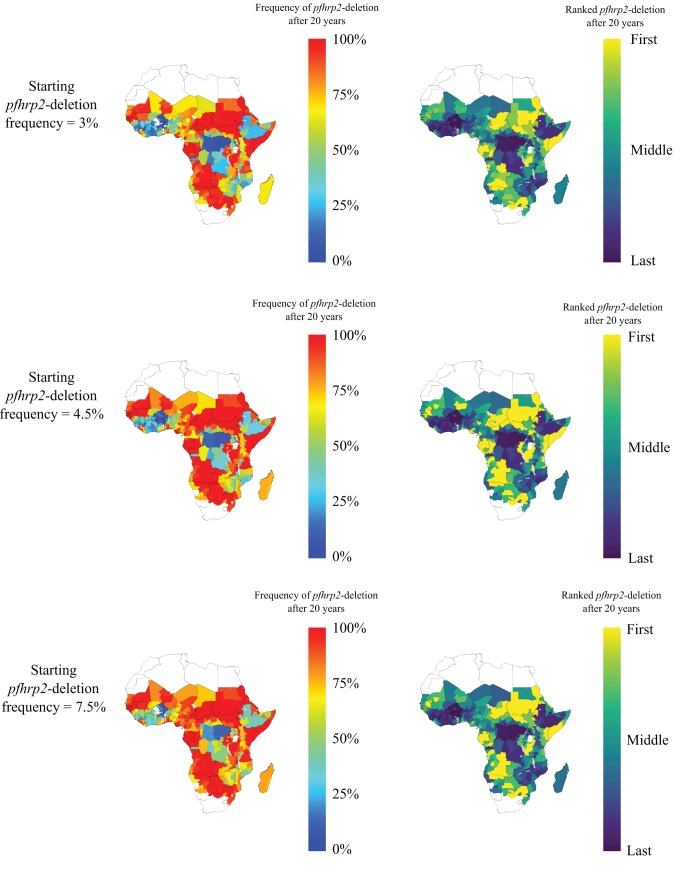
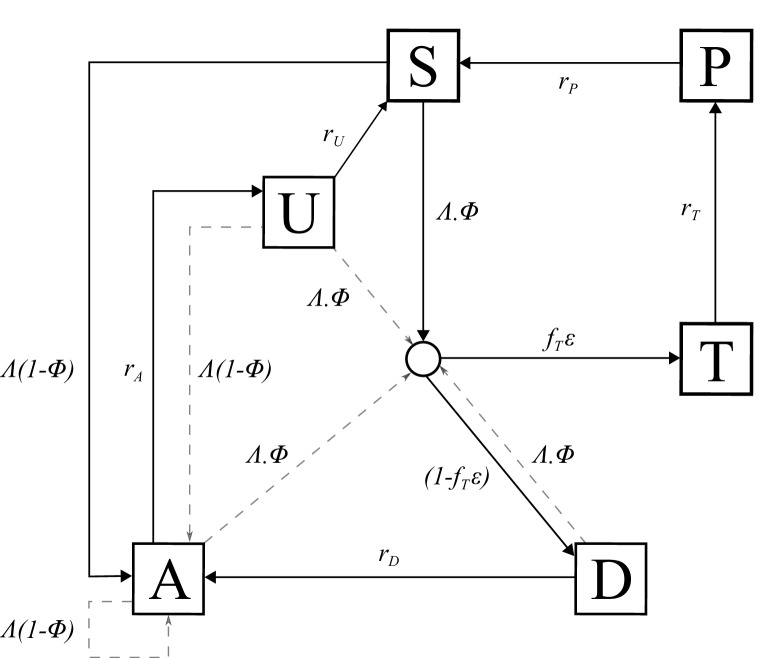
Rapid diagnostic tests (RDTs) have transformed malaria diagnosis. The most prevalent P. falciparum RDTs detect histidine-rich protein 2 (PfHRP2). However, pfhrp2 gene deletions yielding false-negative RDTs, first reported in South America in 2010, have been confirmed in Africa and Asia. We developed a mathematical model to explore the potential for RDT-led diagnosis to drive selection of pfhrp2-deleted parasites. Low malaria prevalence and high frequencies of people seeking treatment resulted in the greatest selection pressure. Calibrating our model against confirmed pfhrp2-deletions in the Democratic Republic of Congo, we estimate a starting frequency of 6% pfhrp2-deletion prior to RDT introduction. Furthermore, the patterns observed necessitate a degree of selection driven by the introduction of PfHRP2-based RDT-guided treatment. Combining this with parasite prevalence and treatment coverage estimates, we map the model-predicted spread of pfhrp2-deletion, and identify the geographic regions in which surveillance for pfhrp2-deletion should be prioritised.

Keywords: P. falciparum; epidemiology; global health; mapping; mathematical modelling; pfhrp2-deletion; rapid diagnostic tests.


Conflict of interest statement

No competing interests declared.

Figures

Figure 1.
Figure 1.. Predicted increase in pfhrp2-deletion upon RDT introduction after 10 years.
Graphs show the time course of pfhrp2-deletion emergence under (a) different transmission intensities (10%, 25% and 60% PfPR) and 8% starting frequency of pfhrp2-deletion prior to RDT introduction and under (b) different assumed starting frequencies of pfhrp2-deletion prior to RDT introduction (2%, 8% and 12% starting frequency) and 25% PfPR. Five years after RDT introduction, the proportion of strains that are pfhrp2-deleted (c), and the proportion of the population that are infected with only pfhrp2-deleted mutants (d) is recorded. The dark grey dots denote individual simulation runs with a LOESS regression fit shown in blue. Source data for Figure 1 is provided within Figure 1—source data 1.
Figure 1—figure supplement 1.
Figure 1—figure supplement 1.. Impact of increase pfhrp2-deletion upon malaria prevalence.
Graphs show the increase in malaria prevalence over time as a result of increasing pfhrp2-deletion upon using only HRP2-based RDTs to guide treatment decisions, with the greatest increase in prevalence observed at the lowest starting prevalence.
Figure 1—figure supplement 2.
Figure 1—figure supplement 2.. Impact of pfhrp2-deletion fitness cost.
Graphs show the mean time course of pfhrp2-deletion emergence under different assumptions concerning the negative impact of pfhrp2-deletion. The fitness cost is incorporated by comparatively reducing the contribution to the human infectious reservoir made by the deletion strains in order to represent an assumed decrease in parasitaemia. The fitness cost is only implemented at the time of RDT introduction to illustrate the sum effect of the opposing selection pressures.
Figure 1—figure supplement 3.
Figure 1—figure supplement 3.. Impact of microscopy use and non-adherence to RDT results.
Graphs show the mean time course of pfhrp2-deletion emergence under different assumptions concerning the use of microscopy as an additional diagnostic and the impact of non-adherence to RDT test results, that is an individual receiving treatment despite yielding a negative RDT result. Microscopy use and nonadherence to RDT results are only implemented at the time of RDT introduction to illustrate the sum effect of the opposing selection pressures.
Figure 1—figure supplement 4.
Figure 1—figure supplement 4.. Impact of non-malarial fever.
Graphs show the mean time course of pfhrp2-deletion emergence under different assumptions concerning the rate of non-malarial fever (NMF). The introduction of non-malarial fevers increases the selection pressure in favour of pfhrp2-deletion, with 125% the observed rate of non-malarial fever yielding the quickest emergence of pfhrp2-deletion. Non-malarial fever is only implemented at the time of RDT introduction to illustrate the sum effect of the opposing selection pressures.
Figure 1—figure supplement 5.
Figure 1—figure supplement 5.. Combined impact of model assumptions.
Graphs show the mean time course of pfhrp2-deletion emergence under different assumptions concerning any negative fitness cost associated with pfhrp2-deletion, use of microscopy-based diagnosis, non-adherence to RDT results and non-malarial fever (NMF). These factors were explored at three different relative rates and compared to the method used within the main investigation (red line). An increase in pfhrp2-deletion is observed in all cases, with the method used within the main investigation exhibiting an increase in pfhrp2-deletion slightly slower than exhibited by the intermediate level of model assumptions (blue line).
Figure 2.
Figure 2.. The predicted rate at which the population is only infected with pfhrp2-deleted mutants.
The graphs show the time in years after RDT introduction at which 20% of the population are only infected with pfhrp2-deleted mutants up to a maximum follow-up time of 20 years post RDT introduction. PfHRP3 epitopes were assumed to cause a positive RDT result in (a) 0% or (b) 25% of individuals only infected with pfhrp2-deleted mutants. The plotted years represent the mean time grouped in each prevalence and treatment setting, with black dots representing where 20% was reached in less than five years. Each simulation had a starting pfhrp2-deletion frequency of 8% before RDT introduction. Source data for Figure 2 is provided within Figure 2—source data 1.
Figure 2—figure supplement 1.
Figure 2—figure supplement 1.. Frequency of pfhrp2-deletion after 20 years.
The graphs show the frequency of pfhrp2-deletion within the population 20 years after RDT introduction. PfHRP3 epitopes were assumed to cause a positive RDT result in (a) 0% or (b) 25% of individuals only infected with pfhrp2-deleted mutants. Each simulation had a starting pfhrp2 deletion frequency of 8% before RDT introduction.
Figure 3.
Figure 3.. Simulated province level burden of pfhrp2-deleted mutants within the DRC, with an assumed probability of a clinical case seeking treatment, who is only infected with pfhrp2-deleted mutants, producing a positive RDT result (ε) equal to 0.25.
In (a) the mean simulated proportion of children aged 6–59 months who are infected with only pfhrp2-deleted mutants is shown in red. Each region had an assumed starting frequency of 6% pfhrp2-deletion prior to RDT introduction in 2010 (2007 in North- and South-Kivu). The results in grey represent the recorded burden from the DHS survey (Figure 3—source data 1), with both datasets fitted with a LOESS regression. Error bars show the 95% confidence interval. In (b) the same simulation conditions were used as in (a) however it is assumed that no selection pressure is exerted by the introduction RDTs, i.e. ε = 1. Source data for Figure 3 is provided within Figure 3—source data 1.
Figure 3—figure supplement 1.
Figure 3—figure supplement 1.. Simulated province level burden of pfhrp2-deleted mutants within DRC, with an assumed probability of a clinical case seeking treatment, who is only infected with pfhrp2-deleted mutants, producing a positive RDT result (ε) equal to 0.
In (a) the mean simulated proportion of children aged 6–59 months who are infected with only pfhrp2-deleted mutants is shown in red. Each region had an assumed starting frequency of 4.5% pfhrp2-deletion prior to RDT introduction in 2010 (2007 in North- and South-Kivu). The results in grey represent the recorded burden from the DHS survey, with both datasets fitted with a LOESS regression. Error bars show the 95% confidence interval. In (b) the graph shows the plot of the residuals when comparing the simulation predicted proportion of children aged 6–59 months only infected with pfhrp2-deleted mutants to the recorded DHS data.
Figure 4.
Figure 4.. Predicted areas of HRP2 concern in comparison to recorded prevalence and treatment seeking rate, with an assumed probability of a clinical case seeking treatment, who is only infected with pfhrp2-deleted mutants, producing a positive RDT result (ε) equal to 0.25.
The graphs show (a) the recorded malaria prevalence in children aged 2–10 by microscopy in 2010, (b) the frequency of people seeking treatment in 2010 and (c) the predicted concern for the impact of pfhrp2-deleted mutants. In (c), high, moderate and slight risk represent >20% infection due to only pfhrp2-deleted mutants by 2016, 2022 and 2030 respectively, and marginal risk represents <20% by 2030. In 2010, each region was assumed to have a starting frequency of 6% pfhrp2-deletion. Source data for Figure 4 is provided within Figure 4—source data 1.
Figure 4—figure supplement 1.
Figure 4—figure supplement 1.. Model malaria prevalence output against Malaria Atlas Project prevalence 2010 (Bhatt et al., 2015).
The maps show the reported microscopy prevalence in children aged 2–10 from (a) the Malaria Atlas Project and (b) the presented model outputs at the first-administrative unit.
Figure 4—figure supplement 2.
Figure 4—figure supplement 2.. HRP2 Concern heat maps.
The graphs show the time after RDT introduction at which 20% of the population are only infected with pfhrp2-deleted mutants with an assumed probability of a clinical case seeking treatment, who is only infected with pfhrp2-deleted mutants, producing a positive RDT result (ε) equal to (a) 0.25 and (b) 0. Areas in grey represent simulation space in which, after 20 years, the proportion of 2–10 year olds only infected with pfhrp2-deleted mutants was less than 20%.
Figure 4—figure supplement 3.
Figure 4—figure supplement 3.. Predicted areas of HRP2 concern in comparison to recorded prevalence and treatment coverage with an assumed probability of a clinical case seeking treatment, who is only infected with pfhrp2-deleted mutants, producing a positive RDT result (ε) equal to 0.
The graphs show (a) the recorded malaria prevalence in children aged 2–10 in 2010, (b) the frequency of people seeking treatment in 2010 and (c) the predicted concern for the impact of pfhrp2-deleted mutants. In (c), high, moderate and slight risk represent >20% infection due to only pfhrp2-deleted mutants by 2016, 2022 and 2030 respectively, and marginal risk represents <20% by 2030. In 2010 each region was assumed to have a starting frequency of 4.5% pfhrp2-deletion.
Figure 4—figure supplement 4.
Figure 4—figure supplement 4.. Impact of different assumptions about starting frequency of pfhrp2-deletion upon the geographical pattern of selection-driven increase in pfhp2-deletion.
Three different starting frequencies of pfhrp2-deletion were explored, with an assumed probability of a clinical case seeking treatment, who is only infected with pfhrp2-deleted mutants, producing a positive RDT result (ε) equal to 0.25. The frequency of pfhrp2-deletion after 20 years was recorded and admin regions ranked accordingly, with the first rank representing the highest frequency of pfhrp2-deletion, and tied ranks being represented with the same colour.
Figure 4—figure supplement 5.
Figure 4—figure supplement 5.. Years in which RDTs were used at community level in Sub-Saharan Africa.
The map shows the year that RDTs were reported to be available at the community level within WHO malaria country profiles in 2012 (World Health Organization, 2012b). Countries in grey were not reported to use RDTs at the community level, or there was insufficient data.
Figure 5.
Figure 5.. Transmission Model.
Flow diagram for the human component of the transmission model, with dashed arrows indicating superinfection. S, susceptible; T, treated clinical disease; D, untreated clinical disease; P, prophylaxis; A, asymptomatic patent infection; U, asymptomatic sub-patent infection. All parameters are described within Table 2.

References

    1. Abdallah JF, Okoth S, Fontecha GA, Torres R, Banegas EI, Matute M, Bucheli S, Goldman IF, de Oliveira A, Barnwell JW, Udhayakumar V. Prevalence of pfhrp2 and pfhrp3 gene deletions in Puerto Lempira, Honduras. Malaria Journal. 2015;14:19. doi: 10.1186/s12936-014-0537-7. - DOI - PMC - PubMed
    1. Aguilée R, Claessen D, Lambert A. Allele fixation in a dynamic metapopulation: Founder effects vs refuge effects. Theoretical Population Biology. 2009;76:105–117. doi: 10.1016/j.tpb.2009.05.003. - DOI - PubMed
    1. Akinyi S, Hayden T, Gamboa D, Torres K, Bendezu J, Abdallah JF, Griffing SM, Quezada WM, Arrospide N, De Oliveira AM, Lucas C, Magill AJ, Bacon DJ, Barnwell JW, Udhayakumar V. Multiple genetic origins of histidine-rich protein 2 gene deletion in Plasmodium falciparum parasites from Peru. Scientific Reports. 2013;3:1–8. doi: 10.1038/srep02797. - DOI - PMC - PubMed
    1. Amoah LE, Abankwa J, Oppong A. Plasmodium falciparum histidine rich protein-2 diversity and the implications for PfHRP 2: based malaria rapid diagnostic tests in Ghana. Malaria Journal. 2016;15:1–8. doi: 10.1186/s12936-016-1159-z. - DOI - PMC - PubMed
    1. Baker J, Ho M-F, Pelecanos A, Gatton M, Chen N, Abdullah S, Albertini A, Ariey F, Barnwell J, Bell D, Cunningham J, Djalle D, Echeverry DF, Gamboa D, Hii J, Kyaw MP, Luchavez J, Membi C, Menard D, Murillo C, Nhem S, Ogutu B, Onyor P, Oyibo W, Wang SQ, McCarthy J, Cheng Q. Global sequence variation in the histidine-rich proteins 2 and 3 of Plasmodium falciparum: implications for the performance of malaria rapid diagnostic tests. Malaria Journal. 2010;9:129. doi: 10.1186/1475-2875-9-129. - DOI - PMC - PubMed

Publication types

MeSH terms