Comparative Study
. 2017 Dec;11(12):2848-2863.
doi: 10.1038/ismej.2017.139. Epub 2017 Aug 22.

Large-scale comparative metagenomics of Blastocystis, a common member of the human gut microbiome

Affiliations
Comparative Study

Large-scale comparative metagenomics of Blastocystis, a common member of the human gut microbiome

Francesco Beghini et al. ISME J. 2017 Dec.

Abstract

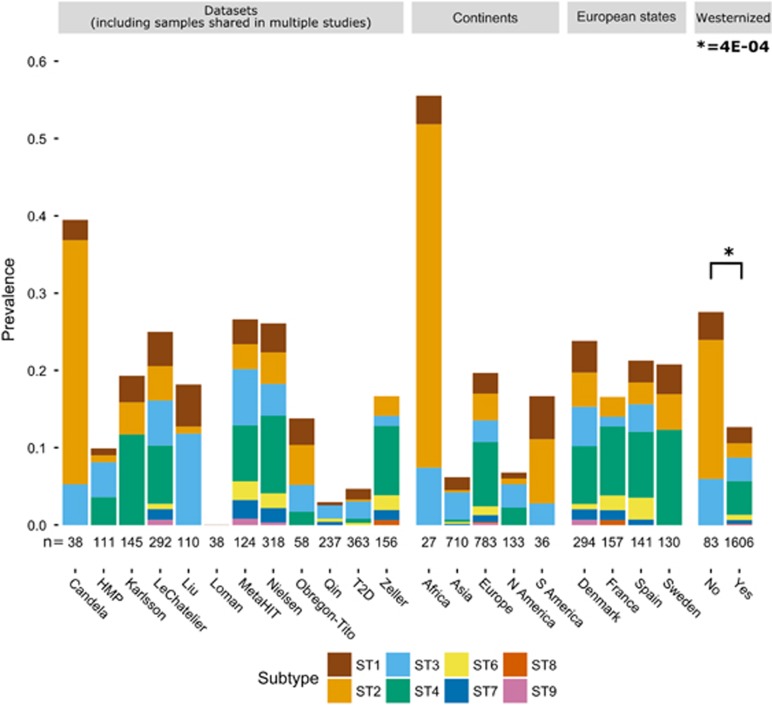
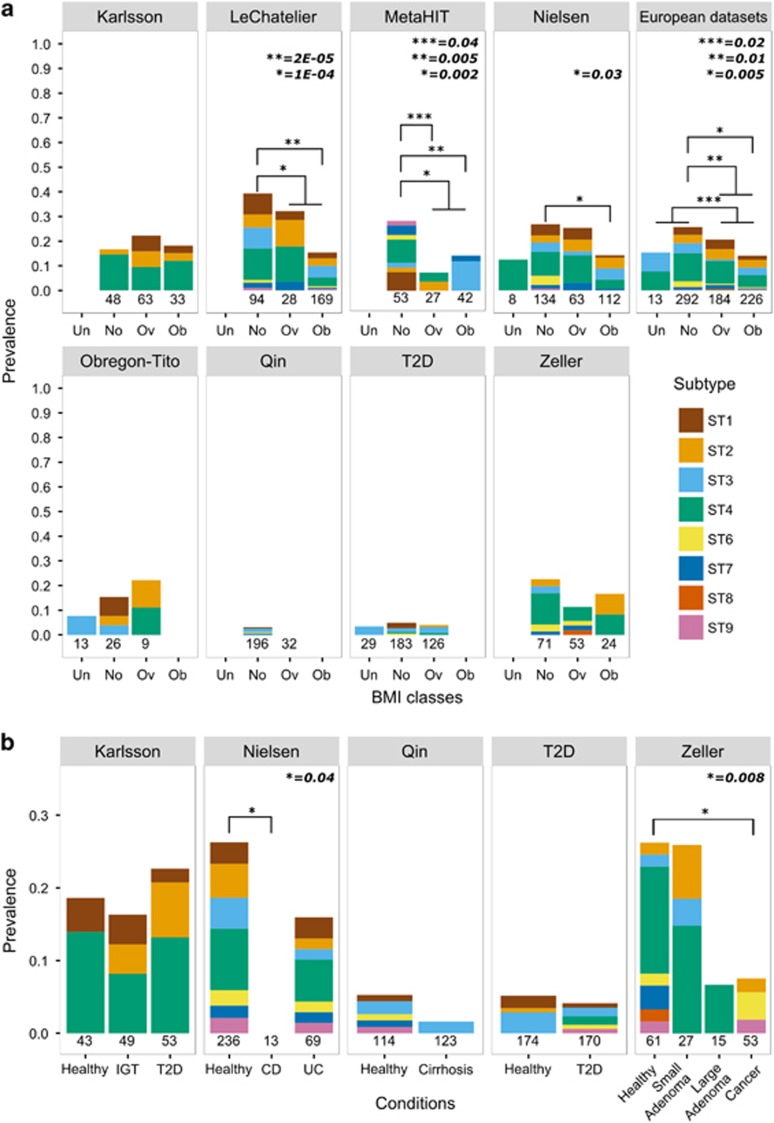
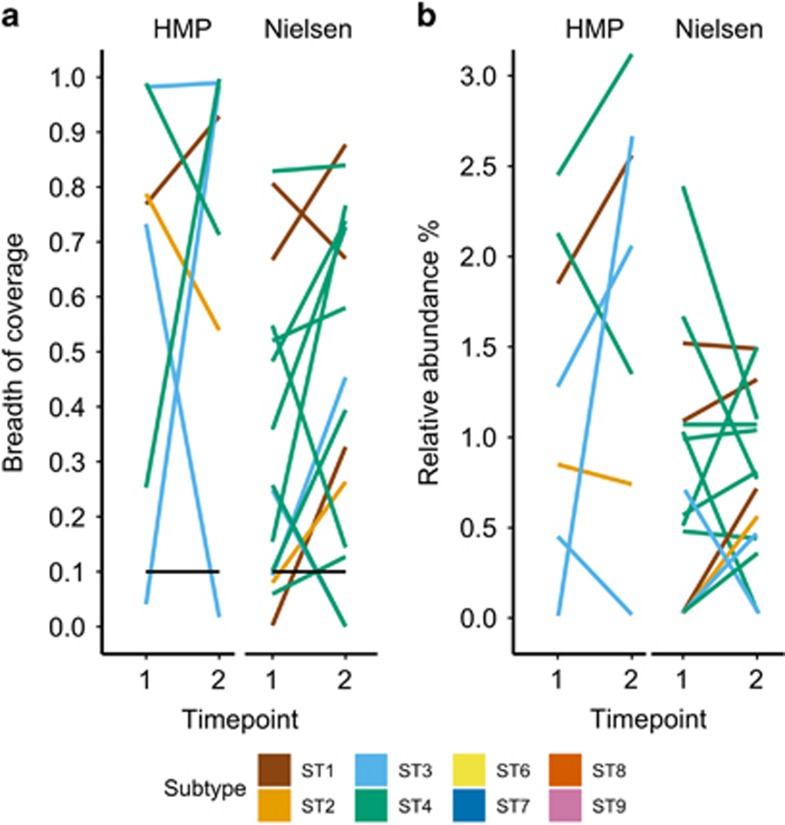
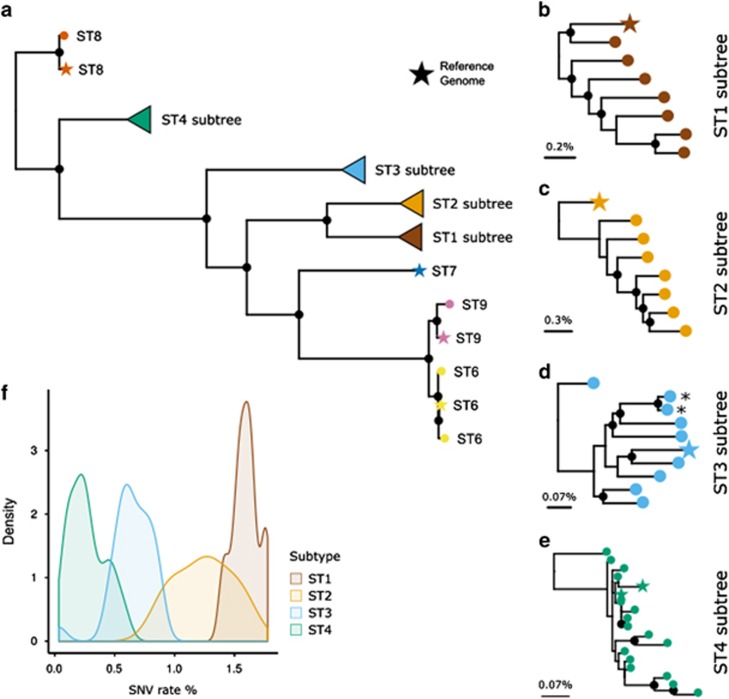
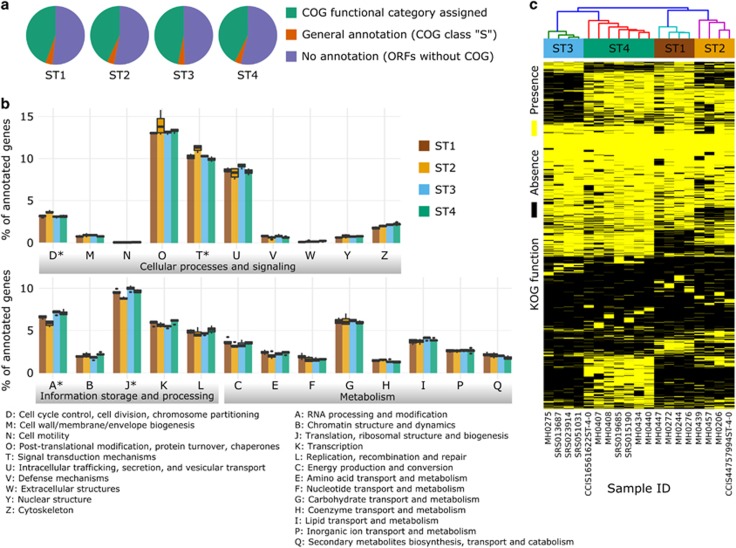
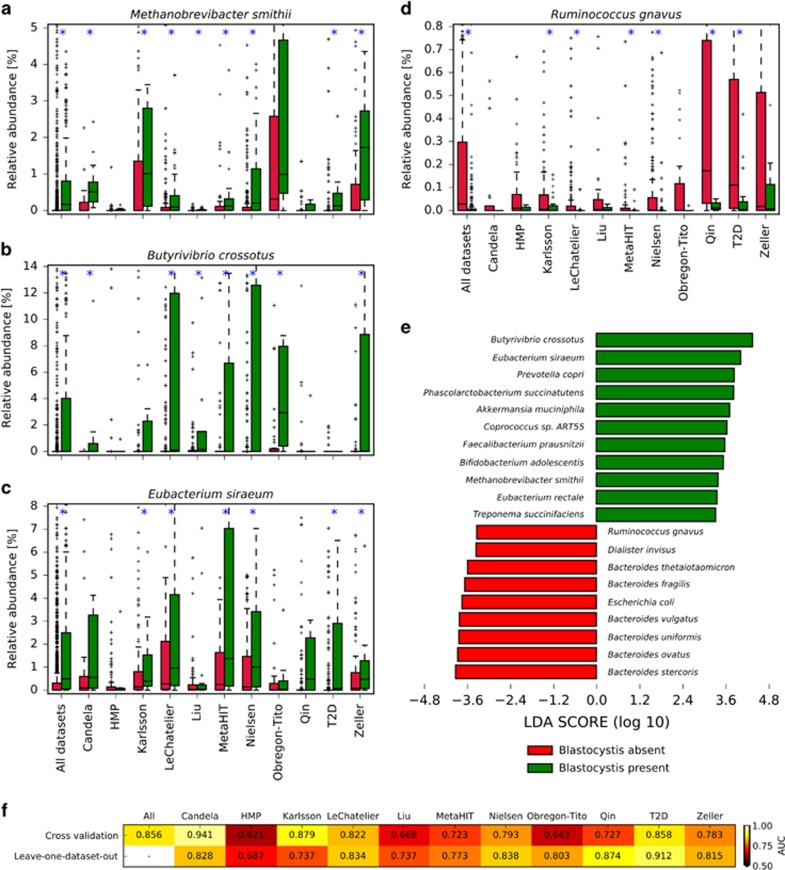
The influence of unicellular eukaryotic microorganisms on human gut health and disease is still largely unexplored. Blastocystis spp. commonly colonize the gut, but its clinical significance and ecological role are currently unsettled. We have developed a high-sensitivity bioinformatic pipeline to detect Blastocystis subtypes (STs) from shotgun metagenomics, and applied it to 12 large data sets, comprising 1689 subjects of different geographic origin, disease status and lifestyle. We confirmed and extended previous observations on the high prevalence the microrganism in the population (14.9%), its non-random and ST-specific distribution, and its ability to cause persistent (asymptomatic) colonization. These findings, along with the higher prevalence observed in non-westernized individuals, the lack of positive association with any of the disease considered, and decreased presence in individuals with dysbiosis associated with colorectal cancer and Crohn's disease, strongly suggest that Blastocystis is a component of the healthy gut microbiome. Further, we found an inverse association between body mass index and Blastocystis, and strong co-occurrence with archaeal organisms (Methanobrevibacter smithii) and several bacterial species. The association of specific microbial community structures with Blastocystis was confirmed by the high predictability (up to 0.91 area under the curve) of the microorganism colonization based on the species-level composition of the microbiome. Finally, we reconstructed and functionally profiled 43 new draft Blastocystis genomes and discovered a higher intra subtype variability of ST1 and ST2 compared with ST3 and ST4. Altogether, we provide an in-depth epidemiologic, ecological, and genomic analysis of Blastocystis, and show how metagenomics can be crucial to advance population genomics of human parasites.


Conflict of interest statement

The authors declare no conflict of interest.

Figures

Figure 1
Figure 1
Prevalence of Blastocystis and Blastocystis subtypes in the different data sets, different continents, different European states, and between westernized and non-westernized subjects (see Supplementary Table 2 for more details). Stacked barplots show the prevalence in each category; numbers below the bars refer to the number of samples in the corresponding category, where duplicates from the same subject are eventually discarded. Statistical significance was assessed by Fisher's exact test.
Figure 2
Figure 2
Blastocystis prevalence in BMI classes (a) and different health conditions (b) for the considered data sets. Barplots show the prevalence of Blastocystis in different health conditions reported in the analyzed data sets. BMI classes considered were underweight (Un), normal (No), overweight (Ov) and obese (Ob). The total number of samples in each class and data set is reported below the bars. Bars associated with a total number of samples less than four are not shown. Note that scales in panels A and B are different. Abbreviations: CD, Crohn’s disease; IGT, impaired glucose tolerance; T2D, type 2 diabetes; UC, ulcerative colitis. Fisher's exact test was used as statistical significance test.
Figure 3
Figure 3
Breadth of coverage (a) and relative abundance (b) of Blastocystis in subjects colonized over two timepoints (see Supplementary Table 3 for more details). In the breadth of coverage plots, samples below the threshold of detection are also indicated. The breadth of coverage represents the fraction of the reference genome covered by at least one metagenomic read. The relative abundance is estimated by dividing the number of reads mapped to the Blastocystis reference genome with the total number of reads in the sample.
Figure 4
Figure 4
Phylogenetic relation between the 9 available Blastocystis reference genomes and 43 newly reconstructed genome assemblies from metagenomes. From the overall phylogenetic tree (a) we also report the subtrees of the four subtypes with more than 3 genomes (be) and compare the sequence diversity they span (f). Maximum likelihood phylogenetic trees were inferred using concatenated aligned shared genomic regions identified in reference genomes and assemblies (see Materials and methods). The asterisk highlights samples acquired from the same subject at two different timepoints. Black filled circles denote bootstrap support greater than 80%. The scale bar represents the average SNV rate calculated on the pairwise alignment.
Figure 5
Figure 5
Functional annotation analysis of the 19 reconstructed genomes spanning four Blastocystis STs. Less than half of the genes predicted by MAKER (Cantarel et al., 2008) were assigned to known COG functional categories using the eggNOG (Huerta-Cepas et al., 2016) database (a, see Materials and methods). These annotated genes can be grouped into 23 broad COG categories (b) that are a variable fraction of the total annotated genes. The asterisks denote categories for which one-way ANOVA statistical test gave P<1E−04. Hierarchical clustering performed on the more specific KOG functions show that samples associated with the same ST cluster together (c).
Figure 6
Figure 6
The presence (or absence) of Blastocystis is associated with major differences in the intestinal microbiome. Some species are strongly associated with the presence (ac) or absence (d) of Blastocystis (plots for additional microbes are reported in Supplementary Figure 7). Boxplots report the distribution of abundances in samples with and without Blastocystis. Blue asterisks denote data sets where significant differences exist between the absence and presence of Blastocystis. LEfSe analysis (e) showed several other microorganisms statistically associated (α=0.05) with Blastocystis presence at high effect size (threshold at 3.3). Machine learning-based approach reveals that the microbiome signature is predictive for the presence of Blastocystis (f). This is valid not only when considering specific data sets with an unbiased cross-validation procedure, but also when predicting the presence of the parasite in a given data set considering only the samples from other independent studies (leave-one-data set-out approach).

References

    1. Alfellani Ma, Stensvold CR, Vidal-Lapiedra A, Onuoha ESU, Fagbenro-Beyioku AF, Clark CG. (2013. a). Variable geographic distribution of Blastocystis subtypes and its potential implications. Acta Trop 126: 11–18. - PubMed
    1. Alfellani Ma, Taner-Mulla D, Jacob AS, Imeede CA, Yoshikawa H, Stensvold CR et al. (2013. b). Genetic diversity of Blastocystis in livestock and zoo animals. Protist 164: 497–509. - PubMed
    1. Altschul SF, Gish W, Miller W, Myers EW, Lipman DJ. (1990). Basic local alignment search tool. J Mol Biol 215: 403–410. - PubMed
    1. Andersen LOB, Bonde I, Nielsen HB, Stensvold CR. (2015). A retrospective metagenomics approach to studying Blastocystis. FEMS Microbiol Ecol 91: fiv072. - PubMed
    1. Andersen LOB, Nielsen HV, Stensvold CR. (2013). Waiting for the human intestinal Eukaryotome. Int Soc Microb Ecol 7: 1253–1255. - PMC - PubMed

Publication types