. 2017 Aug 24;8(8):e3017.
doi: 10.1038/cddis.2017.395.

Microenvironment inflammatory infiltrate drives growth speed and outcome of hepatocellular carcinoma: a prospective clinical study

Affiliations

Microenvironment inflammatory infiltrate drives growth speed and outcome of hepatocellular carcinoma: a prospective clinical study

Rosina Critelli et al. Cell Death Dis. .

Abstract

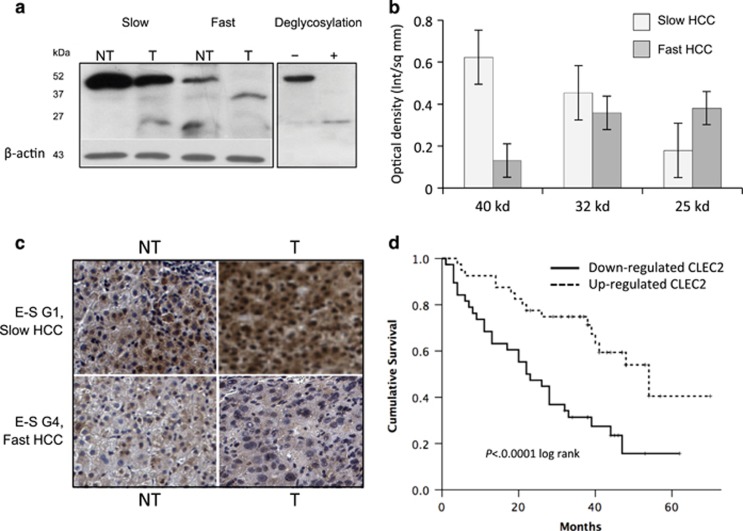
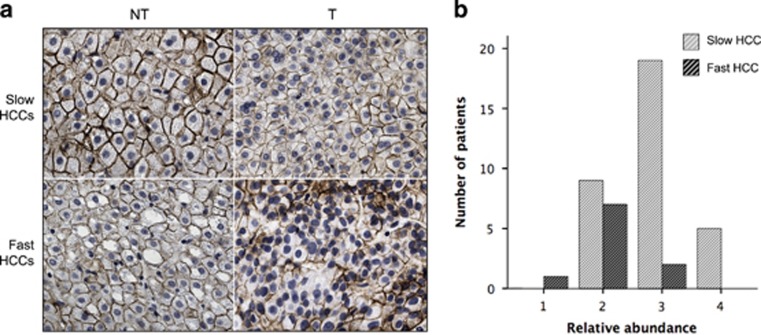
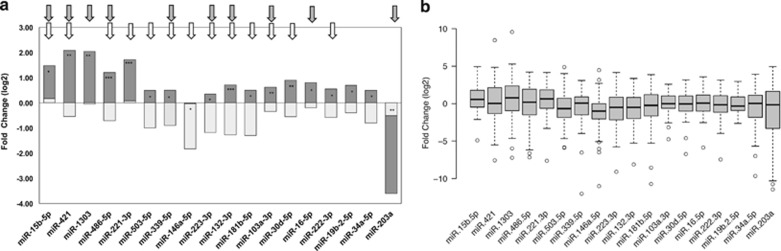
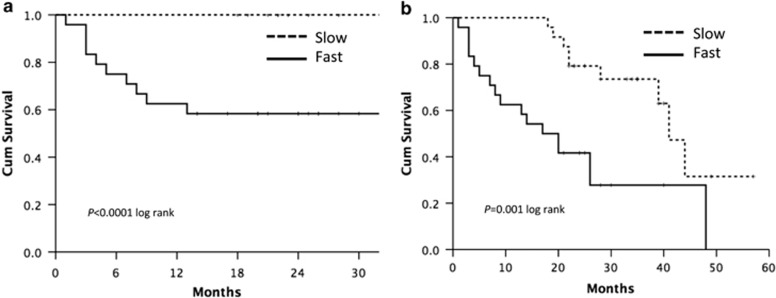
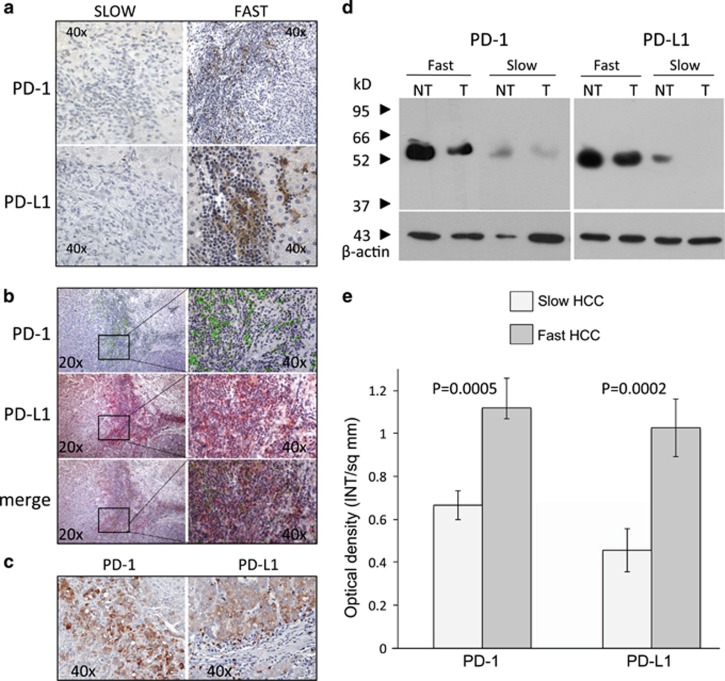
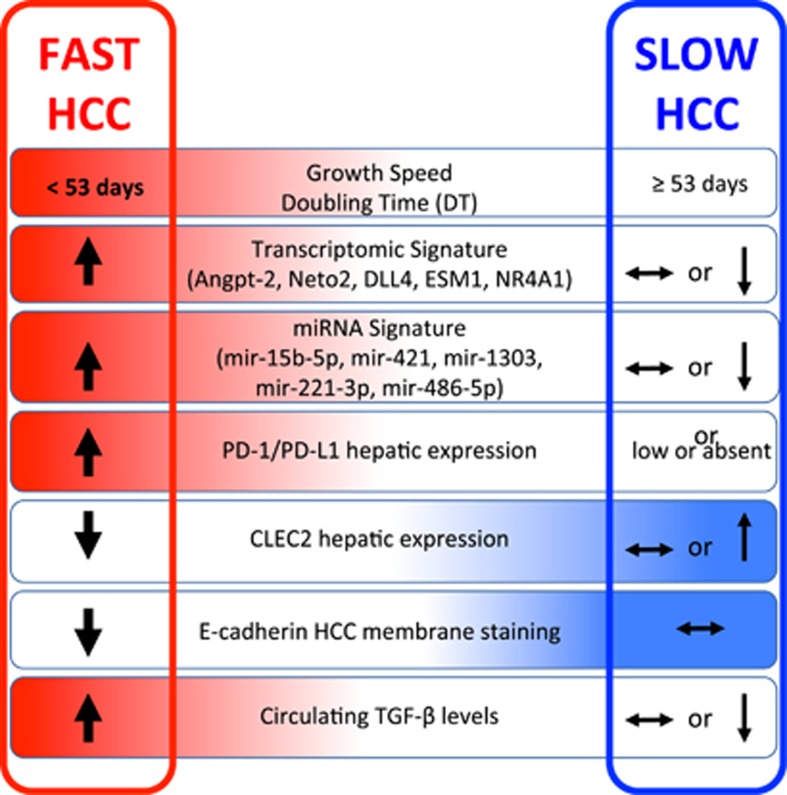
In HCC, tumor microenvironment, heavily influenced by the underlying chronic liver disease, etiology and stage of the tissue damage, affects tumor progression and determines the high heterogeneity of the tumor. Aim of this study was to identify the circulating and tissue components of the microenvironment immune-mediated response affecting the aggressiveness and the ensuing clinical outcome. We analyzed the baseline paired HCC and the surrounding tissue biopsies from a prospective cohort of 132 patients at the first diagnosis of HCC for immunolocalization of PD-1/PD-L1, FoxP3, E-cadherin, CLEC2 and for a panel of 82 microRNA associated with regulation of angiogenesis, cell proliferation, cell signaling, immune control and autophagy. Original microarray data were also explored. Serum samples were analyzed for a panel of 19 cytokines. Data were associated with biochemical data, histopathology and survival. Patients with a more aggressive disease and shorter survival, who we named fast-growing accordingly to the tumor doubling time, at presentation had significantly higher AFP levels, TGF-β1 and Cyphra 21-1 levels. Transcriptomic analysis evidenced a significant downregulation of CLEC2 and upregulation of several metalloproteinases. A marked local upregulation of both PD-1 and PD-L1, a concomitant FoxP3-positive lymphocytic infiltrate, a loss of E-cadherin, gain of epithelial-mesenchymal transition (EMT) phenotype and extreme poor differentiation at histology were also present. Upregulated microRNA in fast-growing HCCs are associated with TGF-β signaling, angiogenesis and inflammation. Our data show that fast HCCs are characterized not only by redundant neo-angiogenesis but also by unique features of distinctively immunosuppressed microenvironment, prominent EMT, and clear-cut activation of TGFβ1 signaling in a general background of long-standing and permanent inflammatory state.


Conflict of interest statement

The authors declare no conflict of interest.

Figures

Figure 1
Figure 1
(a) Representative WB analysis of CLEC2 in fast and slow and HCCs. Low molecular weight forms of the protein (∼32 and ∼ 25 kD) were mostly present in fast HCC, while full-length forms (∼40 kD) were more often present in slow HCCs. These lower bands are consistent with deglicosylated forms. (b) Distribution of different CLEC2 forms in fast and slow HCCs. Columns represent mean of optical density of different isoforms (40, 32 and 25 kD), normalized to β-actin, in slow and fast HCC subgroups (error bars: S.D.). On the whole, 20 patients (14 with slow tumors and six with fast tumors) were evaluated. (c) Immunohistochemical staining of CLEC2 in the liver shows marked downregulation of CLEC2 in fast, poorly differentiated HCCs, while slow HCCs displays significantly higher levels of expression. (d) Survival analysis by Kaplan–Meier shows significantly lower survival in HCC patients with downregulated CLEC2. E–S: Edmondson–Steiner
Figure 2
Figure 2
Immunohistochemical analysis of E-cadherin in slow and fast HCCs. (a) E-cadherin membrane localization was preserved in non-tumoral cirrhotic tissue and to a lesser extent in tumoral tissue in slow HCC. (b) The relative abundance of E-cadherin-positive cells was graded from 0 to 4 by counting with ImageJ software (http://rsbweb.nih.gov/) at least 100 tumor cells in areas of heterogeneous E-cadherin expression (0=less than 5% of positive cells; 1=5–25% 2=26–50% 3=51–75% and 4=76–100%). Forty-three patients were studied (33 with slow HCC, 10 with fast HCC) and the bars represent the number of patients with the different score. Data reported are from tumor tissue. In fast HCC, E-cadherin membrane expression was reduced in non-tumoral tissue and almost absent in tumoral tissue (P=0.014)
Figure 3
Figure 3
MicroRNA expression in fast and slow HCCs. (a) All microRNAs but 146a-5p and 203a were significantly overexpressed in fast HCCs (level of significance: *P<0.01; **P<0.001; ***P<0.0001). Arrows indicated the relationship of each miRNA with survival: white arrows: significantly associated with survival at 12 months gray arrows: significantly associated with survival at the end of follow-up. (b) MicroRNAs expression in all HCCs versus surrounding non-tumoral cirrhotic tissue, non stratified in fast and slow HCCs
Figure 4
Figure 4
Survival analysis by Kaplan–Meier: the five microRNA signature tested at presentation was able to predict survival both at 12 months (a) and at the end of follow-up (b)
Figure 5
Figure 5
(a) Immunohistochemical demonstration of PD-1 and PD-L1 in slow and fast HCCs. Fast HCCs display strong positivity, localized in the lymphocytic infiltrate. (b) PD-1- and PD-L1-positive cells co-localize in the areas of stronger lymphocytic infiltrate. (c) In fast HCC, both PD-1 and PD-L1 can be demonstrated in hepatocytes. (d) Western blot analysis confirms the higher level of positivity of fast HCCs in comparison with slow HCCs, which are weakly positive or negative in the tumor. (e) Semi-quantification of PD-1 and PD-L1 in tumor tissue of fast and slow HCCs. Columns represent mean of optical density, normalized to β-actin, of 20 patients (14 with slow tumors and six with fast tumors) (error bars: S.D.). PD-1 and PD-L1 levels were significantly different between slow and fast HCCs (P=0.0005 and P=0.0002, respectively)
Figure 6
Figure 6
A graphic abstract showing the major findings of this study. The distinctive features of fast and slow HCCs are depicted

References

    1. Hernandez-Gea V, Toffanin S, Friedman SL, Llovet JM. Role of the microenvironment in the pathogenesis and treatment of hepatocellular carcinoma. Gastroenterology 2013; 144: 512–527. - PMC - PubMed
    1. Giannelli G, Rani B, Dituri F, Cao Y, Palasciano G. Moving toward personalised therapy in patients with hepatocellular carcinoma: the role of the microenvironment. Gut 2014; 63: 1668–1676. - PubMed
    1. Tu T, Budzinska MA, Maczurek AE, Di Bartolomeo A, Warner FJ, McCaughan GW et al. Novel aspects of the liver microenvironment in hepatocellular carcinoma pathogenesis and development. Int J Mol Sci 2014; 15: 9422–9458. - PMC - PubMed
    1. Jeng KS, Chang CF, Jeng WJ, Sheen IS, Jeng CJ. Heterogeneity of hepatocellular carcinoma contributes to cancer progression. Crit Rev Oncol Hematol 2015; 94: 337–347. - PubMed
    1. Villa E, Critelli R, Lei B, Marzocchi G, Marzocchi G, Cammà C et al. Neoangiogenesis-related genes are hallmarks of fast-growing hepatocellular carcinomas and worst survival. Results from a prospective study. Gut 2016; 65: 861–869. - PubMed

Publication types