. 2017 Aug 24;12(8):e0182882.
doi: 10.1371/journal.pone.0182882. eCollection 2017.

Genetic architecture of atherosclerosis dissected by QTL analyses in three F2 intercrosses of apolipoprotein E-null mice on C57BL6/J, DBA/2J and 129S6/SvEvTac backgrounds

Affiliations

Genetic architecture of atherosclerosis dissected by QTL analyses in three F2 intercrosses of apolipoprotein E-null mice on C57BL6/J, DBA/2J and 129S6/SvEvTac backgrounds

Natalia Makhanova et al. PLoS One. .

Abstract

Quantitative trait locus (QTL) analyses of intercross populations between widely used mouse inbred strains provide a powerful approach for uncovering genetic factors that influence susceptibility to atherosclerosis. Epistatic interactions are common in complex phenotypes and depend on genetic backgrounds. To dissect genetic architecture of atherosclerosis, we analyzed F2 progeny from a cross between apolipoprotein E-null mice on DBA/2J (DBA-apoE) and C57BL/6J (B6-apoE) genetic backgrounds and compared the results with those from two previous F2 crosses of apolipoprotein E-null mice on 129S6/SvEvTac (129-apoE) and DBA-apoE backgrounds, and B6-apoE and 129-apoE backgrounds. In these round-robin crosses, in which each parental strain was crossed with two others, large-effect QTLs are expected to be detectable at least in two crosses. On the other hand, observation of QTLs in one cross only may indicate epistasis and/or absence of statistical power. For atherosclerosis at the aortic arch, Aath4 on chromosome (Chr)2:66 cM follows the first pattern, with significant QTL peaks in (DBAx129)F2 and (B6xDBA)F2 mice but not in (B6x129)F2 mice. We conclude that genetic variants unique to DBA/2J at Aath4 confer susceptibility to atherosclerosis at the aortic arch. A similar pattern was observed for Aath5 on chr10:35 cM, verifying that the variants unique to DBA/2J at this locus protect against arch plaque development. However, multiple loci, including Aath1 (Chr1:49 cM), and Aath2 (Chr1:70 cM) follow the second type of pattern, showing significant peaks in only one of the three crosses (B6-apoE x 129-apoE). As for atherosclerosis at aortic root, the majority of QTLs, including Ath29 (Chr9:33 cM), Ath44 (Chr1:68 cM) and Ath45 (Chr2:83 cM), was also inconsistent, being significant in only one of the three crosses. Only the QTL on Chr7:37 cM was consistently suggestive in two of the three crosses. Thus QTL analysis of round-robin crosses revealed the genetic architecture of atherosclerosis.


Conflict of interest statement

Competing Interests: The authors have declared that no competing interests exist.

Figures

Fig 1
Fig 1. LOD curves and allelic distribution of QTLs for arch plaque lesion.
(A) LOD curve for arch lesion size with sex as additive covariate in F2 mice from a cross B6-apoE x DBA-apoE. The horizontal dashed line represents a threshold for a suggestive (p = 0.63) QTL and a dotted line represents a threshold for a significant QTL (p = 0.05). The significance thresholds for LOD scores were determined by 1000 permutations using R/qtl software. (B) Allelic distribution of the QTL on Chr2 for plaque lesion size at the arch at the nearest marker to the peak in F2 mice from the cross B6-apoE x DBA-apoE. Data represent mean ± SE. Lesion size comparison was performed by one-way analysis of variance (ANOVA) (p<0.0001) followed by Tukey-Kramer’s HSD-test. **** p<0.0001 (C) Allelic distribution of QTL on Chr10 for plaque lesion size at the arch at the nearest marker to the peak in F2 mice from the cross B6-apoE x DBA-apoE. Data represent mean ± SE. Lesion size comparison was performed by one-way analysis of variance (ANOVA) (p<0.001) followed by Tukey-Kramer’s HSD-test. p = 0.06 between B6/B6 and DBA/DBA genotypes, **** p<0.0001 between B6/B6 and B6/DBA genotypes (D) Allelic distribution of the main effect QTL for plaque lesion size at the arch in Chr 4 and Chr 6 in both sexes in F2 mice from the cross B6-apoE x DBA-apoE. Data represent mean ±SE. Only mice homozygous for B6 allele at both Chr4 and Chr6 have increased plaque size by one-way ANOVA (p = 0.001), followed by Tukey-Kramer’s HSD-test: * p<0.05- B6/B6 genotype vs DBA/DBA genotype, ### p<0.001- B6/B6 genotype vs B6/DBA genotype.
Fig 2
Fig 2. LOD curves and allelic distribution of QTLs for plaque lesion at arch.
(A-C) LOD curves of QTL for plaque lesion size at arch in sex-combined scan with sex as additive covariate of a cross between B6-apoE and DBA-apoE (red lines), a cross between B6-apoE and 129-apoE mice (black lines) and a cross between DBA-apoE and 129-apoE mice (blue lines) on chromosome Chr2 (A), Chr10 (B) and Chr1 (C). The horizontal dashed and dotted lines represent thresholds for suggestive QTL (p = 0.63) and significant QTL (p = 0.05) determined in single locus scan of the cross between B6-apoE x DBA-apoE mice. The significance thresholds for LOD scores were determined by 1000 permutations using R/qtl software. (D) Allelic distribution of the QTLs for plaque lesion sizes at arch at the nearest marker to the peaks in Chr1 and Chr14 in both sexes in the cross between B6-apoE and 129-apoE mice. Data represent mean ± SE. Comparison of lesion sizes were done by one-way analysis of variance (ANOVA), followed by Tukey-Kramer’s HSD-test. Only mice homozygous for 129 allele at both Chr1 and Chr14 have significantly larger plaques compared to those with other combinations of the loci by one-way ANOVA (p = 0.001), followed by Tukey-Kramer’s HSD-test: *** p<0.001–129/129 genotype vs B6/B6 genotype, ## p<0.01–129/129 vs 129/B6 genotype genotype. **** p<0.0001–129/129 genotype vs B6/B6 genotype, #### p<0.0001–129/129 genotype vs B6/129 genotype; (E) Allelic distribution of the QTLs for plaque lesion sizes at arch at the nearest marker to the peaks in Chr1 and Chr8 in both sexes in the cross between B6-apoE and 129-apoE mice. If Chr8:13 cM is homozygous for the 129 allele, genotype effects were not present, but that if at least one allele of Chr8;13cM derived from B6, a strong effect of genotypes is revealed. Data represent mean ± SE. Comparison of lesion sizes were done by one-way analysis of variance (ANOVA), followed by Tukey-Kramer’s HSD-test. * p<0.05–129/129 genotype vs B6/B6 genotype; # p<0.05–129/129 genotype vs B6/129 genotype, **** p<0.0001–129/129 genotype vs B6/B6 genotype; #### p<0.0001–129/129 genotype vs B6/129 genotype; § p<0.05- B6/B6 genotype vs B6/129 genotype. (F) Allelic distribution of the QTLs for plaque lesion sizes at arch at the nearest marker to the peaks Chr10 and Chr12 in both sexes in the cross between B6-apoE and 129-apoE mice. Data represent mean ± SE. 129 allele of the Chr12 has significant protective effect only when Chr10 is homozygous for B6 allele Comparison of lesion sizes were done by one-way analysis of variance (ANOVA), followed by Tukey-Kramer’s HSD-test. * p<0.05- B6/B6 genotype vs 129/129 genotype; # p<0.05- B6/B6 genotype vs B6/129 genotype; **p<0.01- B6/B6 genotype vs 129/129 genotype; ## p<0.01- B6/B6 genotype vs B6/129 genotype.
Fig 3
Fig 3. LOD curves and allelic effect of QTL for root plaque size.
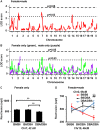
(A) LOD curve for root lesion size with sex as additive covariate in F2 mice from a cross B6-apoE X DBA-apoE. The horizontal dashed and dotted lines represent thresholds for suggestive (p = 0.63) and significant (p = 0.05) QTLs. The significance thresholds for LOD scores were determined by 1000 permutations using R/qtl software. (B) A LOD curve for root lesion size in female-only (green) and male-only (purple) scans in F2 mice from cross B6-apoE X DBA-apoE. The horizontal dashed and dotted lines represent thresholds for suggestive (p = 0.63) and significant (p = 0.05) QTLs. The significance thresholds for LOD scores were determined by 1000 permutations using R/qtl software. (C) Allelic distribution of the main QTLs for plaque lesion size at root at the nearest marker to the peak at Chr 7 in female F2 mice from a cross B6-apoE X DBA-apoE. Data represent mean ±SE. Comparison of lesion sizes were done by one-way analysis of variance (ANOVA) (p<0.01) followed by Tukey-Kramer’s HSD-test, **p<0.01 (D) Allelic distribution of the main effect QTLs for plaque size (μm2) subjected to square root transformation (sqrt) at the root in Chr 4 and Chr 6 in both sexes in F2 mice from cross B6-apoE X DBA-apoE. Data represent mean ±SE. Comparison of lesion sizes were done by one-way analysis of variance (ANOVA), followed by Tukey-Kramer’s HSD-test. *** p = 0.001- B6/B6 genotype vs DBA/DBA genotype; # p<0.05- B6/B6 genotype vs B6/DBA genotype, ## p<0.01- B6/B6 genotype vs B6/DBA genotype.
Fig 4
Fig 4. LOD curves of QTLs for plaque lesion size at root.
(A-D) LOD curves of QTL for plaque lesion size at root in sex-combined (A,B, C) scans on Chr1 (A), Chr9 (B), Chr2 (C) and female-only (D) scan on Chr7 (D) cross between B6-apoE and DBA-apoE (red lines), cross between B6-apoE and 129-apoE mice (black lines) and cross between DBA-apoE and 129-apoE mice (blue lines). The horizontal dashed and dotted lines represent thresholds for suggestive QTL (p = 0.63) and significant QTL (p = 0.05) determined in single locus scan of crosses between B6-apoE x DBA-apoE mice. The significance thresholds for LOD scores were determined by 1000 permutations using R/qtl software.

Similar articles

Cited by

References

    1. Kessler T, Vilne B, Schunkert H. The impact of genome-wide association studies on the pathophysiology and therapy of cardiovascular disease. EMBO Mol Med. 2016;8(7): 688–701. doi: 10.15252/emmm.201506174 - DOI - PMC - PubMed
    1. Wang X, Ishimori N, Korstanje R, Rollins J, Paigen B. Identifying novel genes for atherosclerosis through mouse-human comparative genetics. Am J Hum Genet. 2005;77: 1–15. doi: 10.1086/431656 - DOI - PMC - PubMed
    1. Maeda N, Johnson L, Kim S, Hagaman J, Friedman M, Reddick R. Anatomical differences and atherosclerosis in apolipoprotein E-deficient mice with 129/SvEv and C57BL/6 genetic backgrounds. Atherosclerosis. 2007;195: 75–82. doi: 10.1016/j.atherosclerosis.2006.12.006 - DOI - PMC - PubMed
    1. Kayashima Y, Tomita H, Zhilicheva S, Kim S, Kim HS, Bennett BJ, et al. Quantitative trait loci affecting atherosclerosis at the aortic root identified in an intercross between DBA2J and 129S6 apolipoprotein E-null mice. PLoS One. 2014;9: e88274 doi: 10.1371/journal.pone.0088274 - DOI - PMC - PubMed
    1. Tomita H, Zhilicheva S, Kim S, Maeda N. Aortic arch curvature and atherosclerosis have overlapping quantitative trait loci in a cross between 129S6/SvEvTac and C57BL/6J apolipoprotein E-null mice. Circ Res. 2010;106: 1052–1060. doi: 10.1161/CIRCRESAHA.109.207175 - DOI - PMC - PubMed