. 2017 Aug 24;12(8):e0183757.
doi: 10.1371/journal.pone.0183757. eCollection 2017.

Green fluorescent genetically encoded calcium indicator based on calmodulin/M13-peptide from fungi

Affiliations

Green fluorescent genetically encoded calcium indicator based on calmodulin/M13-peptide from fungi

Natalia V Barykina et al. PLoS One. .

Abstract

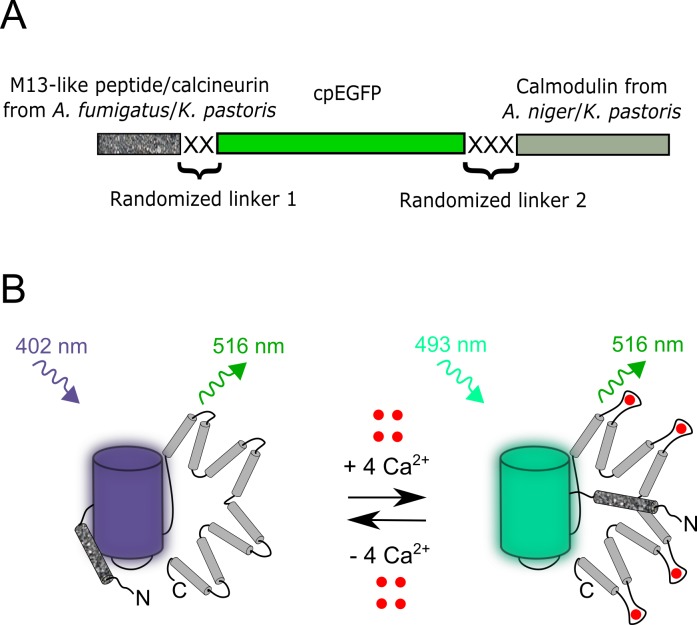
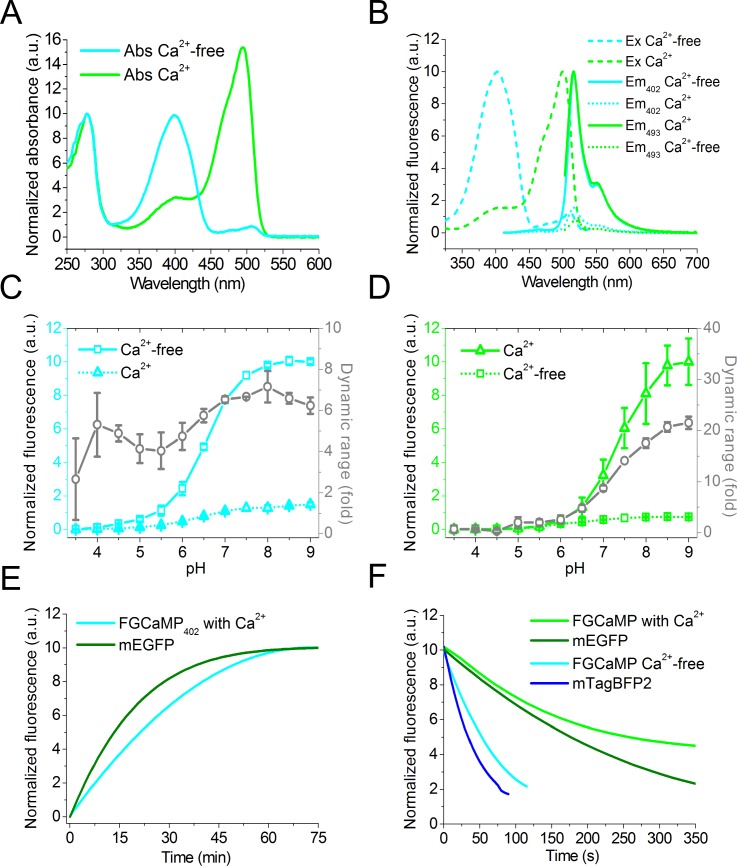
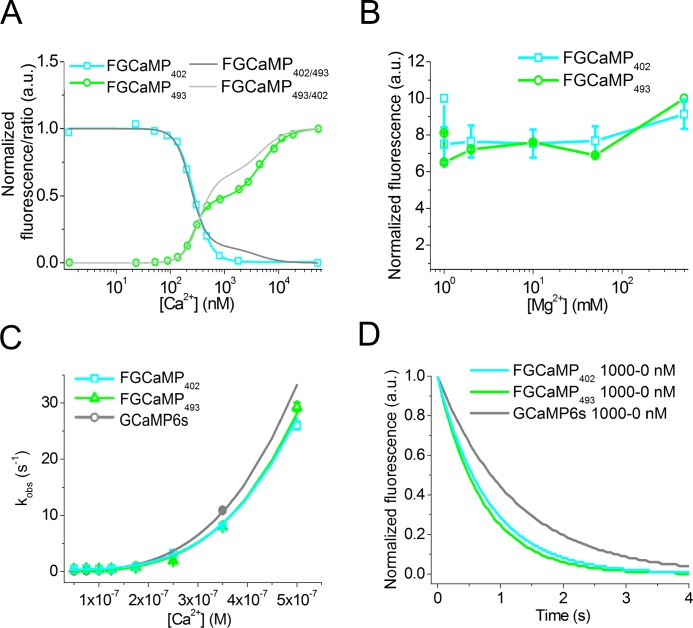
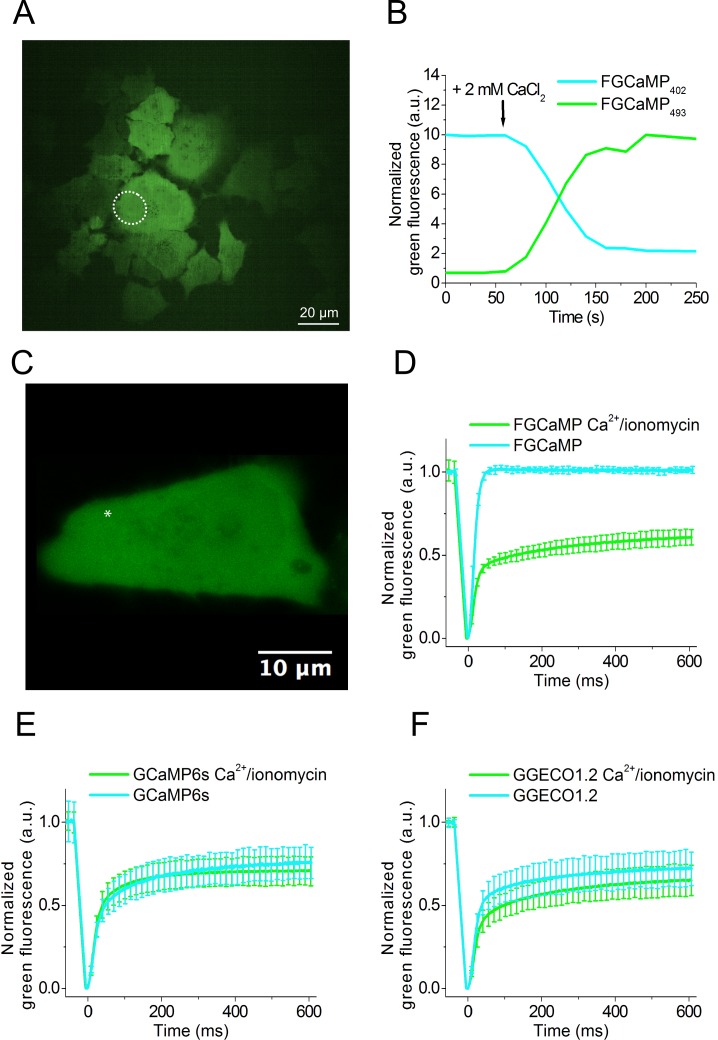
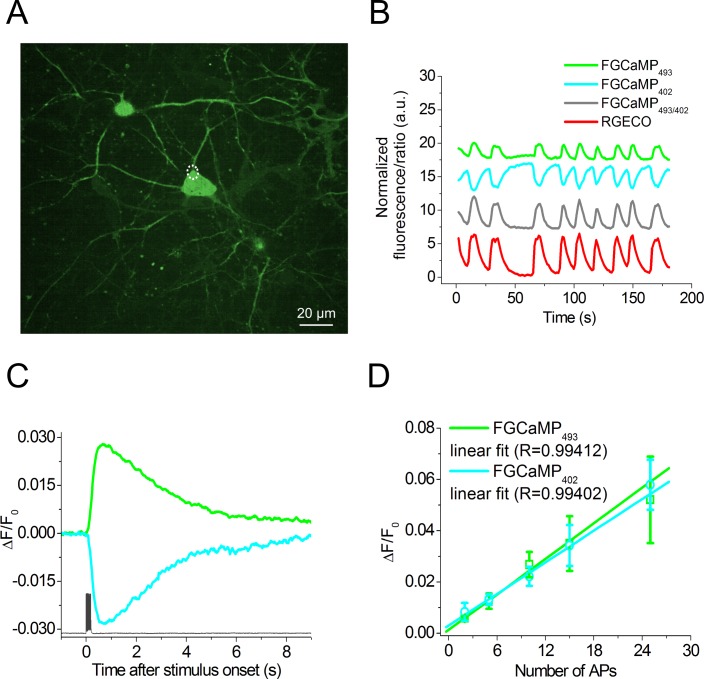
Currently available genetically encoded calcium indicators (GECIs) utilize calmodulins (CaMs) or troponin C from metazoa such as mammals, birds, and teleosts, as calcium-binding domains. The amino acid sequences of the metazoan calcium-binding domains are highly conserved, which may limit the range of the GECI key parameters and cause undesired interactions with the intracellular environment in mammalian cells. Here we have used fungi, evolutionary distinct organisms, to derive CaM and its binding partner domains and design new GECI with improved properties. We applied iterative rounds of molecular evolution to develop FGCaMP, a novel green calcium indicator. It includes the circularly permuted version of the enhanced green fluorescent protein (EGFP) sandwiched between the fungal CaM and a fragment of CaM-dependent kinase. FGCaMP is an excitation-ratiometric indicator that has a positive and an inverted fluorescence response to calcium ions when excited at 488 and 405 nm, respectively. Compared with the GCaMP6s indicator in vitro, FGCaMP has a similar brightness at 488 nm excitation, 7-fold higher brightness at 405 nm excitation, and 1.3-fold faster calcium ion dissociation kinetics. Using site-directed mutagenesis, we generated variants of FGCaMP with improved binding affinity to calcium ions and increased the magnitude of FGCaMP fluorescence response to low calcium ion concentrations. Using FGCaMP, we have successfully visualized calcium transients in cultured mammalian cells. In contrast to the limited mobility of GCaMP6s and G-GECO1.2 indicators, FGCaMP exhibits practically 100% molecular mobility at physiological concentrations of calcium ion in mammalian cells, as determined by photobleaching experiments with fluorescence recovery. We have successfully monitored the calcium dynamics during spontaneous activity of neuronal cultures using FGCaMP and utilized whole-cell patch clamp recordings to further characterize its behavior in neurons. Finally, we used FGCaMP in vivo to perform structural and functional imaging of zebrafish using wide-field, confocal, and light-sheet microscopy.


Conflict of interest statement

Competing Interests: The authors have declared that no competing interests exist.

Figures

Fig 1
Fig 1. Schematic representation of the composition of the original libraries and suggested stages of the FGCaMP calcium indicator function.
(A) The designed original libraries for calcium indicators consisted of M13-like peptide or calcineurin from A. fumigatus or K. pastoris and CaM from A. niger or K. pastoris as a sensory part and cpEGFP as a fluorescent part, with randomized linkers located between sensory and fluorescent components. (B) Schematic representation of the FGCaMP indicator function. The cpEGFP component is shown as blue and cyan cylinders according to the excitation wavelengths; CaM and M13-like peptide are shown in light gray and speckled gray, respectively; Ca2+ ions are shown as red dots.
Fig 2
Fig 2. In vitro properties of the purified FGCaMP indicator.
(A, B) Absorbance (A), excitation and emission spectra (B) for FGCaMP in Ca2+-free and Ca2+-bound states. (C, D) Intensity and dynamic range for FGCaMP as a function of pH at 402 (C) and 490 nm excitation (D), respectively. The dynamic range (fold) at each pH value was measured as the ratio of FGCaMP fluorescence intensity in the absence of Ca2+ to that in the presence of Ca2+ at 402 nm excitation (C) and vice versa at 490 nm excitation (D). Error represents the standard deviation for the average of three records. (E) Maturation curves for mEGFP and FGCaMP in Ca2+-bound state at 402 nm excitation. (F) Photobleaching curves for FGCaMP in Ca2+-free state (at 355 nm excitation), in Ca2+-bound state (at 470 nm excitation), mEGFP, and mTagBFP2.
Fig 3
Fig 3. Kd and Ca2+-binding kinetics of FGCaMP.
(A) Ca2+ titration curves for 402- and 493-forms of FGCaMP using 402 and 490 nm excitation light, respectively. Fluorescence changes were normalized to maximal and minimal values. Experimental data for 402- and 493-forms were fitted to Hill equation or double Hill equation y = V1*xn1/(Kd1n1+xn1) + V2*xn2/(Kd2n2+xn2), respectively. The value of 1 was added to normalized fluorescence changes for both forms and their ratio was calculated. (B) Magnesium titration curves for FGCaMP sensor. (C) Association kinetics. Observed Ca2+ association rate constants determined from stopped-flow experiments at low Ca2+ concentrations (in the range of 0–350 nM for GCaMP6s and 0–500 nM for FGCaMP) are overlaid with the fitted curves (kobs = kon x [Ca2+]n + koff). (D) Dissociation kinetics. Fluorescence changes were normalized to maximal and minimal values. Starting concentration was 1000 nM.
Fig 4
Fig 4. Response of FGCaMP to Ca2+ concentration changes in HeLa Kyoto cells and FRAP of FGCaMP and control GECIs at different Ca2+ concentrations in HeLa Kyoto cells.
(A) Confocal image of HeLa Kyoto cells expressing FGCaMP calcium sensor. (B) The graph illustrates changes in the green fluorescence of FGCaMP in HeLa Kyoto cells excited at 405 (cyan line) or 488 nm (green line) in response to the addition of 2 mM CaCl2 and 5 μM ionomycin. The changes correspond to the area indicated with white circles on the panel A. (C) Example of HeLa Kyoto cells expressing FGCaMP calcium sensor used for FRAP experiment. An example of FRAP area having a size of around 1 μm2 is indicated with a white asterisk. (D)-(F) The graphs illustrate FRAP induced changes in green fluorescence of FGCaMP and control GECIs at physiological Ca2+ concentrations and in response to the addition of 2 mM CaCl2 and 5 μM ionomycin. Error bars are standard deviations shown for each 20th dot on plots.
Fig 5
Fig 5. Response of FGCaMP to Ca2+ concentration variations as a result of spontaneous activity and to intracellularly induced APs in cultured neurons.
(A) Dissociated neuronal culture co-expressing FGCaMP and R-GECO calcium sensors. Red channel for R-GECO is not shown. (B) The graph illustrates changes in red fluorescence of R-GECO (red line, excitation 561 nm) and green fluorescence of FGCaMP for 402- (cyan line, excitation 405 nm) or 493-form (green line, excitation 488 nm) as a result of spontaneous activity in neuronal culture. The gray line represents the ratio between fluorescence intensities for FGCaMP in two channels with excitation at 488 and 405 nm, respectively. The graphs illustrate changes in fluorescence in the area indicated with a white circle. (C) Fluorescence changes in FGCaMP-expressing cells induced by the train of 10 APs (bottom) for 402- (cyan curve, excitation 400 nm) or 493-form (green line, excitation 470 nm). Ca2+ responses were averaged across all recorded neurons in different wells. An example of intracellular recording (dark gray) was taken from one cell. (D) Dependence of the amplitudes of responses induced by different numbers of APs in neurons expressing FGCaMP indicator recorded for 493- (green line, N = 7, excitation 470 nm) and 402-forms (cyan line, N = 7, excitation 400 nm). Note that in the range of 2 to 25 APs, the dependence is linear for both excitation wavelengths. Values are shown as the means ± SEM.
Fig 6
Fig 6. Calcium imaging of neurons expressing FGCaMP in zebrafish larva at 4 days post fertilization.
(A) Overlay of confocal fluorescence images of neurons expressing FGCaMP, acquired with 488 and 405 nm excitation and 525/50BP emission. White box indicates area zoomed-in in panel B. Scale bar, 100 μm. FB, forebrain; MB, midbrain; HB, hindbrain. (B) High magnification images of the neurons highlighted in the white box in panel A acquired with 488 nm excitation and 525/50BP emission (left; green pseudocolor) and 405 nm excitation and 525/50BP emission (middle; blue pseudocolor), and overlay of the left and middle images (right). Scale bar, 50 μm. (C) Representative single cell recording of GCaMP6f (top; magenta) and FGCaMP green fluorescence responses (bottom; green) during 4-aminopyridine induced neuronal activity (Ex: 475/34BP, Em: 527/50BP). Population data for (D) maximum fluorescence changes ΔF/F and (E) SNR corresponding to the experiment in panel C (26 neurons in 3 fish and 43 neurons from 5 fish for GCaMP6f and FGCaMP, respectively). Box plots with notches are used (narrow part of notch, median; top and bottom of the notch, 95% confidence interval for the median; top and bottom horizontal lines, 25% and 75% percentiles for the data; whiskers extend to 5th and 95th percentile for the data; horizontal bar is mean). (F) Representative single cell recording of FGCaMP green fluorescence excited with 488 and 405 nm laser illumination during 4-aminopyridine induced neuronal activity. (G) Fluorescence ratio for the traces shown in panel F. (H) Population data for fluorescence ratio for experiment in panel C (107 neurons in 2 fish). Box plots with notches are used (see panel D for description).

References

    1. Akerboom J, Rivera JD, Guilbe MM, Malave EC, Hernandez HH, Tian L, et al. (2009) Crystal structures of the GCaMP calcium sensor reveal the mechanism of fluorescence signal change and aid rational design. The Journal of biological chemistry 284: 6455–6464. doi: 10.1074/jbc.M807657200 - DOI - PMC - PubMed
    1. Wang Q, Shui B, Kotlikoff MI, Sondermann H (2008) Structural basis for calcium sensing by GCaMP2. Structure 16: 1817–1827. doi: 10.1016/j.str.2008.10.008 - DOI - PMC - PubMed
    1. Baird GS, Zacharias DA, Tsien RY (1999) Circular permutation and receptor insertion within green fluorescent proteins. Proceedings of the National Academy of Sciences of the United States of America 96: 11241–11246. - PMC - PubMed
    1. Griesbeck O, Baird GS, Campbell RE, Zacharias DA, Tsien RY (2001) Reducing the environmental sensitivity of yellow fluorescent protein. Mechanism and applications. The Journal of biological chemistry 276: 29188–29194. doi: 10.1074/jbc.M102815200 - DOI - PubMed
    1. Barykina NV, Subach OM, Doronin DA, Sotskov VP, Roshchina MA, Kunitsyna TA, et al. (2016) A new design for a green calcium indicator with a smaller size and a reduced number of calcium-binding sites. Scientific reports 6: 34447 doi: 10.1038/srep34447 - DOI - PMC - PubMed

LinkOut - more resources