Lissencephaly-1 dependent axonal retrograde transport of L1-type CAM Neuroglian in the adult drosophila central nervous system
- PMID: 28837701
- PMCID: PMC5570280
- DOI: 10.1371/journal.pone.0183605
Lissencephaly-1 dependent axonal retrograde transport of L1-type CAM Neuroglian in the adult drosophila central nervous system
Abstract
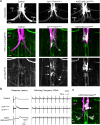
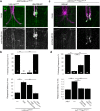
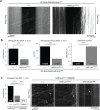
Here, we established the Drosophila Giant Fiber neurons (GF) as a novel model to study axonal trafficking of L1-type Cell Adhesion Molecules (CAM) Neuroglian (Nrg) in the adult CNS using live imaging. L1-type CAMs are well known for their importance in nervous system development and we previously demonstrated a role for Nrg in GF synapse formation. However, in the adult they have also been implicated in synaptic plasticity and regeneration. In addition, to its canonical role in organizing cytoskeletal elements at the plasma membrane, vertebrate L1CAM has also been shown to regulate transcription indirectly as well as directly via its import to the nucleus. Here, we intend to determine if the sole L1CAM homolog Nrg is retrogradley transported and thus has the potential to relay signals from the synapse to the soma. Live imaging of c-terminally tagged Nrg in the GF revealed that there are at least two populations of retrograde vesicles that differ in speed, and either move with consistent or varying velocity. To determine if endogenous Nrg is retrogradely transported, we inhibited two key regulators, Lissencephaly-1 (Lis1) and Dynactin, of the retrograde motor protein Dynein. Similar to previously described phenotypes for expression of poisonous subunits of Dynactin, we found that developmental knock down of Lis1 disrupted GF synaptic terminal growth and that Nrg vesicles accumulated inside the stunted terminals in both mutant backgrounds. Moreover, post mitotic Lis1 knock down in mature GFs by either RNAi or Clustered Regularly Interspaced Short Palindromic Repeats (CRISPR) induced mutations, resulted in normal length terminals with fully functional GF synapses which also exhibited severe accumulation of endogenous Nrg vesicles. Thus, our data suggests that accumulation of Nrg vesicles is due to failure of retrograde transport rather than a failure of terminal development. Together with the finding that post mitotic knock down of Lis1 also disrupted retrograde transport of tagged Nrg vesicles in GF axons, it demonstrates that endogenous Nrg protein is transported from the synapse to the soma in the adult central nervous system in a Lis1-dependent manner.
Conflict of interest statement
Figures


Similar articles
-
An ankyrin-binding motif regulates nuclear levels of L1-type neuroglian and expression of the oncogene Myc in Drosophila neurons.J Biol Chem. 2018 Nov 9;293(45):17442-17453. doi: 10.1074/jbc.RA118.004240. Epub 2018 Sep 26. J Biol Chem. 2018. PMID: 30257867 Free PMC article.
-
A Role for Drosophila Amyloid Precursor Protein in Retrograde Trafficking of L1-Type Cell Adhesion Molecule Neuroglian.Front Cell Neurosci. 2019 Jul 12;13:322. doi: 10.3389/fncel.2019.00322. eCollection 2019. Front Cell Neurosci. 2019. PMID: 31354437 Free PMC article.
-
A conserved role for Drosophila Neuroglian and human L1-CAM in central-synapse formation.Curr Biol. 2006 Jan 10;16(1):12-23. doi: 10.1016/j.cub.2005.11.062. Curr Biol. 2006. PMID: 16401420
-
FASt remodeling of synapses in Drosophila.Curr Opin Neurobiol. 2003 Oct;13(5):527-34. doi: 10.1016/j.conb.2003.09.008. Curr Opin Neurobiol. 2003. PMID: 14630214 Review.
-
The role of cell adhesion molecules in brain wiring and neuropsychiatric disorders.Mol Cell Neurosci. 2017 Jun;81:4-11. doi: 10.1016/j.mcn.2016.08.005. Epub 2016 Aug 22. Mol Cell Neurosci. 2017. PMID: 27561442 Review.
Cited by
-
Live Imaging of Axonal Transport in the Adult Drosophila Central Nervous System.Methods Mol Biol. 2022;2431:417-428. doi: 10.1007/978-1-0716-1990-2_22. Methods Mol Biol. 2022. PMID: 35412290
-
A new method of recording from the giant fiber of Drosophila melanogaster shows that the strength of its auditory inputs remains constant with age.PLoS One. 2020 Jan 7;15(1):e0224057. doi: 10.1371/journal.pone.0224057. eCollection 2020. PLoS One. 2020. PMID: 31910219 Free PMC article.
-
Lissencephaly-1 mutations enhance traumatic brain injury outcomes in Drosophila.Genetics. 2023 Mar 2;223(3):iyad008. doi: 10.1093/genetics/iyad008. Genetics. 2023. PMID: 36683334 Free PMC article.
-
An ankyrin-binding motif regulates nuclear levels of L1-type neuroglian and expression of the oncogene Myc in Drosophila neurons.J Biol Chem. 2018 Nov 9;293(45):17442-17453. doi: 10.1074/jbc.RA118.004240. Epub 2018 Sep 26. J Biol Chem. 2018. PMID: 30257867 Free PMC article.
-
Spatiotemporal Control of Neuronal Remodeling by Cell Adhesion Molecules: Insights From Drosophila.Front Neurosci. 2022 May 12;16:897706. doi: 10.3389/fnins.2022.897706. eCollection 2022. Front Neurosci. 2022. PMID: 35645712 Free PMC article. Review.
References
-
- Chen QY, Chen Q, Feng GY, Lindpaintner K, Chen Y, Sun X, et al. Case-control association study of the close homologue of L1 (CHL1) gene and schizophrenia in the Chinese population. Schizophrenia research. 2005;73(2–3):269–74. doi: 10.1016/j.schres.2004.06.001 . - DOI - PubMed
-
- Sakurai K, Migita O, Toru M, Arinami T. An association between a missense polymorphism in the close homologue of L1 (CHL1, CALL) gene and schizophrenia. Molecular psychiatry. 2002;7(4):412–5. doi: 10.1038/sj.mp.4000973 . - DOI - PubMed
-
- Poltorak M, Wright R, Hemperly JJ, Torrey EF, Issa F, Wyatt RJ, et al. Monozygotic twins discordant for schizophrenia are discordant for N-CAM and L1 in CSF. Brain research. 1997;751(1):152–4. . - PubMed
-
- Sakurai T. The role of NrCAM in neural development and disorders—beyond a simple glue in the brain. Molecular and cellular neurosciences. 49(3):351–63. doi: 10.1016/j.mcn.2011.12.002 . - DOI - PubMed
-
- Nikonenko AG, Sun M, Lepsveridze E, Apostolova I, Petrova I, Irintchev A, et al. Enhanced perisomatic inhibition and impaired long-term potentiation in the CA1 region of juvenile CHL1-deficient mice. The European journal of neuroscience. 2006;23(7):1839–52. doi: 10.1111/j.1460-9568.2006.04710.x . - DOI - PubMed
MeSH terms
Substances
Grants and funding
LinkOut - more resources
Full Text Sources
Other Literature Sources
Molecular Biology Databases
Miscellaneous

