. 2017 Nov:59:41-54.
doi: 10.1016/j.neurobiolaging.2017.07.008. Epub 2017 Jul 29.

Klotho regulates postnatal neurogenesis and protects against age-related spatial memory loss

Affiliations

Klotho regulates postnatal neurogenesis and protects against age-related spatial memory loss

Ann M Laszczyk et al. Neurobiol Aging. 2017 Nov.

Abstract

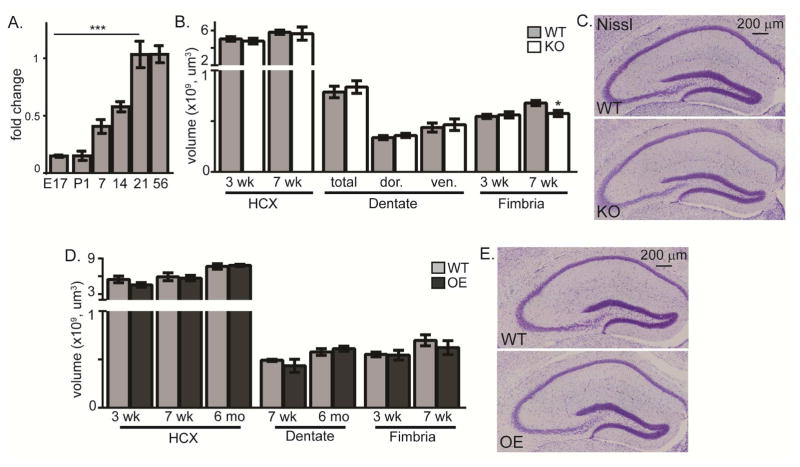
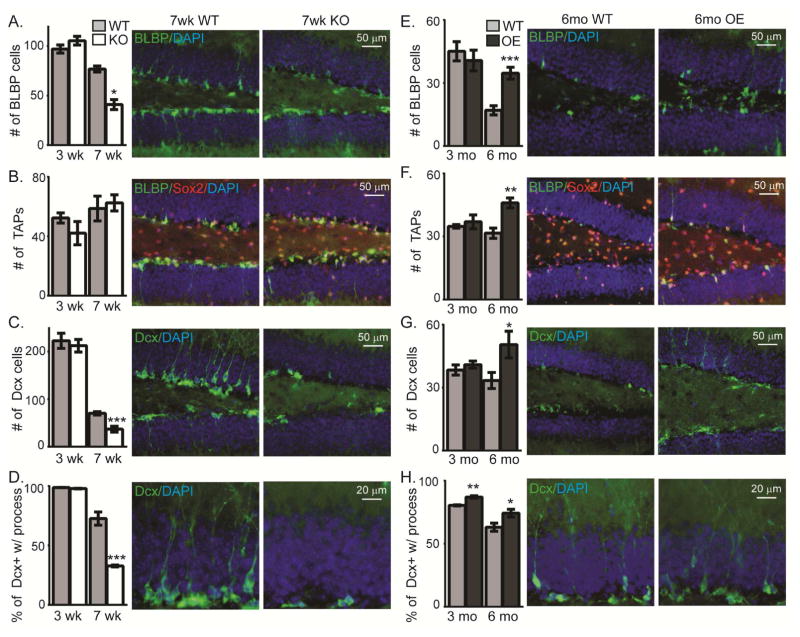
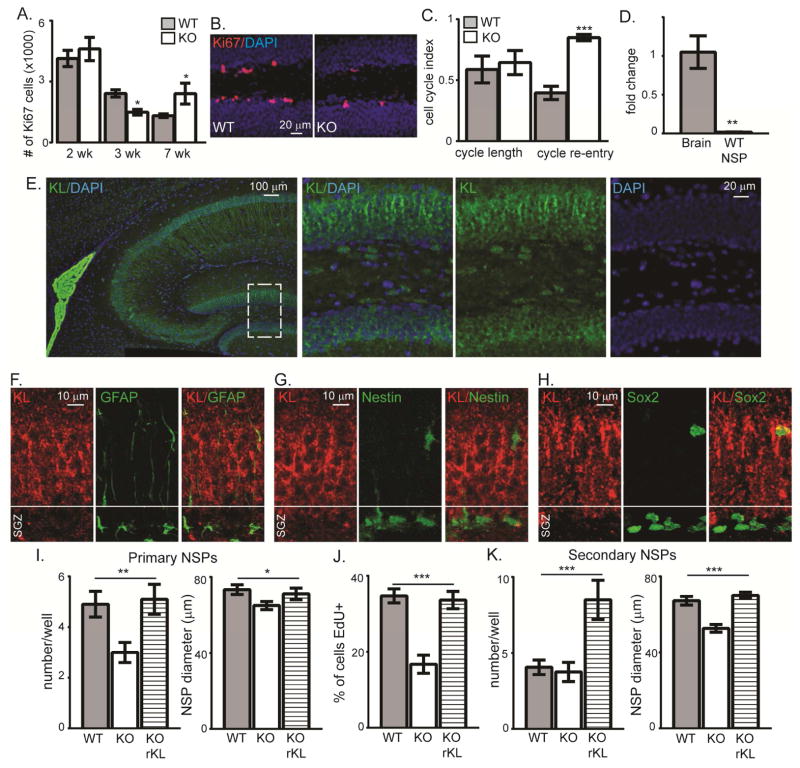
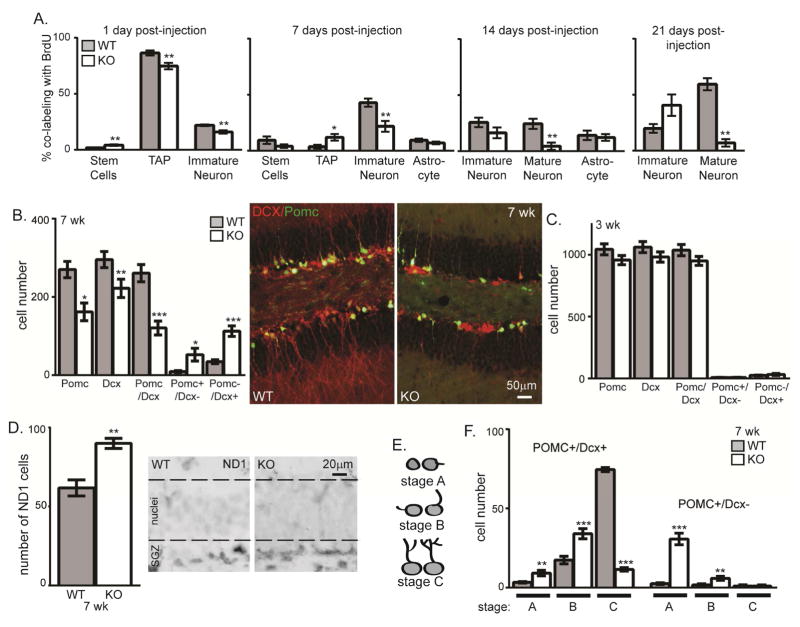
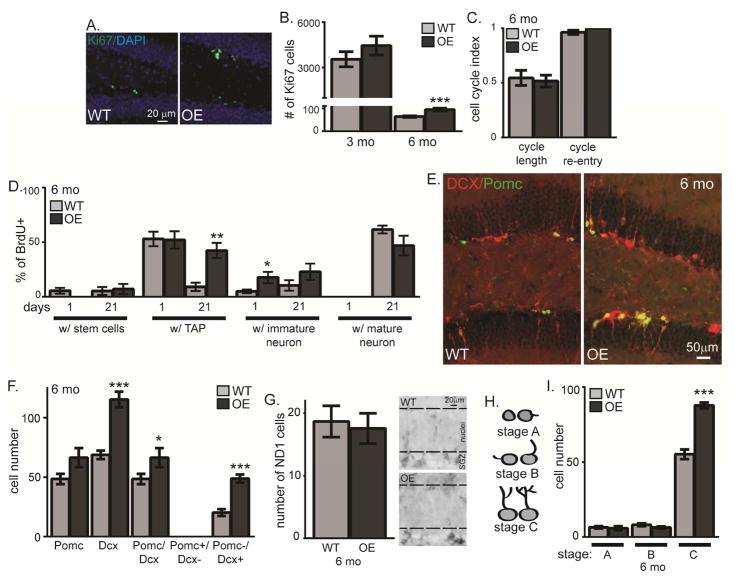
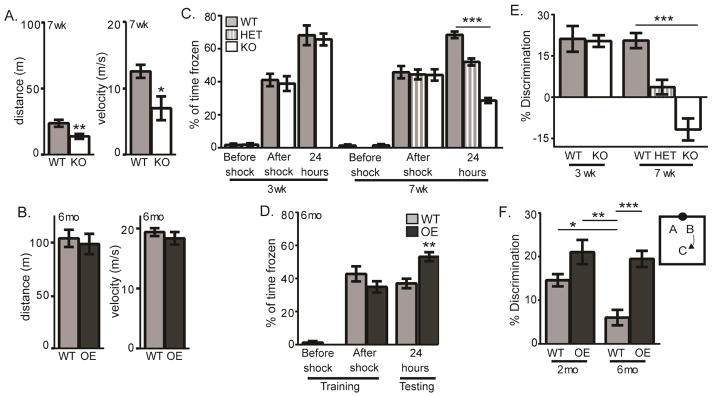
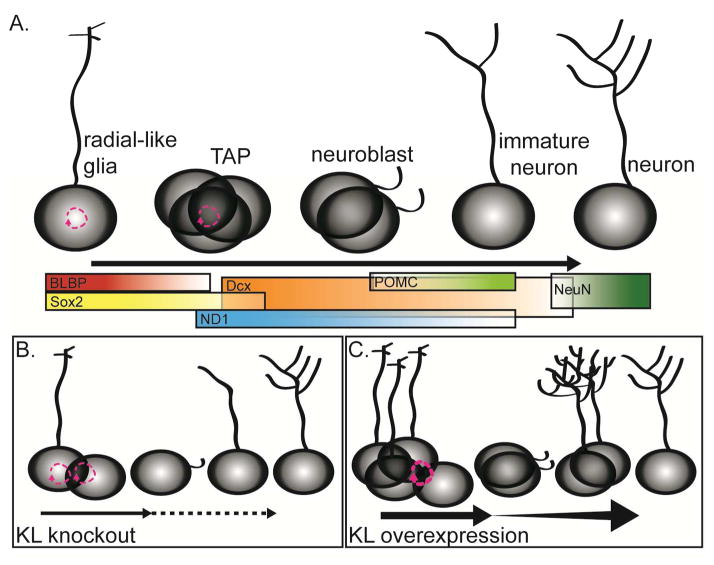
Although the absence of the age-regulating klotho protein causes klotho-deficient mice to rapidly develop cognitive impairment and increasing klotho enhances hippocampal-dependent memory, the cellular effects of klotho that mediate hippocampal-dependent memory function are unknown. Here, we show premature aging of the klotho-deficient hippocampal neurogenic niche as evidenced by reduced numbers of neural stem cells, decreased proliferation, and impaired maturation of immature neurons. Klotho-deficient neurospheres show reduced proliferation and size that is rescued by supplementation with shed klotho protein. Conversely, 6-month-old klotho-overexpressing mice exhibit increased numbers of neural stem cells, increased proliferation, and more immature neurons with enhanced dendritic arborization. Protection from normal age-related loss of object location memory with klotho overexpression and loss of spatial memory when klotho is reduced by even half suggests direct, local effects of the protein. Together, these data show that klotho is a novel regulator of postnatal neurogenesis affecting neural stem cell proliferation and maturation sufficient to impact hippocampal-dependent spatial memory function.

Keywords: Aging; Cognition; Hippocampus; Neural stem cell; Postnatal neurogenesis.


Figures

Figure 1
Figure 1. KL does not affect hippocampal development
A. Brain KL qPCR fold change after normalization to 18s ribosomal subunit and adult brain KL (P56). KL was detected at embryonic (E) day 17 and postnatal (P) days 1, 7, 14, 21, and 56. B. Quantification of 3 and 7 week WT and KO hippocampus (HCX) and fimbria volume and 7 week dentate gyrus (−1.22mm to −3.88mm from bregma; dor (dorsal:−1.22mm to −2.18mm from bregma), ven (ventral: −2.20 to −3.88mm from bregma)). C. Representative 7 week WT and KO Nissl stain. Scale bar is 200μm. D. Quantification of 3 and 7 week WT and OE hippocampus (HCX) and fimbria volume and HCX and dentate volume at 7 weeks and 6 months, as in B. E. Representative 7 week WT and OE Nissl. (n=6; mean +/− S.E.M.; T-test: *p<0.05; mRNA: ANOVA, Dunnett’s post hoc analysis,***p<0.0003 relative to P56).
Figure 2
Figure 2. KL is required for the maintenance of neurogenic cell populations
WT and KO (3 and 7weeks) or WT and OE (3 and 6 month) neurogenic cell populations are the average total cell number across 3 bregma levels/animal (−1.34mm to −2.10mm) of dorsal hippocampal SGZ. Quantification (graph) and representative images (7 weeks for KO, 6 month for OE) for: A,E. Radial-like glial stem cells (brain lipid binding protein, BLBP; green), B,F. Transient amplifying progenitors (TAPs; Sox2+ (red) and BLBP- (green)), and C,G. Immature neurons (doublecortin, Dcx; green). Scale bars represents 50 μm. D,H. Immature neuron arborization as the percent of immature neurons with a process extending into the granule cell layer. Scale bar represents 20μm. DAPI used to label cell nuclei. (n=3–6 for OE; all others n= 8; mean +/− S.E.M.; T-test: *p<0.05, **p<0.001, ***p<0.0003)
Figure 3
Figure 3. KL-deficiency reduces proliferation of neurogenic precursors
A,B. WT and KO 2, 3, and 7 week stereological quantification and representative 3 week IHC of SGZ proliferating cells (Ki67). Cell nuclei labeled with DAPI. Scale bar represents 20μm. C. 3 week old WT and KO mice received 1 BrdU injection to measure cell cycle length (BrdU++Ki67+/BrdU+) and cell cycle re-entry (BrdU++Ki67+/Ki67+). D. Adult hippocampus and 14 day in vitro, primary neurosphere WT qPCR normalized to the 18S ribosomal subunit and adult hippocampus (HCX). E. Choroid plexus and hippocampal representative WT KL IHC (green) and DAPI (blue) (left) with white dashed box indicating location of higher magnification images (right). Scale bar represents 100μm or 20μm. F. Representative confocal Z stack WT SGZ images of KL (red) and GFAP (green). Nuclei not shown for clarity and scale bar represents 10 μm. G. Representative confocal Z stacks WT SGZ images of KL (red) and Nestin-GFP (green) from Nestin-GFP WT mice. Nuclei not shown for clarity and scale bar represents 10 μm. H. Representative confocal Z stacks WT SGZ images of KL (red) and Sox2 (green) from WT mice. Nuclei not shown for clarity and scale bar represents 10 μm. I. Ten days after plating 500 cells/well, the number and diameter (μm) of WT/KO spheres was measured. Separate wells of KO cells received recombinant mouse KL (rKL) at plating. J. EdU was added to the media overly laying adherent cells and proliferation measured as the % of cells that were EdU+. K. Primary spheres (C) were re-plated as single cells to measure secondary sphere number and diameter (μm) 10 days later. (n=4–6 in vivo; NSPs: n=3 independent NSP preparations; F,H are the average of all wells counted +/− S.E.M., G is the average of 4 fields per coverslip; T-test (A,C,D): **p<0.004, ANOVA (F,G,H, I): *p<0.05 (multiple comparison test part F, diameter WT vs KO), **p<0.005, ***p<0.0001)
Figure 4
Figure 4. Klotho-deficiency impairs neuronal maturation
A. At 3 weeks of age, WT and KO mice were injected 4x with BrdU. Brains were collected 1, 7, 14, and 21 days post-injection. IHC was performed to detect BrdU co-localization with each neurogenic cell type. The percent of BrdU containing cells that co-expressed each cell-type specific protein was quantified by averaging the total number of cells across 3 bregma levels as above. % of BrdU labeled cells also expressing BLBP (stem cell), Sox2+/BLBP- (TAP), Dcx (immature neuron), S100β (astrocytes), and NeuN (mature neurons). B. 7 week quantification of the total number of POMC+, DCX+, POMC+/DCX+, POMC+/Dcx−, or POMC−/Dcx+ cells in 3 bregma levels and KO/POMC-GFP reporter mouse representative 7 week WT and KO images (Dcx (red) and POMC (green)). DAPI not shown for clarity of neuronal arbors. Scale bars represent 50μm. C. 3 week quantification of the total number of POMC+ cells, DCX+, POMC+/DCX+, POMC+/Dcx−, or POMC−/Dcx+ cells in 3 bregma levels. D. 7 week representative images and quantification of SGZ cells expressing NeuroD1 (ND1) protein, dashed line added to delineate granule cell layer from SGZ. E. Morphology schematic used to quantify maturation stage. F. 7 week quantification of number of POMC+/DCX+ or POMC+/Dcx− cells by maturation stage. (n=6 POMC/DCX, n= 3 for ND1; mean +/− S.E.M.; T-test: *p<0.05, **p<0.007, ***p<0.0004; chi-square: A stem cells and astrocyte).
Figure 5
Figure 5. KL overexpression enhances neuronal maturation
A,B. WT and OE 6 month IHC for proliferating cells (Ki67), 3 and 6 month stereological quantification. Cell nuclei labeled with DAPI. Scale bar represents 20μm. C. 6 month old mice received 1 BrdU injection to measure cell cycle length (BrdU++Ki67+/BrdU+) and cell cycle re-entry (BrdU++Ki67+/Ki67+). D. 6 month old WT and OE mice were injected 4x with BrdU. Brains were collected 1 day and 3 weeks (21 days) post-injection. The percent of BrdU cells that co-expressed each cell-type specific protein were quantified as in Figure 4: stem cells (BLBP+), TAPs (Sox2+/BLBP−), immature neurons (Dcx+), and mature neurons (NeuN+). E. OE/POMC-GFP reporter mouse representative 6 month WT and OE images (Dcx (red) and POMC (green)). DAPI not shown for clarity of neuronal arbors. Scale bars represent 50μm. F. 6 month quantification of the total number of POMC+, DCX+, POMC+/DCX+, POMC+/Dcx−, or POMC−/Dcx+ cells. G. 6 month representative images and quantification of SGZ neuroD1+ cells (ND1) with dashed line added to delineate SGZ from granule cell body layer. H. Morphology schematic used to quantify maturation stage. I. 6 month quantification of number of cells POMC+/DCX+ or POMC+/Dcx− by maturation. (n=4–6 POMC/DCX, n= 3 for ND1; mean +/− S.E.M.; T-test: *p<0.05, **p<0.007, ***p<0.0004)
Figure 6
Figure 6. KL regulates spatial discrimination
A.7 week old WT and KO open field total distance traveled (meters) and velocity (meters/second). B. 6 month WT and OE open field as in A. C. 3 week WT and KO and 7 week WT, HET, and KO context-dependent fear conditioning quantified as % of time spent freezing on training day before and after foot shock and testing day, 24 hours after shock when mice were returned to the same context. D. 6 month WT and OE context-dependent fear conditioning as in C. E. Percent discrimination of 3 week WT and KO and 7 week WT, HET, and KO object location. F. Diagram depicts experimental design of object location task. Quantification of % discrimination of WT and OE mice at 2 and 6 months old. (n=10–11/genotype; mean +/− S.E.M.; T-tests A–G, ANOVA with Tukey’s post hoc analysis H; *p<0.01, **p<0.004, ***p<0.0001)
Figure 7
Figure 7. KL regulates postnatal neurogenesis
A. Postnatal neurogenesis occurs as stem cells progress through a series of protein expression and morphological changes to mature into neurons. B. In brains without KL, with time, there is a loss of the stem/proliferative pool of cells but increased cell cycle re-entry consistent with a prematurely aging neurogenic niche. Decreased proliferation, decreased number of stem cells and immature neurons were measured, as was delayed maturation of immature neurons. C Overexpression of KL increases the number of stem cells/proliferative cells still present at 6 months. Increased proliferation and enhanced maturation allow a greater number of highly arborized immature neurons to persist in the dentate long after normal age-related downregulation of postnatal neurogenesis.

References

    1. Aimone JB, Li Y, et al. Regulation and function of adult neurogenesis: from genes to cognition. Physiological reviews. 2014;94(4):991–1026. - PMC - PubMed
    1. Arking DE, Atzmon G, et al. Association between a functional variant of the KLOTHO gene and high-density lipoprotein cholesterol, blood pressure, stroke, and longevity. Circ Res. 2005;96(4):412–418. - PubMed
    1. Arking DE, Krebsova A, et al. Association of human aging with a functional variant of klotho. Proc Natl Acad Sci U S A. 2002;99(2):856–861. - PMC - PubMed
    1. Ben-Ari Y. Developing networks play a similar melody. Trends in neurosciences. 2001;24(6):353–360. - PubMed
    1. Ben Abdallah NM, Slomianka L, et al. Early age-related changes in adult hippocampal neurogenesis in C57 mice. Neurobiology of aging. 2010;31(1):151–161. - PubMed