Review
. 2017 Jul 1;58(1):42-58.
doi: 10.1093/ilar/ilw041.

Rat Genome and Model Resources

Affiliations
Review

Rat Genome and Model Resources

Mary Shimoyama et al. ILAR J. .

Abstract

Rats remain a major model for studying disease mechanisms and discovery, validation, and testing of new compounds to improve human health. The rat's value continues to grow as indicated by the more than 1.4 million publications (second to human) at PubMed documenting important discoveries using this model. Advanced sequencing technologies, genome modification techniques, and the development of embryonic stem cell protocols ensure the rat remains an important mammalian model for disease studies. The 2004 release of the reference genome has been followed by the production of complete genomes for more than two dozen individual strains utilizing NextGen sequencing technologies; their analyses have identified over 80 million variants. This explosion in genomic data has been accompanied by the ability to selectively edit the rat genome, leading to hundreds of new strains through multiple technologies. A number of resources have been developed to provide investigators with access to precision rat models, comprehensive datasets, and sophisticated software tools necessary for their research. Those profiled here include the Rat Genome Database, PhenoGen, Gene Editing Rat Resource Center, Rat Resource and Research Center, and the National BioResource Project for the Rat in Japan.

Keywords: Rattus norvegicus; bioinformatics; database; disease; genomics; phenotype; rat; resource.


Figures

Figure 1
Figure 1
RGD’s InterViewer tool. The InterViewer is a visualization tool for protein-protein interactions. In this example, a UniProt identifier for the rat Cacna1c gene, P22002, was entered. The results show four interaction partners for this protein. The red color of the nodes indicates that these are all rat proteins. The colors of the edges, that is, the lines between the nodes, indicate that there are three types of interactions: physical association, dephosphorylation reaction, and colocalization. Additional information about the interactors and their interactions is available within the tool and via links to other pages at RGD and other external sites.
Figure 2
Figure 2
Comparison of heart rates across strains and experiments. RGD’s PhenoMiner tool allows users to select one or more measurements, rat strains, measurement methods, and experimental conditions of interest, then compare the results across the selected strains and conditions, not only within a single study but across multiple studies. Here, heart rates for the WKY/NCrl and FHH/EurMcwi strains are compared under naïve control conditions after walking at 0.8 m/min for 5 minutes and after walking for 5 minutes then running at 1.6 m/min for 5 minutes. A tabular view of the results (not shown) is also available to view and download.
Figure 3
Figure 3
Variant Visualizer showing damaging variants in gene across strains. RGD’s Variant Visualizer tool leverages the whole genome sequencing data for a number of rat strains to provide variant profiles for genes or genomic regions across any or all of the sequenced strains. Here a variant predicted to be “possibly damaging” for protein functions is shown to be present in the FHH, FHL, and SBH strains but not in the other strains selected. Clicking on the square corresponding to the strain and variant of interest opens a detail window that shows information about the sequencing, the variant(s) called, and the predicted consequence of the sequence change.
Figure 4
Figure 4
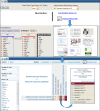
RGD’s OLGA. The OLGA tool is a powerful and flexible advanced query engine that can be used for bulk queries or searches by functional attributes or genomic position for rat, mouse and human genes and QTL, and rat strains. At each step, a list of objects, in this case genes, is produced and the user can choose how to combine the lists. In the example on the top, the user selected to view the intersection between lists of rat genes associated with blood coagulation disorders and genes that interact with the drug warfarin. The user then has the option to add another gene list to the current result set or to analyze the current list. Selecting “Annotation Comparison” in the toolbox takes the user to the Gene Annotator (GA) Tool with their list of 17 genes already displayed in a comparison heatmap which compares disease and pathway associations for the genes in the list. By selecting more specific disease and pathway terms, the user retrieves the list of eight genes that are associated with blood coagulation disorders and heart diseases, are involved in the innate immune response pathway, and interact with warfarin.
Figure 5
Figure 5
The PhenoGen pipeline for systems genetic analysis. The PhenoGen website (http://phenogen.ucdenver.edu) was designed as an interactive platform to facilitate the exploration of DNA variants, RNA expression, and complex traits in the rat using a systems genetics approach. The data sets generated from the HRPD are represented by the orange, green, red, and blue boxes on the left. These data sets are then integrated to generate the information in the column of boxes in the middle. The processed data can be explored on the PhenoGen website at the individual gene level or various aspects of the data can be combined in a phenotype-level approach when an investigator has measured a phenotype on the HRDP or a subset of the HRDP. The final outcome of such an approach would be a candidate module/network that can be used for a multitude of purposes including those indicated in the boxes outlined in green on the bottom right of the graphic.
Figure 6
Figure 6
Flow chart of RRRC operations. Once a researcher has donated a rat strain to the RRRC, it will follow one of three paths depending on the characteristics of the model and the predicted demand for it. For rats with defined gene mutations on a standard rat background, the model undergoes sperm cryopreservation. For lines that are predicted to be low demand models with either unknown or complex mutations and/or backgrounds, the rats are bred to expand the colony before embryo collection and cryopreservation. For high demand models, live colonies are established for breeding, distribution, and preservation. In all cases, quality assurance, genotyping, and health monitoring are performed upon receipt of the animals and before distribution of products.
Figure 7
Figure 7
Search interface of the NBRP-Rat Strain Database. Several categories like “general strain information,” “preservation status,” “genetic category,” or “research category” can be combined. The search fields and checkboxes in the database queries are “AND” -linked, which supports the fine selection of specific rat strains.
Figure 8
Figure 8
NBRP-Rat Phenome Project. Strain ranking for systolic blood pressure for selected male and female pairs of rat strains. Data on more than 160 strains are available from this phenome database.
Figure 9
Figure 9
Pedigree charting tool. The genetic differences, based on 357 microsatellite markers, are shown in each chart. The interface allows individual selection of reference strains and displays the “genetic distance” to the selected strain in percent (http://www.anim.med.kyoto-u.ac.jp/nbr/pedigree/).
Figure 10
Figure 10
Schematic diagram of the generation of gene-targeted rat models of human diseases. ENU is injected intraperitoneally into 9- and 10-week-old male F344/NSlc rats. They are mated 10 weeks after injection. DNA and sperm of their offspring (G1) are stored; the DNA can be screened through a newly developed method (MuT-POWER) and affected sperm are revitalized by ICSI to derive viable offspring from the G1 sperms.

Similar articles

  • Rat Genome Database (RGD): mapping disease onto the genome.
    Twigger S, Lu J, Shimoyama M, Chen D, Pasko D, Long H, Ginster J, Chen CF, Nigam R, Kwitek A, Eppig J, Maltais L, Maglott D, Schuler G, Jacob H, Tonellato PJ. Twigger S, et al. Nucleic Acids Res. 2002 Jan 1;30(1):125-8. doi: 10.1093/nar/30.1.125. Nucleic Acids Res. 2002. PMID: 11752273 Free PMC article.
  • The Rat Genome Database 2009: variation, ontologies and pathways.
    Dwinell MR, Worthey EA, Shimoyama M, Bakir-Gungor B, DePons J, Laulederkind S, Lowry T, Nigram R, Petri V, Smith J, Stoddard A, Twigger SN, Jacob HJ; RGD Team. Dwinell MR, et al. Nucleic Acids Res. 2009 Jan;37(Database issue):D744-9. doi: 10.1093/nar/gkn842. Epub 2008 Nov 7. Nucleic Acids Res. 2009. PMID: 18996890 Free PMC article.
  • Exploring human disease using the Rat Genome Database.
    Shimoyama M, Laulederkind SJ, De Pons J, Nigam R, Smith JR, Tutaj M, Petri V, Hayman GT, Wang SJ, Ghiasvand O, Thota J, Dwinell MR. Shimoyama M, et al. Dis Model Mech. 2016 Oct 1;9(10):1089-1095. doi: 10.1242/dmm.026021. Dis Model Mech. 2016. PMID: 27736745 Free PMC article. Review.
  • What everybody should know about the rat genome and its online resources.
    Twigger SN, Pruitt KD, Fernández-Suárez XM, Karolchik D, Worley KC, Maglott DR, Brown G, Weinstock G, Gibbs RA, Kent J, Birney E, Jacob HJ. Twigger SN, et al. Nat Genet. 2008 May;40(5):523-7. doi: 10.1038/ng0508-523. Nat Genet. 2008. PMID: 18443589 Free PMC article.
  • Genomic medicine and risk prediction across the disease spectrum.
    Kotze MJ, Lückhoff HK, Peeters AV, Baatjes K, Schoeman M, van der Merwe L, Grant KA, Fisher LR, van der Merwe N, Pretorius J, van Velden DP, Myburgh EJ, Pienaar FM, van Rensburg SJ, Yako YY, September AV, Moremi KE, Cronje FJ, Tiffin N, Bouwens CS, Bezuidenhout J, Apffelstaedt JP, Hough FS, Erasmus RT, Schneider JW. Kotze MJ, et al. Crit Rev Clin Lab Sci. 2015;52(3):120-37. doi: 10.3109/10408363.2014.997930. Epub 2015 Jan 19. Crit Rev Clin Lab Sci. 2015. PMID: 25597499 Review.

Cited by

References

    1. Aken BL, Ayling S, Barrell D, Clarke L, Curwen V, Fairley S, Fernandez Banet J, Billis K, Garcia Giron C, Hourlier T, Howe K, Kahari A, Kokocinski F, Martin FJ, Murphy DN, Nag R, Ruffier M, Schuster M, Tang YA, Vogel JH, White S, Zadissa A, Flicek P, Searle SM. 2016. The Ensembl gene annotation system Database (Oxford) 2016. - PMC - PubMed
    1. Allocco DJ, Kohane IS, Butte AJ. 2004. Quantifying the relationship between co-expression, co-regulation and gene function. BMC Bioinformatics 5:18. - PMC - PubMed
    1. Atanur SS, Diaz AG, Maratou K, Sarkis A, Rotival M, Game L, Tschannen MR, Kaisaki PJ, Otto GW, Ma MC, Keane TM, Hummel O, Saar K, Chen W, Guryev V, Gopalakrishnan K, Garrett MR, Joe B, Citterio L, Bianchi G, McBride M, Dominiczak A, Adams DJ, Serikawa T, Flicek P, Cuppen E, Hubner N, Petretto E, Gauguier D, Kwitek A, Jacob H, Aitman TJ. 2013. Genome sequencing reveals loci under artificial selection that underlie disease phenotypes in the laboratory rat. Cell 154(3):691–703. - PMC - PubMed
    1. Baud A, Hermsen R, Guryev V, Stridh P, Graham D, McBride MW, Foroud T, Calderari S, Diez M, Ockinger J, Beyeen AD, Gillett A, Abdelmagid N, Guerreiro-Cacais AO, Jagodic M, Tuncel J, Norin U, Beattie E, Huynh N, Miller WH, Koller DL, Alam I, Falak S, Osborne-Pellegrin M, Martinez-Membrives E, Canete T, Blazquez G, Vicens-Costa E, Mont-Cardona C, Diaz-Moran S, Tobena A, Hummel O, Zelenika D, Saar K, Patone G, Bauerfeind A, Bihoreau MT, Heinig M, Lee YA, Rintisch C, Schulz H, Wheeler DA, Worley KC, Muzny DM, Gibbs RA, Lathrop M, Lansu N, Toonen P, Ruzius FP, de Bruijn E, Hauser H, Adams DJ, Keane T, Atanur SS, Aitman TJ, Flicek P, Malinauskas T, Jones EY, Ekman D, Lopez-Aumatell R, Dominiczak AF, Johannesson M, Holmdahl R, Olsson T, Gauguier D, Hubner N, Fernandez-Teruel A, Cuppen E, Mott R, Flint J.. 2013. Combined sequence-based and genetic mapping analysis of complex traits in outbred rats. Nat Genet 45:767–775. - PMC - PubMed
    1. Bennett BJ, Farber CR, Orozco L, Kang HM, Ghazalpour A, Siemers N, Neubauer M, Neuhaus I, Yordanova R, Guan B, Truong A, Yang WP, He A, Kayne P, Gargalovic P, Kirchgessner T, Pan C, Castellani LW, Kostem E, Furlotte N, Drake TA, Eskin E, Lusis AJ. 2010. A high-resolution association mapping panel for the dissection of complex traits in mice. Genome Res 20(2):281–290. - PMC - PubMed

LinkOut - more resources