. 2017 Aug 24;18(1):161.
doi: 10.1186/s13059-017-1289-9.

Genome-wide association studies dissect the genetic networks underlying agronomical traits in soybean

Affiliations

Genome-wide association studies dissect the genetic networks underlying agronomical traits in soybean

Chao Fang et al. Genome Biol. .

Abstract

Background: Soybean (Glycine max [L.] Merr.) is one of the most important oil and protein crops. Ever-increasing soybean consumption necessitates the improvement of varieties for more efficient production. However, both correlations among different traits and genetic interactions among genes that affect a single trait pose a challenge to soybean breeding.

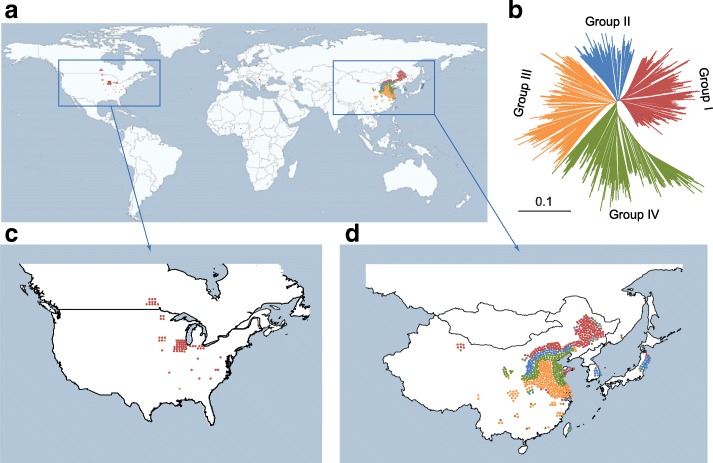
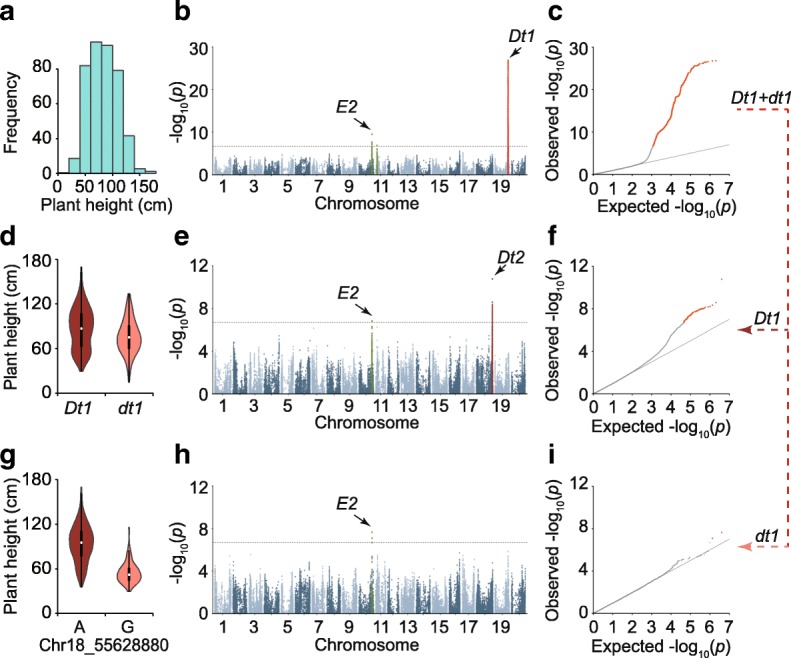
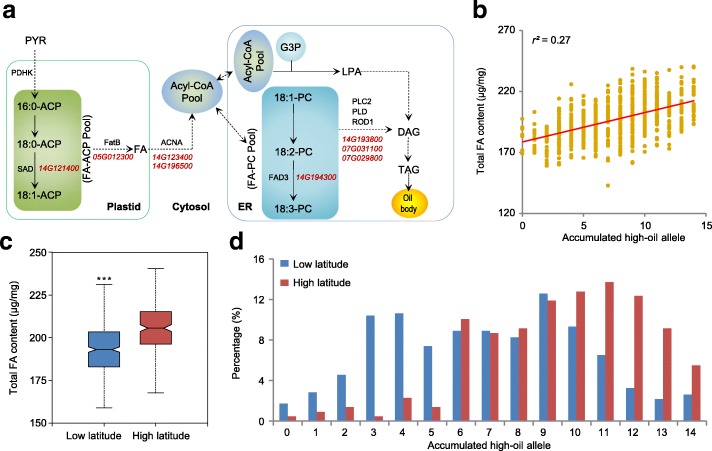
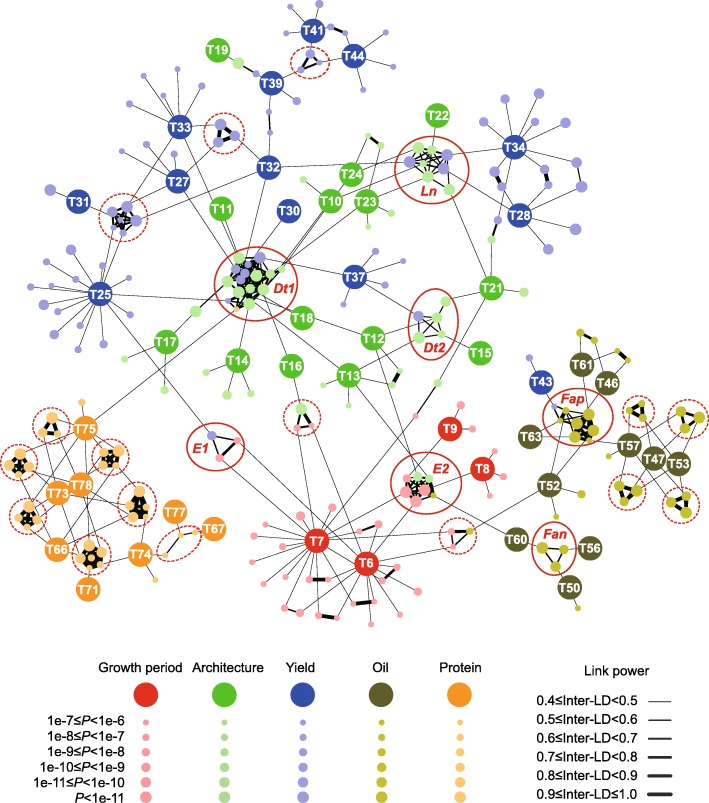
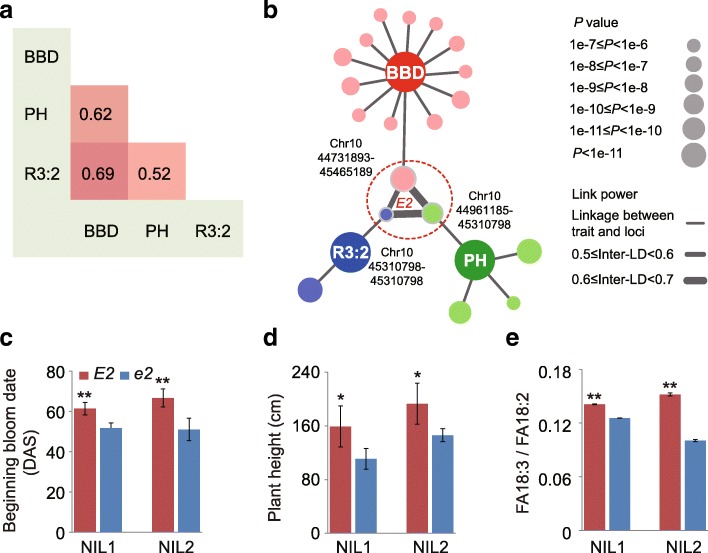
Results: To understand the genetic networks underlying phenotypic correlations, we collected 809 soybean accessions worldwide and phenotyped them for two years at three locations for 84 agronomic traits. Genome-wide association studies identified 245 significant genetic loci, among which 95 genetically interacted with other loci. We determined that 14 oil synthesis-related genes are responsible for fatty acid accumulation in soybean and function in line with an additive model. Network analyses demonstrated that 51 traits could be linked through the linkage disequilibrium of 115 associated loci and these links reflect phenotypic correlations. We revealed that 23 loci, including the known Dt1, E2, E1, Ln, Dt2, Fan, and Fap loci, as well as 16 undefined associated loci, have pleiotropic effects on different traits.

Conclusions: This study provides insights into the genetic correlation among complex traits and will facilitate future soybean functional studies and breeding through molecular design.

Keywords: Agronomic traits; GWAS; Network; Soybean.


Conflict of interest statement

Ethics approval and consent to participate

Not applicable.

Competing interests

The authors declare that they have no competing interests.

Publisher’s Note

Springer Nature remains neutral with regard to jurisdictional claims in published maps and institutional affiliations.

Figures

Fig. 1
Fig. 1
Geographic distribution and genetic structure of 809 soybean accessions. a Geographic distribution of the 809 soybean accessions. Each accession is displayed as a dot. b Genetic structure of the 809 soybean accessions. The accessions are clustered by the neighbor-joining tree using whole-genome SNPs. The length of the lines on the tree indicates the simple matching distance. c, d The areas with dense collections (Asia and North America) are magnified separately. The colors of the dots in (a, c, and d) correspond to their groups in (b)
Fig. 2
Fig. 2
GWAS of the soybean plant height. a Distribution of the plant height values across all of the 809 soybean accessions. b GWAS result from all accessions. In the GWAS result, both known genes Dt1 and E2 are identified. c Quantile–quantile plot for plant height. d The plant height variation between different Dt1 alleles in all 809 accessions. The known gene Dt1 separates the 809 accessions into two subgroups with different plant height means. e The GWAS result of plant height using the accessions from the Dt1 subgroup. f Quantile–quantile plot for plant height of Dt1 subgroup. g Plant height variation between different Dt2 genotypes in the Dt1 subgroup. h The GWAS result of plant height using the accessions from the dt1 subgroup. i Quantile–quantile plot for plant height of dt1 subgroup. GWAS results are presented by negative log10 P values against position on each of 20 chromosomes. Horizontal dashed lines indicate the genome-wide significant threshold (2 × 10–7)
Fig. 3
Fig. 3
Dissection of genetic regulation of the fatty acid content in soybean. a Candidate genes in the lipid metabolic pathway that are responsible for the variation of fatty acid (FA) synthesis in soybean germplasm. The pathway is modified from Arabidopsis. The dotted lines represent multiple reaction steps. b Plot of the total FA content against the accumulation of high-oil-content alleles. The x-axis indicates the number of accumulated high-oil alleles from all candidate genes in the soybean germplasm; the y-axis shows the total FA content in the corresponding population. c Total FA content of the germplasm from low-latitude and high-latitude areas. ***P < 0.001 (one-sided Student’s t-test, n = 461, 219). d Proportion of accumulated high-oil alleles in low-latitude and high-latitude populations. ACP acyl carrier protein, DAG diacylglycerol, G3P glycerol-3-phosphate, FA fatty acid, LPA lysophosphatidic acid, PC phosphatidylcholine, PYR pyruvate, TAG triacylglycerol, ACNA acyl-CoA n-acyltransferase, FAD fatty acid desaturase, FatB fatty acyl-ACP thioesterase B, PDHK pyruvate dehydrogenase kinase, PLC phospholipase C, PLD phospholipase D, ROD1 reduced oleate desaturation 1, SAD stearoyl-acyl-carrier-protein desaturase, ER endoplasmic reticulum
Fig. 4
Fig. 4
Association networks across different traits in soybean. The nodes represent traits and their responsible SAL. The edges between the SAL from different traits are linked by LD. Only the edges with an average LD ≥ 0.4 are displayed. The trait abbreviations match those in Additional file 6: Table S5. The overlapped SAL covering Dt1, Dt2, E1, E2, Ln, Fan, and Fap are indicated by the actual circles. Other linked SAL covering unknown QTL are indicated by the dotted circles
Fig. 5
Fig. 5
Phenotype correlations and genetic networks of associated loci. a The correlation among three traits: BBD, PH, and R3:2 of linolenic acid (FA18:3) to linoleic acid (FA18:2). b The association networks across PH, BBD, and R3:2. The genetic network presents the SAL with average LD ≥ 0.4. An overlapped SAL covering E2 is indicated by the dotted circle. Phenotype data (mean ± s.d., n = 4) of different alleles of E2 in different E2 near isogenic lines are illustrated for BBC (c), PH (d), and R3:2 of linolenic to linoleic acid (e). NIL1 (PI 547553, E1E2s-tt vs. PI 547549, E1e2s-tt). NIL2 (ZK164, E1E2E3E4 vs. ZK166, E1e2E3E4). E1, E2, E3, E4: loci controlling flowering ability, s-t: locus controlling plant height, T: locus controlling pubescence color. DAS day after sowing. *P < 0.05; **P < 0.01 (one-sided Student’s t-test)

References

    1. Wilson RF. Soybean: market driven research needs. New York: Springer Science Press; 2008.
    1. Ray DK, Mueller ND, West PC, Foley JA. Yield trends are insufficient to double global crop production by 2050. PLoS One. 2013;8:e66428. doi: 10.1371/journal.pone.0066428. - DOI - PMC - PubMed
    1. Peleman JD, van der Voort JR. Breeding by design. Trends Plant Sci. 2003;8:330–4. doi: 10.1016/S1360-1385(03)00134-1. - DOI - PubMed
    1. Qian Q, Guo L, Smith S, Li J. Breeding high-yield superior quality hybrid super rice by rational design. National Sci Rev. 2016;3:283–94. doi: 10.1093/nsr/nww006. - DOI
    1. Xia Z, Zhai H, Lü S, Wu H, Zhang Y. Recent achievement in gene cloning and functional genomics in soybean. World Scientific J. 2013;2013:1–7. - PMC - PubMed

Publication types

LinkOut - more resources