. 2017 Sep 4;214(9):2715-2732.
doi: 10.1084/jem.20170438. Epub 2017 Aug 24.

CD55 regulates self-renewal and cisplatin resistance in endometrioid tumors

Affiliations

CD55 regulates self-renewal and cisplatin resistance in endometrioid tumors

Caner Saygin et al. J Exp Med. .

Abstract

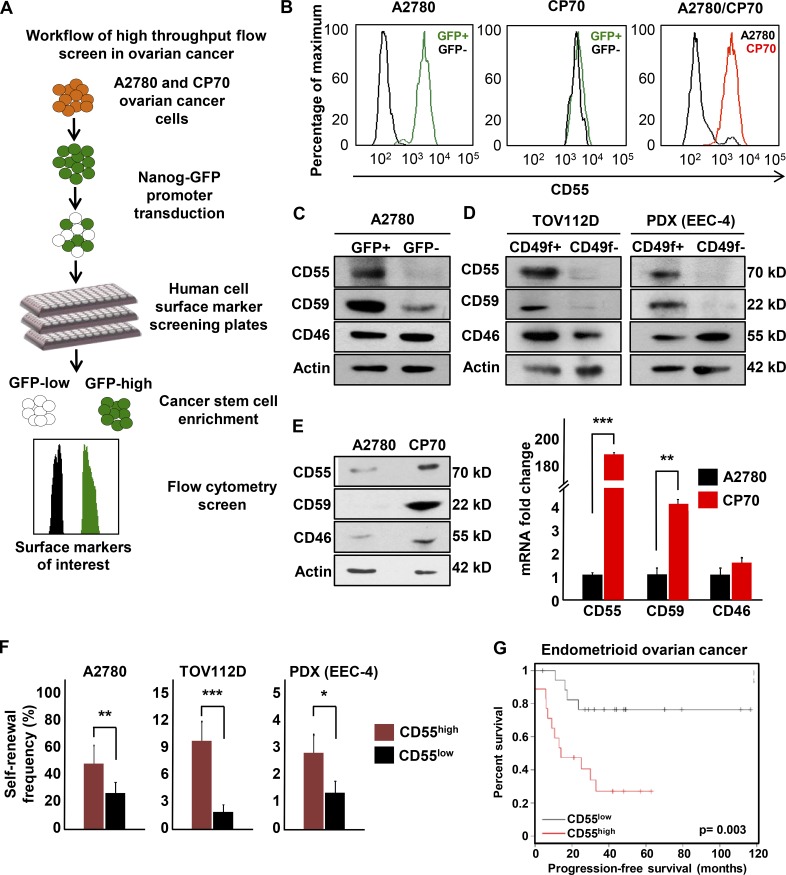
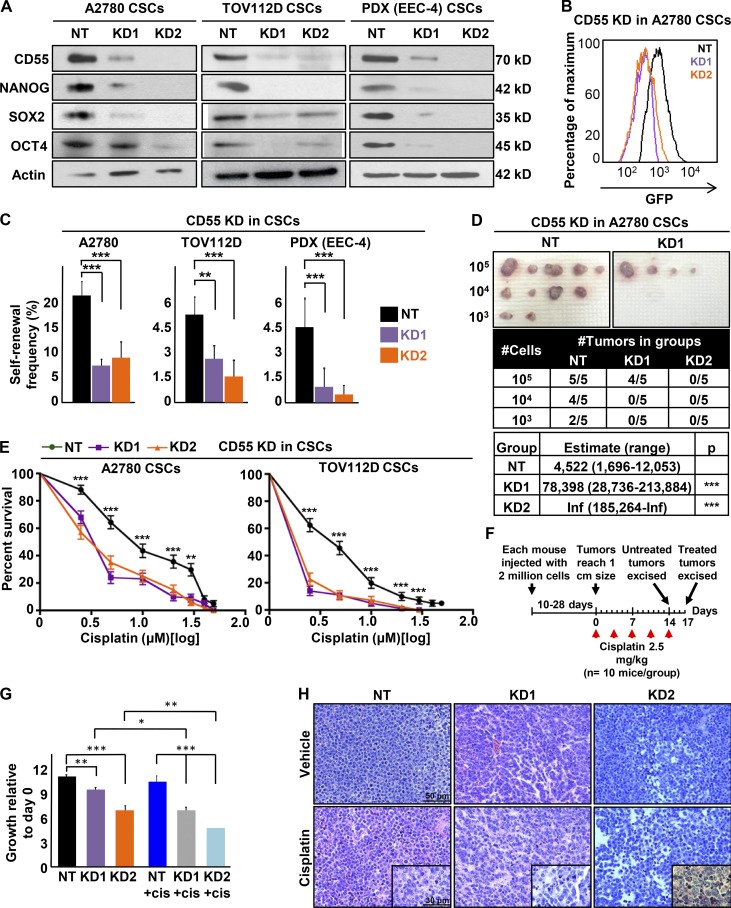
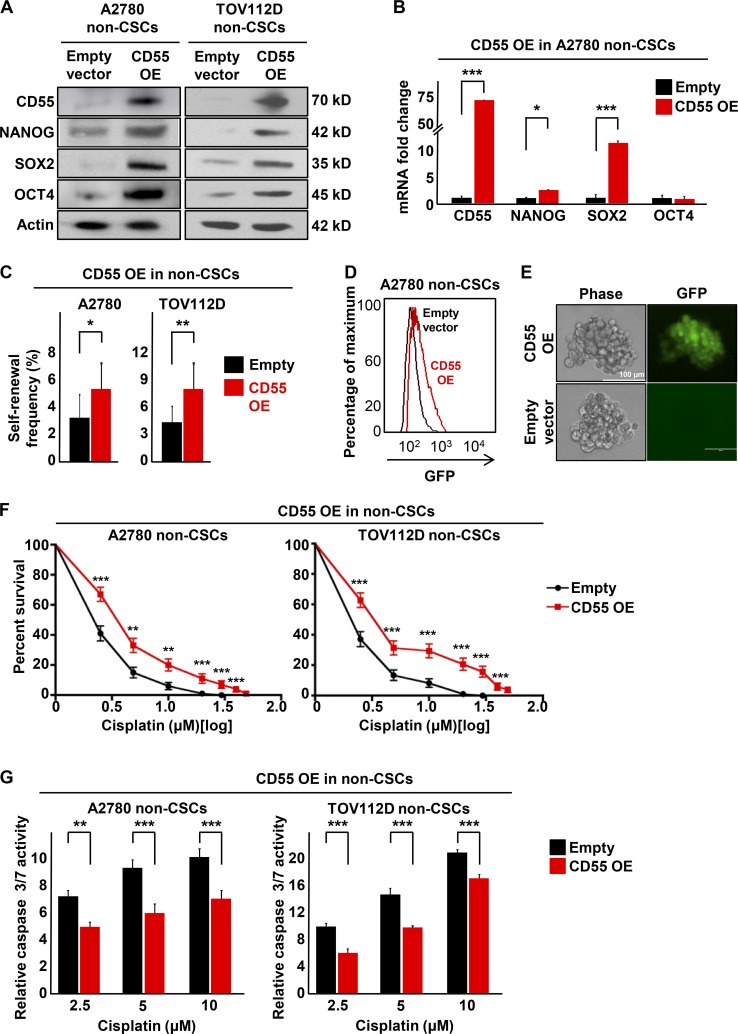
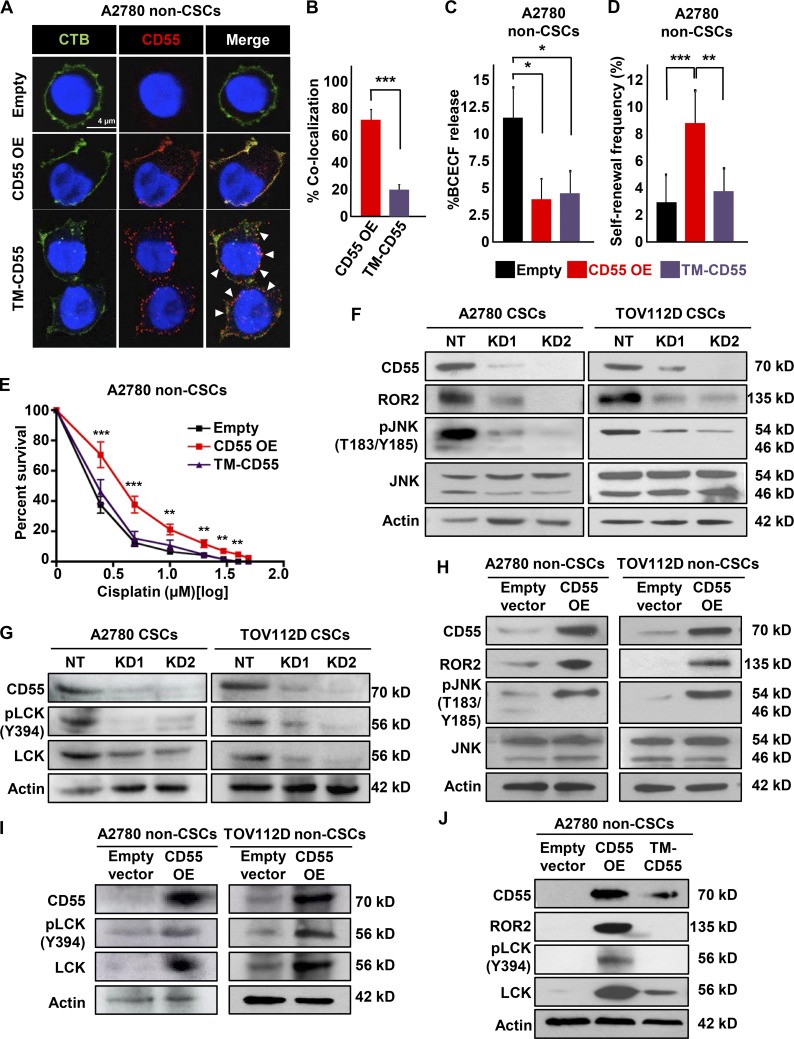
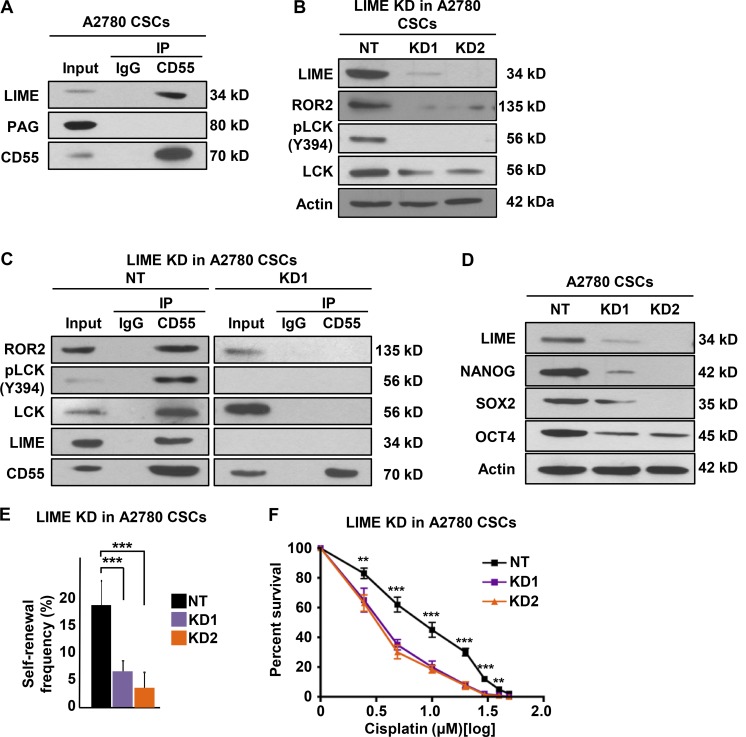
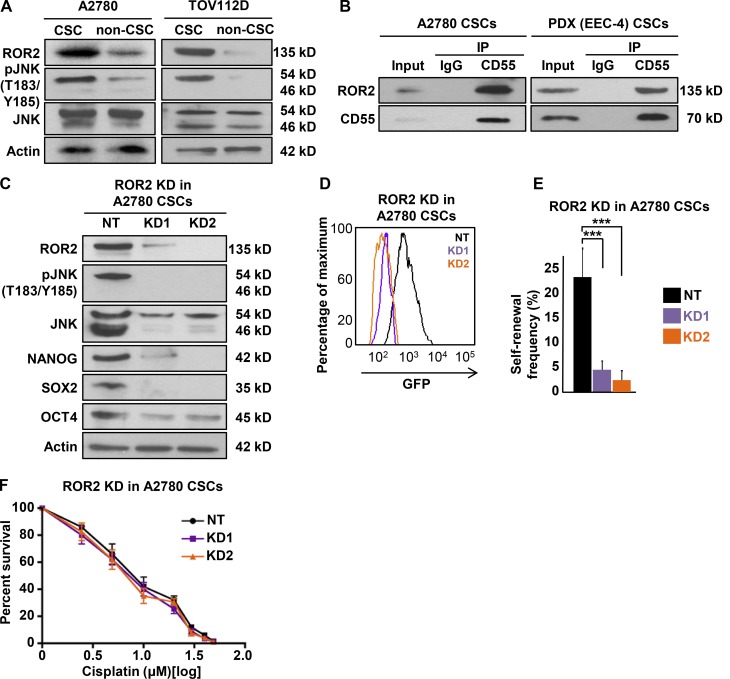
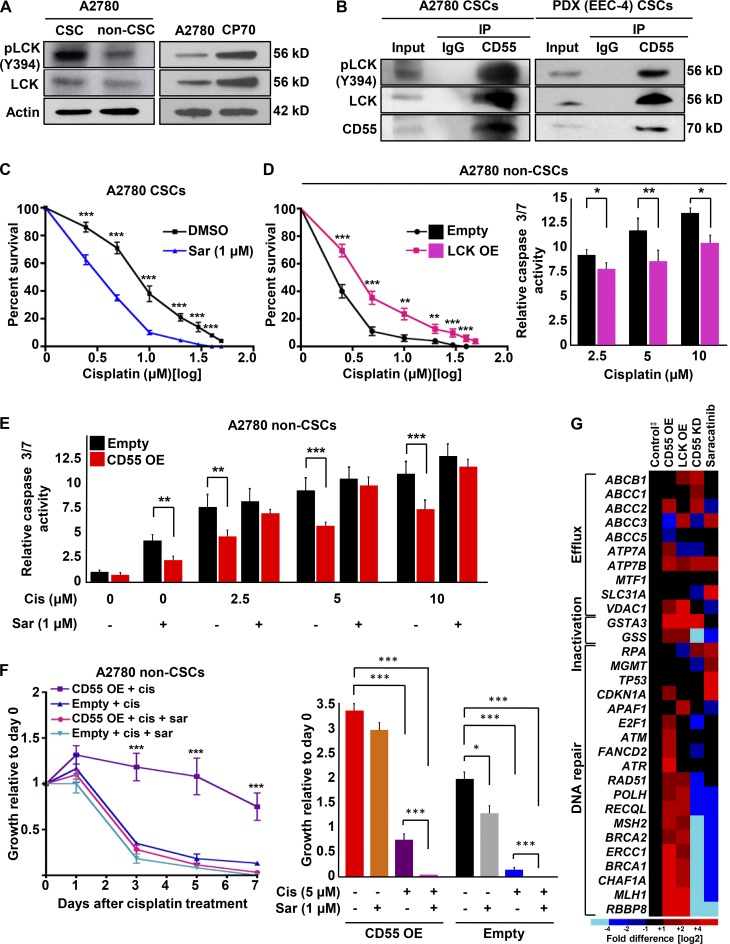
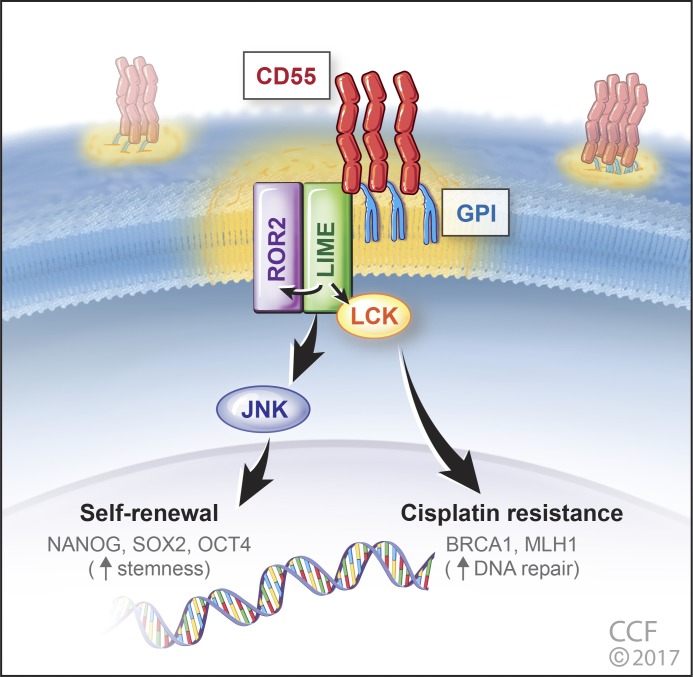
Effective targeting of cancer stem cells (CSCs) requires neutralization of self-renewal and chemoresistance, but these phenotypes are often regulated by distinct molecular mechanisms. Here we report the ability to target both of these phenotypes via CD55, an intrinsic cell surface complement inhibitor, which was identified in a comparative analysis between CSCs and non-CSCs in endometrioid cancer models. In this context, CD55 functions in a complement-independent manner and required lipid raft localization for CSC maintenance and cisplatin resistance. CD55 regulated self-renewal and core pluripotency genes via ROR2/JNK signaling and in parallel cisplatin resistance via lymphocyte-specific protein tyrosine kinase (LCK) signaling, which induced DNA repair genes. Targeting LCK signaling via saracatinib, an inhibitor currently undergoing clinical evaluation, sensitized chemoresistant cells to cisplatin. Collectively, our findings identify CD55 as a unique signaling node that drives self-renewal and therapeutic resistance through a bifurcating signaling axis and provides an opportunity to target both signaling pathways in endometrioid tumors.


Figures

Figure 1.
Figure 1.
CD55 is highly expressed on endometrioid ovarian and uterine CSCs and cisplatin-resistant cells. (A) A high-throughput flow cytometry screen of 242 different surface CD markers in cisplatin-naive (A2780) and cisplatin-resistant (CP70) ovarian cancer cells was performed to investigate the differential expression of these markers between CSCs versus non-CSCs and cisplatin-naive versus cisplatin-resistant cells. (B) Of 242 markers, CD55 was the most highly and differentially expressed between cisplatin-naive CSCs versus non-CSCs and cisplatin-resistant versus cisplatin-naive cells. (C and D) Cell lysates from cisplatin-naive A2780 reporter, TOV112D, and PDX (EEC-4) cells sorted into CSCs and non-CSCs by GFP expression and CD49f expression, respectively, were probed with anti-CD55, CD59, and CD46 antibodies. Actin was used as a loading control. Data are representative of three independent experiments. (E) Protein and mRNA expression of CD55, CD59, and CD46 were assessed in lysates from cisplatin-naive (A2780) and cisplatin-resistant (CP70) cells. Actin was used as a control. Data are representative of two independent experiments. (F) Limiting dilution analysis of CD55+ compared with CD55− cisplatin-naive cells. The graph represents the estimates in percentage of self-renewal frequency in sorted populations with the corresponding p-values. Data represent two independent experiments. (G) Kaplan-Meier (K-M) progression-free survival curve for endometrioid ovarian cancer patients who had high versus low tumor CD55 expression before therapy was obtained from K-M plotter database (http://kmplot.com/analysis/). *, P < 0.05; **, P < 0.01; ***, P < 0.001.
Figure 2.
Figure 2.
CD55 maintains self-renewal and cisplatin resistance in endometrioid tumors. (A) Cell lysates from cisplatin-naive CSCs silenced using two CD55 shRNA constructs (KD1, KD2) and a nontargeting shRNA (NT) control were immunoblotted for CD55, NANOG, SOX2, and OCT4. Actin was used as a loading control. Data are representative of two or three independent experiments. (B) A2780 CSCs silenced for CD55 and NT controls were flowed for GFP signal intensity, which indicates NANOG promoter activity. (C) Limiting dilution analysis plots of CD55 NT control compared with CD55 KD1 and KD2 silencing constructs in cisplatin-naive CSCs. (D) In vivo tumor initiation studies were performed with five mice per group, and the estimates of stem cell frequencies of CD55 NT control compared with the CD55 KD1 and KD2 silencing constructs are shown. (E) CD55-silenced cisplatin-naive CSCs and their NT controls were treated with 0–50 µM cisplatin, and percentage surviving cells is graphed. Data are representative of three independent experiments. (F and G) In vivo cisplatin sensitivity studies were performed comparing the NT control group with the CD55-silenced group, and the graph shows the growth rate of tumors compared with the first day of cisplatin treatment. (H) Hematoxylin and eosin–stained slides of tumors excised from mice treated with cisplatin and vehicle controls. *, P < 0.05; **, P < 0.01; ***, P < 0.001. Bar, 50 µm (30 µm in insets).
Figure 3.
Figure 3.
CD55 is sufficient to drive self-renewal and cisplatin-resistance in endometrioid non-CSCs. (A) Immunoblots of cisplatin-naive non-CSCs with CD55 overexpression (OE) and empty vector controls were probed with CD55, NANOG, SOX2, and OCT4. Actin was used as loading control. Data are representative of two independent experiments. (B) mRNA expression was determined by quantitative real-time PCR and compared between CD55-overexpressing A2780 non-CSCs and empty vector control non-CSCs. Actin was used as a control. Three technical replicates were used. (C) Limiting dilution analysis plots of empty vector control compared with CD55 overexpression in cisplatin-naive non-CSCs. The graph compares the estimates of the percentage of self-renewal frequency in sorted populations with the corresponding p-values. Data are representative of three independent experiments. (D) A2780 non-CSCs transduced with CD55 overexpression and empty vector controls were flowed for GFP signal intensity, which indicates NANOG promoter activity. (E) Tumorsphere from A2780 non-CSCs transduced with CD55 and empty vector control were imaged using a digital immunofluorescence microscope. (F) CD55-overexpressing cisplatin-naive non-CSCs and their empty vector controls were treated with 0–50 µM cisplatin, and percentage of surviving cells was graphed. Data are representative of three independent experiments. (G) Relative caspase 3/7 activity of CD55-overexpressing cisplatin-naive cells and empty vector controls after cisplatin treatment. Relative caspase activities in cisplatin treated groups were calculated after normalizing the corrected readings to untreated controls in each group. Data are representative of two independent experiments, and three technical replicates were used in each. *, P < 0.05; **, P < 0.01; ***, P < 0.001. Bars, 100 µm.
Figure 4.
Figure 4.
CD55 localization to lipid rafts is essential for its signaling via ROR2-JNK and LCK pathways. (A) Immunofluorescent staining of cisplatin-naive non-CSCs transduced with CD55 OE, GPI-deficient transmembrane (TM)-CD55, and empty vector control. The arrowheads point to areas where CD55 is not localized to lipid rafts. (B) Graph showing the percentage of CD55–cholera toxin B colocalization. Data are representative of two independent experiments, quantifying >40 cells/group. (C) Complement-mediated cytotoxicity as assessed by the percentage BCECF dye release in A2780 non-CSCs transduced with CD55 OE, TM-CD55, and empty vector control. Data are representative of two independent experiments, and three technical replicates were used. (D) Limiting dilution analysis plots of CD55 empty vector control compared with CD55 OE and TM-CD55 constructs in cisplatin-naive non-CSCs. (E) CD55 OE cisplatin-naive non-CSCs and their empty vector controls were treated with 0–50 μM cisplatin, and percentage surviving cells was graphed. Data are representative of three independent experiments. (F and G) Immunoblots of cisplatin-naive CSCs silenced for CD55 using two shRNA constructs and a nontargeting control were probed with CD55, ROR2, pJNK (T183/Y185), JNK, pLCK (Y394), and LCK. Actin was used as a loading control. Data are representative of two independent experiments. (H and I) Cell lysates from cisplatin-naive non-CSCs transduced with CD55 and empty vector control were probed for CD55, ROR2, pJNK (T183/Y185), JNK, pLCK (Y394), and LCK. Actin was used as a loading control. Data are representative of two independent experiments. (J) Immunoblots of cisplatin-naive non-CSCs transduced with CD55, TM-CD55, and empty vector control were probed with CD55, ROR2, pLCK (Y394), and LCK. Actin was used as a loading control. *, P < 0.05; **, P < 0.01; ***, P < 0.001. Bar, 4 µm.
Figure 5.
Figure 5.
LIME is necessary for intracellular CD55 signaling. (A) Immunoprecipitation (IP) experiments with CD55 antibody were performed in cisplatin-naive CSCs, and eluates were probed for lipid raft adaptor proteins LIME and PAG. (B) Cell lysates from LIME-silenced A2780 CSCs and their nontargeted (NT) controls were immunoblotted and probed with LIME, ROR2, pLCK (Y394), and LCK. Actin was used as loading control. (C) IP experiments with CD55 antibody were performed in LIME-silenced and NT control cisplatin-naive CSCs and eluates were probed for ROR2, pLCK (Y394), LCK, LIME, and CD55. (D) Immunoblots of cisplatin-naive CSCs with LIME-silenced and NT controls were immunoblotted for LIME, NANOG, SOX2, and OCT4. Actin was used as a loading control. (E) Limiting dilution analysis of LIME NT control compared with LIME sh1 and sh2 silencing constructs in cisplatin-naive CSCs. (F) LIME-silenced cisplatin-naive CSCs and their NT controls were treated with 0–50 μM cisplatin, and percentage of surviving cells is graphed. All data are representative of two or three independent experiments. **, P < 0.01; ***, P < 0.001.
Figure 6.
Figure 6.
CD55 signals via ROR2-JNK pathway to regulate self-renewal. (A) Cell lysates from cisplatin-naive CSCs and non-CSCs were immunoblotted for ROR2, pJNK (T183/Y185), and JNK. Actin was used as a loading control. (B) Immunoprecipitation (IP) analysis with CD55 antibody were performed in cisplatin-naive CSCs, and eluates were immunoblotted for ROR2. (C) Immunoblots of ROR2 silenced using two shRNA constructs and nontargeting constructs in cisplatin-naive CSCs for ROR2, pJNK (T183/Y185), JNK, NANOG, SOX2, and OCT4. Actin was used as a loading control. (D) ROR2 silenced and NT controlled A2780 CSCs analyzed by flow cytometry for GFP intensity, which indicates NANOG promoter activity. (E) Limiting dilution analysis of CD55 NT control compared with ROR2 sh1 and sh2 silencing constructs in cisplatin-naive CSCs. (F) ROR2-silenced cisplatin-naive CSCs and their NT controls were treated with 0–50 µM cisplatin, and percentage surviving cells is graphed. All data are representative of two or three independent experiments. ***, P < 0.001.
Figure 7.
Figure 7.
CD55 signals via LCK pathway to drive cisplatin resistance. (A) Cell lysates from cisplatin-naive CSCs and non-CSCs were immunoblotted and probed for pLCK (Y394) and LCK. Actin was used as a loading control. (B) Immunoprecipitation (IP) experiments with CD55 antibody were performed in cisplatin-naive CSCs and eluates were probed for pLCK (Y394) and LCK. (C) CSCs were treated with saracatinib (1 µM) or DMSO and then incubated with 0–50 µM cisplatin, and percentage of surviving cells was analyzed. (D) LCK-overexpressing cisplatin-naive non-CSCs and their empty vector controls were treated with cisplatin, and percentage surviving cells and relative caspase 3/7 activity were graphed. OE, overexpression. (E) Relative caspase 3/7 activity for CD55-overexpressing non-CSCs and their empty vector controls treated with or without cisplatin (2.5–10 µM) and with or without saracatinib (1 µM). (F) Growth curves for CD55-overexpressing non-CSCs and their empty vector controls treated with cisplatin with or without saracatinib. The graph shows growth relative to day 0. All data are representative of two or three independent experiments. (G) Targeted gene expression profiling of 31 genes involved in various mechanisms of cisplatin resistance was performed in cisplatin-naive non-CSCs with CD55 or LCK overexpression, and CSCs with CD55 silenced or LCK inhibited with saracatinib. Empty vector control for non-CSCs and nontargeted control for CSCs. All data are representative of two independent experiments with three technical replicates. *, P < 0.05; **, P < 0.01; ***, P < 0.001.
Figure 8.
Figure 8.
CD55 regulates self-renewal and cisplatin resistance in endometrioid tumors. CD55 is glycophosphatidylinositol (GPI)–anchored to lipid rafts and via LIME binding signals intracellularly to ROR2 and LCK. ROR2 via JNK signaling regulates pluripotency gene expression, namely NANOG, SOX2, and OCT4 to maintain stemness in CSCs. In parallel, CD55 via the LCK pathway promotes the expression of DNA repair genes (including BRCA1 and MLH1) to drive cisplatin resistance.

References

    1. Armstrong D.K., Bundy B., Wenzel L., Huang H.Q., Baergen R., Lele S., Copeland L.J., Walker J.L., Burger R.A., and Gynecologic Oncology G.. Gynecologic Oncology Group . 2006. Intraperitoneal cisplatin and paclitaxel in ovarian cancer. N. Engl. J. Med. 354:34–43. 10.1056/NEJMoa052985 - DOI - PubMed
    1. Baldwin L.A., Huang B., Miller R.W., Tucker T., Goodrich S.T., Podzielinski I., DeSimone C.P., Ueland F.R., van Nagell J.R., and Seamon L.G.. 2012. Ten-year relative survival for epithelial ovarian cancer. Obstet. Gynecol. 120:612–618. 10.1097/AOG.0b013e318264f794 - DOI - PubMed
    1. Cancer Genome Atlas Research Network 2011. Integrated genomic analyses of ovarian carcinoma. Nature. 474:609–615. 10.1038/nature10166 - DOI - PMC - PubMed
    1. Cancer Genome Atlas Research Network 2013. Integrated genomic characterization of endometrial carcinoma. Nature. 497:67–73. 10.1038/nature12113 - DOI - PMC - PubMed
    1. Catasus L., Gallardo A., Cuatrecasas M., and Prat J.. 2009. Concomitant PI3K-AKT and p53 alterations in endometrial carcinomas are associated with poor prognosis. Mod. Pathol. 22:522–529. 10.1038/modpathol.2009.5 - DOI - PubMed