. 2017 Aug 25;357(6353):797-801.
doi: 10.1126/science.aam8577.

Intonational speech prosody encoding in the human auditory cortex

Affiliations

Intonational speech prosody encoding in the human auditory cortex

C Tang et al. Science. .

Abstract

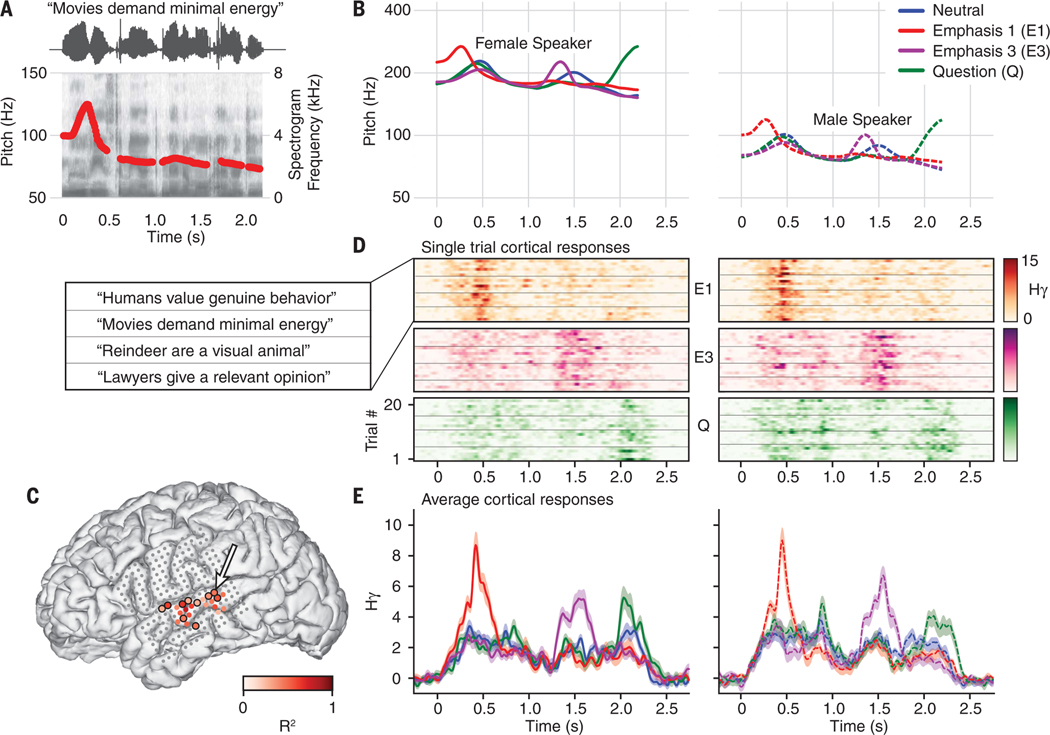
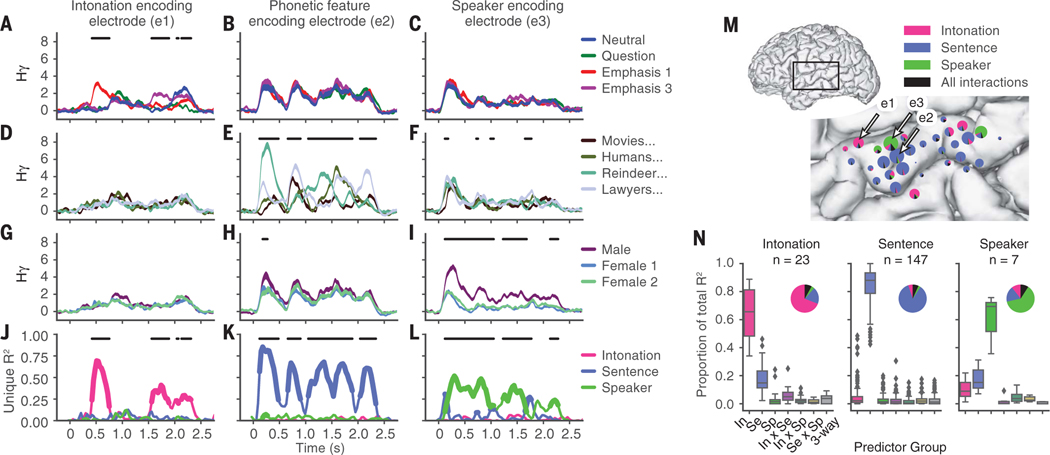
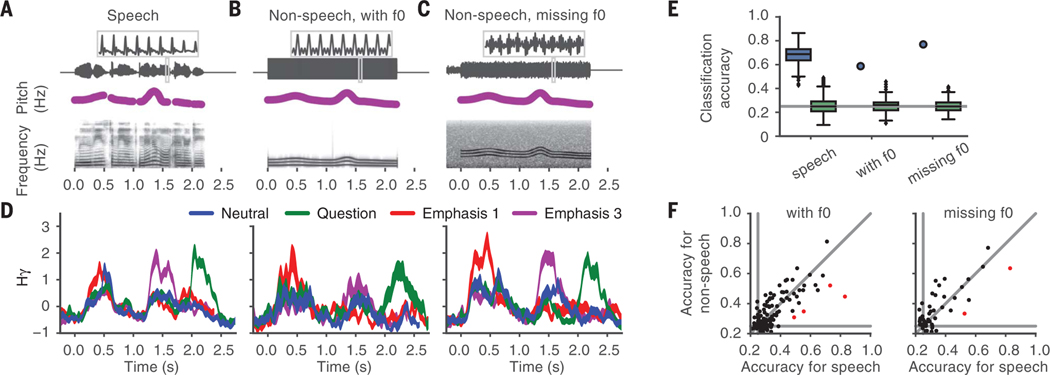
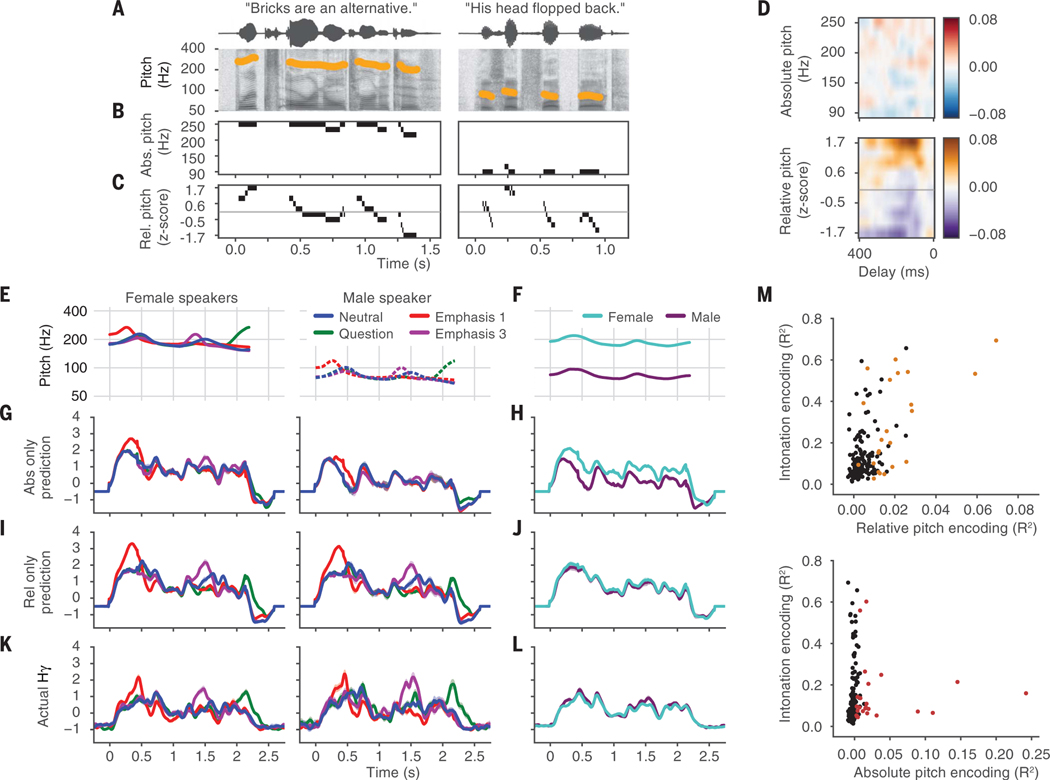
Speakers of all human languages regularly use intonational pitch to convey linguistic meaning, such as to emphasize a particular word. Listeners extract pitch movements from speech and evaluate the shape of intonation contours independent of each speaker's pitch range. We used high-density electrocorticography to record neural population activity directly from the brain surface while participants listened to sentences that varied in intonational pitch contour, phonetic content, and speaker. Cortical activity at single electrodes over the human superior temporal gyrus selectively represented intonation contours. These electrodes were intermixed with, yet functionally distinct from, sites that encoded different information about phonetic features or speaker identity. Furthermore, the representation of intonation contours directly reflected the encoding of speaker-normalized relative pitch but not absolute pitch.


Figures

Fig. 1.
Fig. 1.. Neural activity in the STG differentiates intonational pitch contours.
(A) Stimuli consisted of spoken sentences synthesized to have different intonation contours. This panel depicts an example token with the pitch accent on the first word (emphasis 1), with amplitude signal, spectrogram, and pitch (f0) contour shown. (B) Pitch contours for four intonation conditions, shown for a female speaker (left, solid lines) and a male speaker (right, dashed lines). (C) Electrode locations on a participant’s brain. Color represents the maximum variance in neural activity explained by intonation, sentence, and speaker on electrodes where the full model was significant at more than two time points (omnibus F test; P < 0.05, Bonferroni corrected). Nonsignificant electrodes are shown in gray. Electrodes with a black outline had a significant (F test, P < 0.05, Bonferroni corrected) main effect of intonation. Activity from the indicated electrode (arrow) is shown in (D) and (E). (D) Single-trial responses from the indicated electrode in (C), divided by intonation condition (top, middle, bottom) and speaker (left, right). Horizontal lines within each intonation and speaker pair further divide trials by sentence (legend at left). Hγ, high-γ analytic amplitude z-scored to a silent baseline. (E) Average neural activity within each intonation condition. Average responses (±1 SEM) to a female (left) and male speaker (right) with nonoverlapping absolute-pitch values (B).
Fig. 2.
Fig. 2.. Independent neural encoding of intonation, sentence, and speaker information at single electrodes.
(A to C) Neural response averaged over intonation contour for three example electrodes (mean ± 1 SEM). Neural activity on electrode one (A) differentiates intonation contours, whereas activity on electrodes two (B) and three (C) does not. Black lines indicate time points when means were significantly different between intonation conditions (F test, P < 0.05, Bonferroni corrected). (D to F) Average neural response to each sentence condition for the same electrodes as in (A) to (C). Black lines indicate significant differences between sentence conditions. (G to I) Average neural response to each speaker for the same electrodes as in (A) to (C) and (D) to (F). Black lines indicate significant differences between speaker conditions. (J to L) Unique variance explained by main effects for each example electrode. Bold lines indicate time points of significance for each main effect. Black lines indicate time points when the full model was significant (omnibus F test; P < 0.05, Bonferroni corrected). (M) Map of intonation, sentence, and speaker encoding for one subject. Locations of electrodes one, two, and three are indicated. The area of the pie chart is proportional to the total variance explained. Wedges show the relative variance explained by each stimulus dimension (color) or for pairwise and three-way interactions (black) for each significant electrode. (N) Proportion of variance explained by main effects and interactions across time points when the full model was significant for all significant electrodes across all 10 participants with each electrode classified as either intonation (In), sentence (Se), or speaker (Sp) on the basis of which stimulus dimension was maximally encoded (Tukey box plot). Pie charts show the average proportions of the total variance explained. n, number of electrodes.
Fig. 3.
Fig. 3.. Similar neural responses to intonation in speech and nonspeech contexts.
(A) Acoustic signal, pitch contour, and spectrogram of an example speech token. A portion of the acoustic signal is expanded to show the quasiperiodic amplitude variation that is characteristic of speech. (B)Nonspeechtoken containing energy at the fundamental frequency (f0), with pitch contour matching that in (A).Three bands of spectral power can be seen at the fundamental, second harmonic, and third harmonic. (C) Nonspeech token, with same pitch contour as in (A) and (B), that does not contain f0. Pink noise was added from 0.25 s before the onset of the pitch contour to the pitch contour offset. (D)Average neural response by intonation contour to speech (left), nonspeech with f0 (middle), and nonspeech missing f0 (right) stimuli at an example electrode (mean ± 1 SEM). (E) Classification accuracy of a linear discriminant analysis model fit on neural responses to speech stimuli to predict intonation condition for the electrode represented in (D) (blue; shuffled: green).The accuracy of the speech-trained model on the nonspeech data, both with and without f0, was within the middle 95% of accuracies for speech stimuli. (F) Mean accuracy for speech stimuli versus accuracy for nonspeech stimuli (left: with f0; right: missing f0). Each marker represents a significant electrode from participants who listened to each type of nonspeech stimuli (with f0: N = 8 participants; missing f0: N = 3 participants). Red markers indicate electrodes whose model performance on nonspeech stimuli was below the middle 95% of accuracy values from speech stimuli. Gray lines indicate chance performance at 25% and the unity line.
Fig. 4.
Fig. 4.. Cortical representation of intonation relies on relative-pitch encoding, not absolute-pitch encoding.
(A) Example tokens from the TIMIT speech corpus. (B) Absolute-pitch (ln Hz) feature representation. Bins represent different values of absolute pitch. (C) Relative-pitch (z score of ln Hz within speaker) feature representation. The gray line indicates a relative-pitch value of 0. (D) Pitch temporal receptive field from one example electrode that encoded relative but not absolute pitch (R2relative = 0.03, significant by permutation test; R2 absolute = 0.00, not significant). The receptive field shows which stimulus features drive an increase in the neural response—in this case, high values of relative pitch. Color indicates regression weight (arbitrary units) (E) Pitch contours of the original stimulus set. (F) Average pitch contours for male and female speakers in the original stimulus set across intonation conditions. (G) Prediction of the model fit with only absolute-pitch features. (H) Average predicted response across all male and female tokens from the absolute-pitch–only model. (I) Prediction of the model fit with only relative-pitch features. (J) Average predicted response across all male and female tokens from the relative-pitch–only model. (K) Actual neural responses to original stimulus set (mean ± 1 SEM). The actual response of this electrode was better predicted by the relative-pitch–only model (rrel_pred = 0.85; rabs_pred = 0.66). (L) Actual neural responses averaged over intonation conditions. (M) Scatterplot between relative- and absolute-pitch encoding with neural discriminability of intonation contours, showing that intonation contour discriminability is correlated with relative-pitch encoding but not absolute-pitch encoding (rrelative_intonation = 0.57, P < 1 × 10⁻¹⁶; rabsolute_intonation = 0.03, P > 0.05). Colored markers show electrodes with significant (permutation test; R2 > 95th percentile of null distribution) relative- and absolute-pitch encoding for the top and bottom panels, respectively.

Similar articles

Cited by

References

    1. Cutler A, Dahan D, van Donselaar W, Lang. Speech 40, 141–201 (1997). - PubMed
    1. Ladd DR, Intonational Phonology (Cambridge Univ. Press, 2008).
    1. Shattuck-Hufnagel S, Turk AE, J. Psycholinguist. Res. 25, 193–247 (1996). - PubMed
    1. Titze IR, J. Acoust. Soc. Am. 85, 1699–1707 (1989). - PubMed
    1. Ross ED, Arch. Neurol. 38, 561–569 (1981). - PubMed

Publication types