. 2017 Aug 25;357(6353):802-806.
doi: 10.1126/science.aan4834.

Seasonal cycling in the gut microbiome of the Hadza hunter-gatherers of Tanzania

Affiliations

Seasonal cycling in the gut microbiome of the Hadza hunter-gatherers of Tanzania

Samuel A Smits et al. Science. .

Abstract

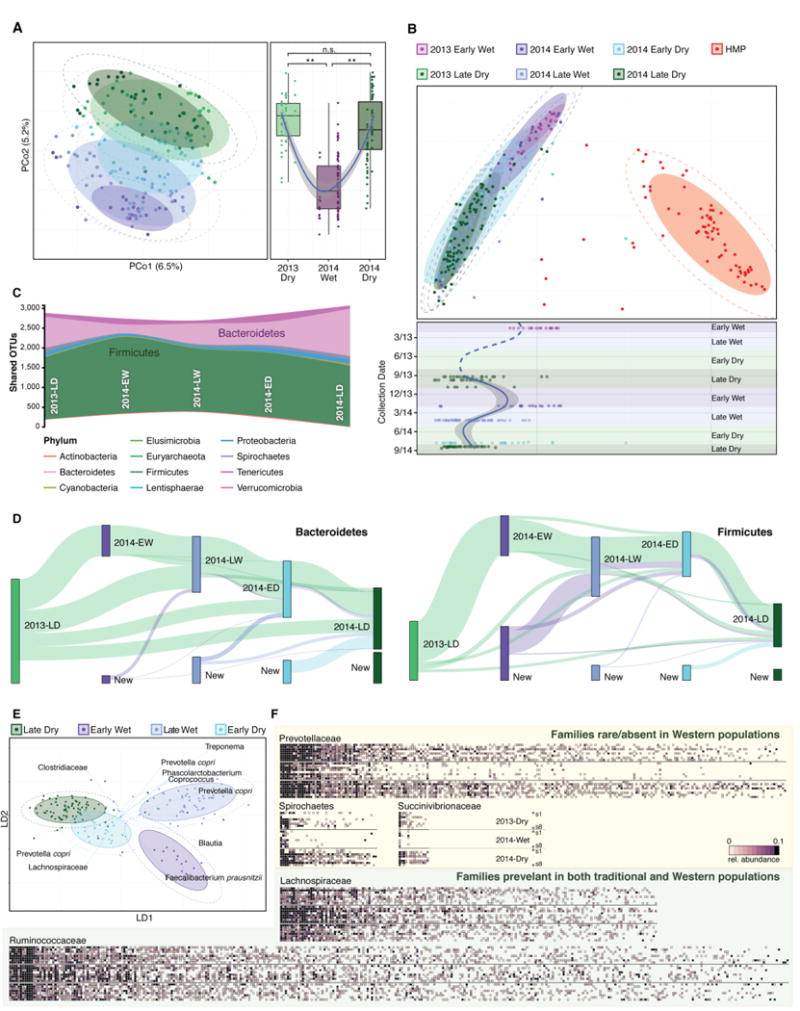
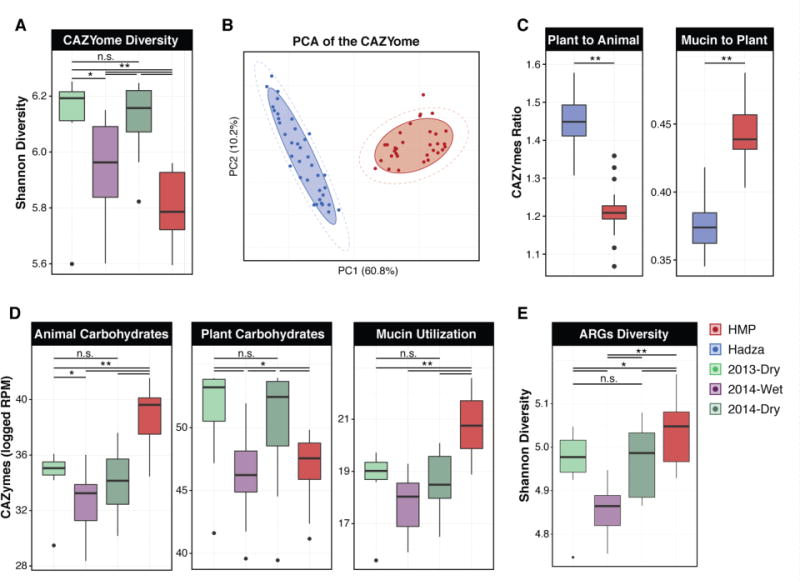
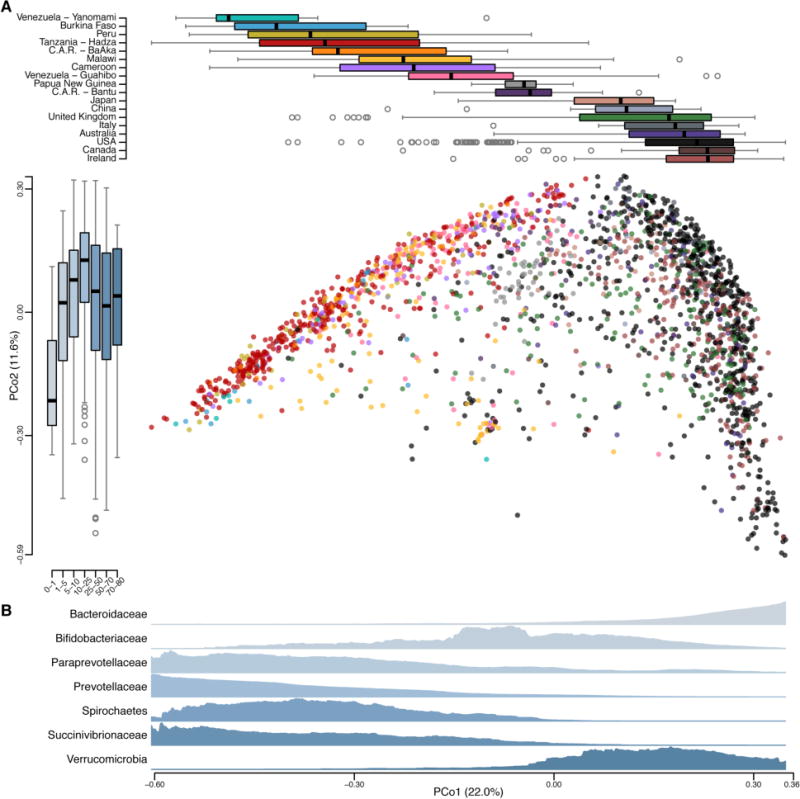
Although humans have cospeciated with their gut-resident microbes, it is difficult to infer features of our ancestral microbiome. Here, we examine the microbiome profile of 350 stool samples collected longitudinally for more than a year from the Hadza hunter-gatherers of Tanzania. The data reveal annual cyclic reconfiguration of the microbiome, in which some taxa become undetectable only to reappear in a subsequent season. Comparison of the Hadza data set with data collected from 18 populations in 16 countries with varying lifestyles reveals that gut community membership corresponds to modernization: Notably, the taxa within the Hadza that are the most seasonally volatile similarly differentiate industrialized and traditional populations. These data indicate that some dynamic lineages of microbes have decreased in prevalence and abundance in modernized populations.


Figures

Fig. 1
Fig. 1. Hadza gut microbial community compositions are cyclic and can be differentiated by season
(A) Individual Hadza gut microbiota compositions in 2013-Late-Dry (n=41, light green), 2014-Early-Wet (n=19, purple), 2014-Late-Wet (n=58, light purple), 2014-Early-Dry (n=30, light blue) and 2014-Late-Dry (n=40, dark green) sub-seasons plotted on an unweighted UniFrac PCoA plot (left panel). Samples collected in the Dry season are distinct from Wet season samples (p<3e-15 and p<3e-16, Wilcoxon), while Dry seasons are indistinct (p=0.15, Wilcoxon) (right panel). (B) Individual Hadza gut microbiota compositions from A (n=188), samples collected in 2013-Early-Wet in a previous Hadza study (19) (n=20, violet) and the Human Microbiome Project (HMP) (n=71, red) are shown on a PCoA plot according to their Bray-Curtis dissimilarity at the family taxonomic level (top panel). The Hadza samples across both studies representing 1.75 years are plotted according to their collection date on the y-axis and their position on the first principal coordinate of the Bray-Curtis PCoA in the top panel on the x-axis. The sub-seasons are labeled and indicated by shading, and Loess regression was applied to these points using the collection date and PCo1 coordinates, and the curve was plotted in blue with a 95% pointwise confidence interval band in gray on the plot using the data within this study. The dashed blue line is a continuation of the regression curve yet is an implied regression curve assuming the appropriate inflection points are captured with data from our study. (C) OTUs that are shared by at least 10 percent of the population within each season are tracked using Sankey plots in both the Bacteroidetes and Firmicutes. The heights of the rectangles indicate the relative number of OTUs and each sub-season has a distinct color. The lines represent the transfer of OTUs between seasons and are colored by the first season of appearance. (D) Linear discriminant analysis (LDA), a supervised learning approach that utilizes a linear combination of features to maximize the separation of classes, successfully separates the sub-seasons. The length and direction of the arrows indicate the normalized scalings for each of the features (OTUs). (E) Heatmaps represent microbiotas from all individuals (n=8) that were sampled across the Wet and both Dry seasons. Along the y-axis of each heatmap individuals are ordered similarly across all three seasons. The top eight rows correspond to the individuals’ microbiotas in 2013-Dry; middle, 2014-Wet; bottom, 2014-Dry. Along the x-axis are unique OTUs that are found in at least 0.1% of the OTUs across the eight individuals and are sorted (left-to-right) by their prevalence across all seasons and are shaded according to the relative abundance of OTUs. The shaded ellipses in all plots represent the 80% confidence interval, the dotted ellipse borders represent the 95% confidence interval. All boxplot distributions are tested using the non-parametric two-sided Wilcoxon rank sum test with Holm correction for multiple hypothesis testing, center values indicate the median and error bars the standard deviation (SD)*, P values < 0.05, ** < 0.01.
Fig. 2
Fig. 2. Hadza gut microbiome functional capacities are cyclic and differentiable by season
(A) Shannon diversity metric applied to CAZYome representation in the metagenomic datasets of Hadza by season and for a healthy American cohort (Human Microbiome Project; HMP). (B) Principal component analysis (PCA), an unsupervised learning approach that utilizes a linear combination of features to maximize the variance of the data in a reduced multivariate space, applied to CAZYomes of Hadza and Americans (HMP). The shaded ellipses represent the 80% confidence interval, the dotted ellipse borders represent the 95% confidence interval. (C) The ratio of CAZYmes represented within the metagenomes related to plant and animal carbohydrate utilization (left) or the ratio of mucin glycan- to plant carbohydrate-utilization (right) in the Hadza and Americans. (D) Representation of CAZYmes in metagenomic datasets related to multiple classes of polysaccharides are plotted by their respective distributions. (E) The distributions of Shannon diversities for antibiotic resistance families across populations identified in metagenomic data. The color key at the top right of the figure applies to all panels. All boxplot distributions are tested using the non-parametric two-sided Wilcoxon rank sum test with Holm correction for multiple hypothesis testing, center values indicate the median and error bars the SD * P values < 0.05, ** < 0.01.
Fig. 3
Fig. 3. Gut microbiotas across geography are distinguishable by lifestyle
(A) Bray-Curtis dissimilarity PCoA (center panel) based on 2064 microbial community compositions described at the family taxonomic level across populations, including the 350 samples from this study. Each circle represents the placement of a microbial community projected in a subspace that maximizes the variance of the underlying taxonomic data; colors correspond to populations in the top panel. Boxplots (top panel) indicate the distribution of each population along the first principal coordinate (PCo1). The boxplots on the left panel depict the distribution of ages (indicated in years) according to their gut microbial community placement on the second principal coordinate (PCo2). Boxplot center values represent the median and error bars represent the SD. (B) Density plots of seven taxa were generated by using a moving average of the abundance of the families within the communities along PCo1, with a scale from zero to the maximum moving average. These seven families were chosen based on a notable trend along PCo1 or basis in the literature.

Comment in

  • Seasonal change in the gut.
    Peddada S. Peddada S. Science. 2017 Aug 25;357(6353):754-755. doi: 10.1126/science.aao2997. Epub 2017 Aug 24. Science. 2017. PMID: 28839060 No abstract available.

References

    1. Hooper LV, Littman DR, Macpherson AJ. Interactions between the microbiota and the immune system. Science. 2012;336:1268–1273. - PMC - PubMed
    1. Sonnenburg JL, Backhed F. Diet-microbiota interactions as moderators of human metabolism. Nature. 2016;535:56–64. - PMC - PubMed
    1. Mayer EA, Knight R, Mazmanian SK, Cryan JF, Tillisch K. Gut microbes and the brain: paradigm shift in neuroscience. The Journal of Neuroscience. 2014;34:15490–15496. - PMC - PubMed
    1. Caspi R, et al. The MetaCyc database of metabolic pathways and enzymes and the BioCyc collection of pathway/genome databases. Nucleic Acids Research. 2016;44:D471–480. - PMC - PubMed
    1. Goodrich JK, Davenport ER, Waters JL, Clark AG, Ley RE. Cross-species comparisons of host genetic associations with the microbiome. Science. 2016;352:532–535. - PMC - PubMed

Publication types