. 2017 Sep 12;114(37):E7776-E7785.
doi: 10.1073/pnas.1707381114. Epub 2017 Aug 24.

Imaging the emergence and natural progression of spontaneous autoimmune diabetes

Affiliations

Imaging the emergence and natural progression of spontaneous autoimmune diabetes

James F Mohan et al. Proc Natl Acad Sci U S A. .

Abstract

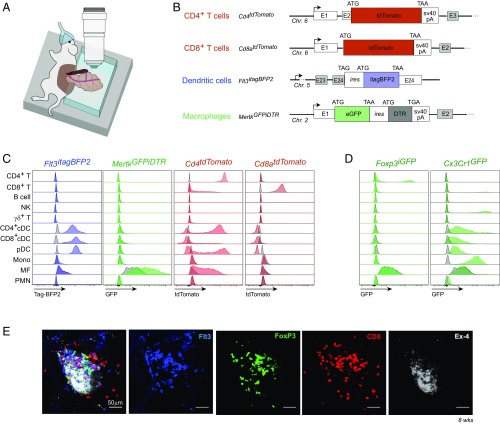
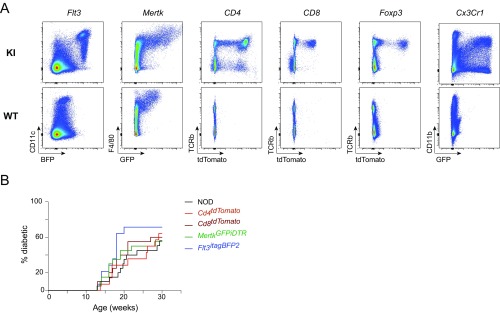
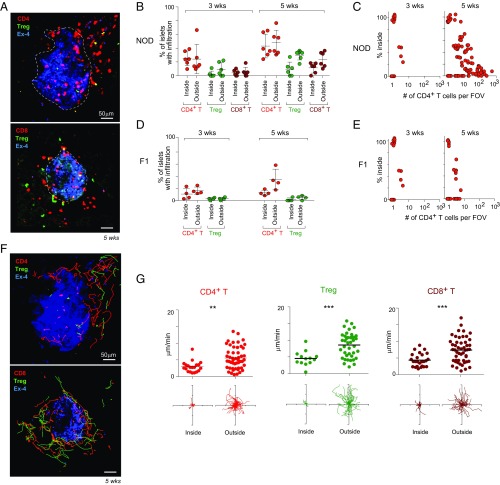
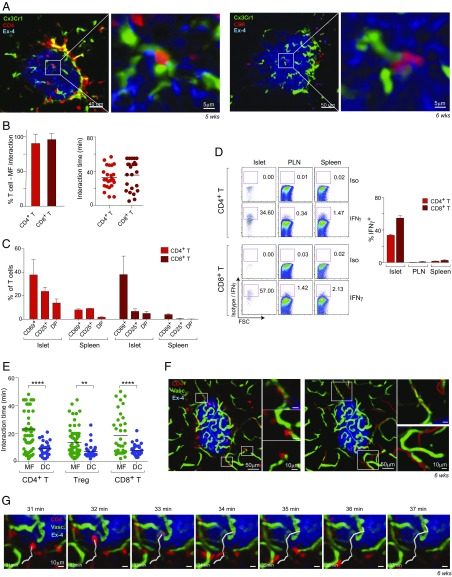
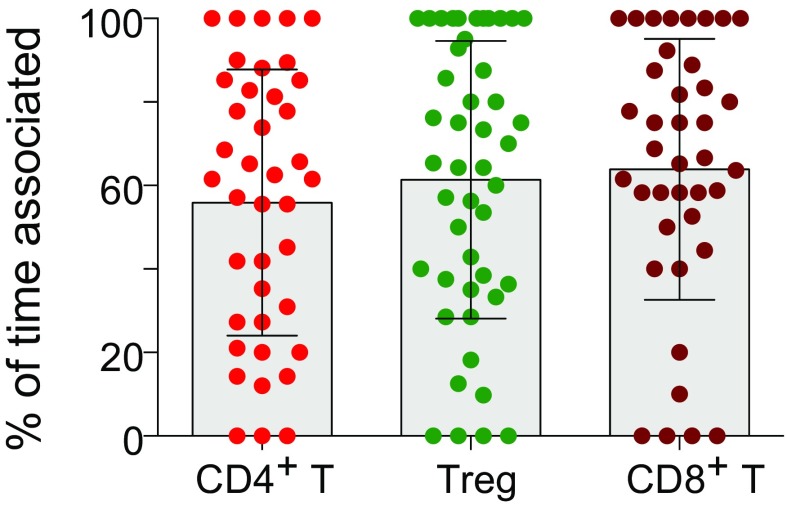
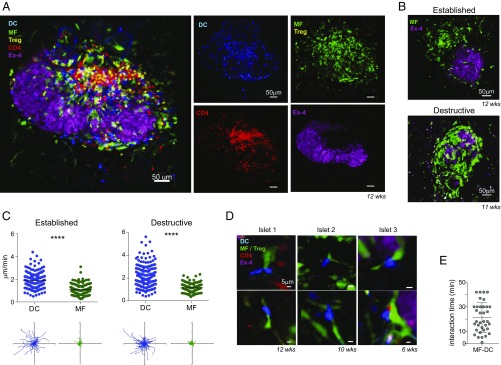
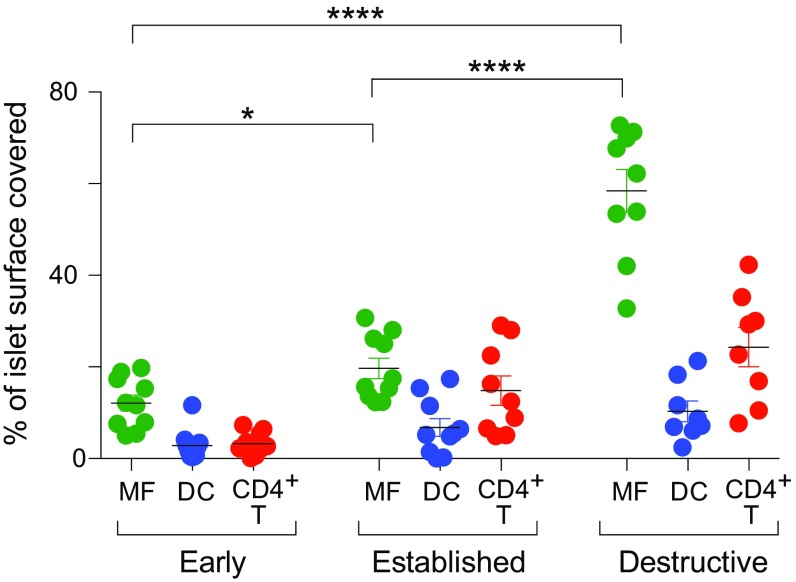
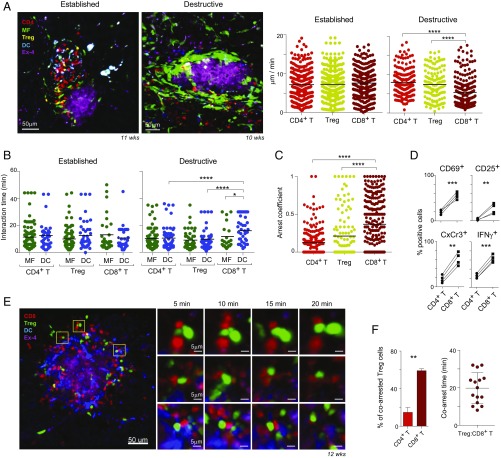
Type 1 diabetes in the nonobese diabetic mouse stems from an infiltration of the pancreatic islets by a mixed population of immunocytes, which results in the impairment and eventual destruction of insulin-producing β-cells. Little is known about the dynamics of lymphocyte movement in the pancreas during disease progression. Using advanced intravital imaging approaches and newly created reporter mice (Flt3-BFP2, Mertk-GFP-DTR, Cd4-tdTomato, Cd8a-tdTomato), we show that the autoimmune process initiates first with a T cell infiltration into the islets, where they have restricted mobility but reside and are activated in apposition to CX3CR1+ macrophages. The main expansion then occurs in the connective tissue outside the islet, which remains more or less intact. CD4+ and CD8+ T cells, Tregs, and dendritic cells (DCs) are highly mobile, going along microvascular tracks, while static macrophages (MF) form a more rigid structure, often encasing the islet cell mass. Transient cell-cell interactions are formed between T cells and both MFs and DCs, but also surprisingly between MFs and DCs themselves, possibly denoting antigen transfer. In later stages, extensive islet destruction coincides with preferential antigen presentation to, and activation of, CD8+ T cells. Throughout the process, Tregs patrol the active compartments, consistent with the notion that they control the activation of many cell types.

Keywords: autoimmunity; diabetes; immunoregulation.


Conflict of interest statement

The authors declare no conflict of interest.

Figures

Fig. 1.
Fig. 1.
Intravital imaging of immune cell dynamics within the pancreatic infiltrate during disease progression. (A) Overview of the intravital imaging set-up for exteriorized pancreas. (B) Schematic of reporter insertions into the CD4, CD8a, Flt3, and Mertk loci in NOD mice generated by CRISPR/Cas9 germline engineering. (C) Histograms depicting fluorescent protein expression among various splenocyte populations from 6-wk-old Flt3-BFP2 (blue), Mertk-GFP (green), Cd4-tdTomato (red), and Cd8a-tdTomato (red) compared with negative controls (gray). Gating strategies for individual populations detailed in SI Materials and Methods. (D) Reporter expression in Foxp3-GFP (green) and CX3CR1-GFP (green) splenocyte populations compared with negative controls (gray). (E) Representative IVM image of an infiltrated islet in an 8-wk-old female CD8-Foxp3-Flt3 trireporter mouse injected with Ex-4 SeTau 647.
Fig. S1.
Fig. S1.
Fluorescence profiles and diabetes incidence in NOD reporter lines. (A) Flow cytometric plots of KI (Upper) or WT (Lower) splenocytes depicting overview of fluorescence expression among total splenocytes. (B) Diabetes incidence in female NOD (n = 20), CD4-tdTomato (n = 14), CD8a-tdTomato (n = 20), Mertk-GFP (n = 20), and Flt3-BFP2 (n = 14).
Fig. 2.
Fig. 2.
Monitoring early T cell infiltration into the pancreas. (A) Representative IVM images of infiltrating T cells in 5-wk-old female Cd4-tdTomato/Foxp3-GFP and Cd8a-tdTomato/Foxp3-GFP reporter mice showing the localization of infiltrating T cells both inside and outside of the islet (delineated by dotted lines). (B) Quantitation of islet infiltration from ex vivo imaging of pancreata from 3- and 5-wk-old female Cd4-tdTomato/Foxp3-GFP and Cd8a-tdTomato/Foxp3-GFP mice. Each dot represents an individual mouse. (C) Frequency of CD4+ T cells that localize within islets vs. the total number of T cells present within the corresponding lesion of infiltrated islets in 3- and 5-wk-old female Cd4-tdTomato reporter mice. Each dot represents an individual islet, data pooled from four to six mice. (D) Quantitation of islet infiltration from ex vivo imaging of pancreata from 3- and 5-wk-old F1 (B6 × NOD) CD4-tdTomato/Foxp3-GFP females. Each dot represents an individual mouse. (E) Frequency of CD4+ T cells that localize within islets vs. the total number of T cells present within the corresponding lesion of infiltrated islets in 3- and 5-wk-old female F1 (B6xNOD) Cd4-tdTomato reporter mice. Each dot represents an individual islet, data pooled from four to six mice. (F) Representative images depicting the migratory tracks for CD4 T cells (Upper, red lines) CD8 T cells (Lower, red lines) and Tregs (green lines) over the course of imaging. Data correspond with cells depicted in A. (G) Quantitation of cellular velocities and displacement profiles for T cells segregated based on location inside or outside of the islet. Flower plots represent migration over 10 min. (Scale bar, 100 μm.). Data pooled from three to five mice (5-wk-old) per cell type. Error bars, SD. **P < 0.005; ***P < 0.0005.
Fig. 3.
Fig. 3.
Early T cell migration, interaction with APCs, and activation. (A) Representative time-lapse images depicting prolonged contact between T cells with islet resident MFs; white box indicates enlargements. (B) Quantitation of the overall proportion (Left) and duration (Right) of interactions between intraislet CD4+ or CD8+ T cells and islet resident MFs. (C) CD69 and CD25 expression on T cells from isolated islets and spleens of 5-wk-old NOD females; DP indicates frequency of cells expressing both CD69 and CD25. (D) IFN-γ expression in T cells restimulated ex vivo from isolated islets, pancreatic lymph nodes (PLN), or spleen. (E) Quantitation of early T cell interactions with MF and DC outside of the islet. (F) Representative IVM images depicting T cells associated with the vasculature (Left) and randomly selected examples of T cell migration tracks (Right). Boxes indicate regions shown at Right. (G) Representative time-lapse image series of a CD4+ T cell migrating into an islet from the surrounding area. Error bars, SD. **P < 0.005; ****P < 0.0005.
Fig. S2.
Fig. S2.
Pancreas-infiltrating T cells migrate along the vascular network. T cells were analyzed for the proportion of time they were in contact with the endothelium during active migration.
Fig. 4.
Fig. 4.
MF and dendritic cell dynamics in advanced insulitic lesions. (A) Representative IVM image of multicellular florid insulitis in a 12-wk-old female Cd4-tdTomato/Foxp3-GFP/Mertk-GFP/Flt3-BFP2 reporter mouse (Left); (Right) individual channels are shown. (B) Representative images illustrating the distribution of MFs in established insulitic lesions (Upper) and destructive lesions (Lower). (C) Quantitation of DC and MF migration velocities and displacement during established and destructive insulitic lesions. Flower plots represent migration over 10 min. (Scale bar, 50 μm.) (D) Images of inflamed islets from three independent mice depicting prolonged interactions between DC and MF. (E) Duration of MF/DC interactions. Data pooled from five mice. Error bars, SD. ***P < 0.0005.
Fig. S3.
Fig. S3.
Significant accumulation of MFs around the islet perimeter during destructive insulitis. The proportion of the islet perimeter surface area that was covered by either MFs, DCs, or CD4+ T cells during the various stages of disease. *P < 0.05; ****P < 0.0005.
Fig. 5.
Fig. 5.
T cell dynamics in advanced insulitic lesions. (A) Representative IVM images of established and destructive insulitis (Left) of bone-marrow–reconstituted female mice (20% Cd4-tdTomato/Foxp3-GFP/Flt3-BFP2 and 80% Mertk-GFP input). Quantitation of T cell velocities within established and destructive insulitic lesions (Right). (B) Duration of T cell interactions with MF and DC within established and advanced lesions. (C) Arrest coefficients for different T cells within destructive insultic lesions. (D) Percentage, among CD4+ or CD8+ T cells from the pancreas of 12-wk-old NOD females, of cells expressing CD69, CD25, Cxcr3, and IFN-γ, as determined by flow cytometry. (E) Representative IVM image depicting Treg and CD8+ T cell coarrest during destructive insulitis. Boxes indicate regions shown on Right over time. (F) Frequency and duration of Treg coarrest with CD4+ or CD8+ T cells. Data pooled from three to six female mice. Error bars, SD. *P < 0.05; **P < 0.005; ***P < 0.0005; ****P < 0.0005.

References

    1. Wållberg M, Cooke A. Immune mechanisms in type 1 diabetes. Trends Immunol. 2013;34:583–591. - PubMed
    1. Anderson MS, Bluestone JA. The NOD mouse: A model of immune dysregulation. Annu Rev Immunol. 2005;23:447–485. - PubMed
    1. Sitrin J, Ring A, Garcia KC, Benoist C, Mathis D. Regulatory T cells control NK cells in an insulitic lesion by depriving them of IL-2. J Exp Med. 2013;210:1153–1165. - PMC - PubMed
    1. Serreze DV, et al. B lymphocytes are essential for the initiation of T cell-mediated autoimmune diabetes: Analysis of a new “speed congenic” stock of NOD.Ig μ null mice. J Exp Med. 1996;184:2049–2053. - PMC - PubMed
    1. Jansen A, et al. Immunohistochemical characterization of monocytes-macrophages and dendritic cells involved in the initiation of the insulitis and beta-cell destruction in NOD mice. Diabetes. 1994;43:667–675. - PubMed

Publication types

MeSH terms