. 2017 Sep 12;114(37):E7688-E7696.
doi: 10.1073/pnas.1703507114. Epub 2017 Aug 24.

Quantitative tests of a reconstitution model for RNA folding thermodynamics and kinetics

Affiliations

Quantitative tests of a reconstitution model for RNA folding thermodynamics and kinetics

Namita Bisaria et al. Proc Natl Acad Sci U S A. .

Abstract

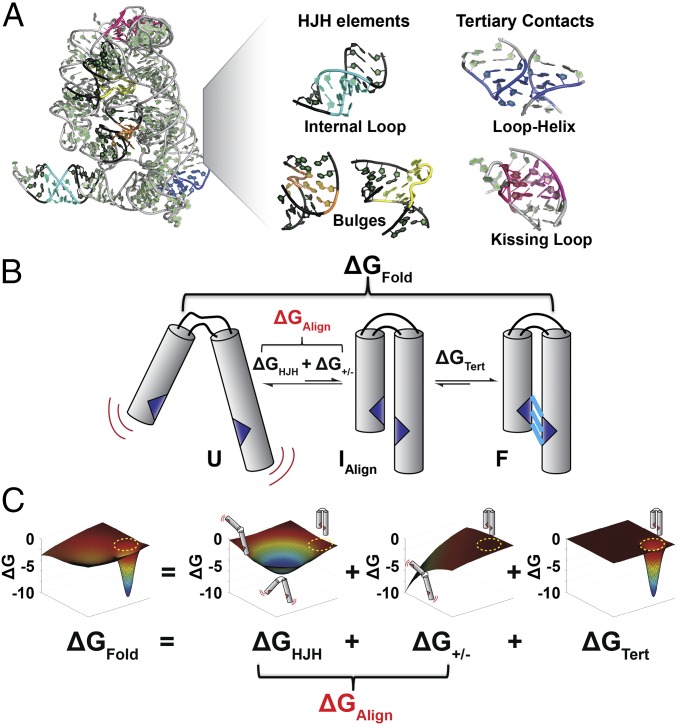
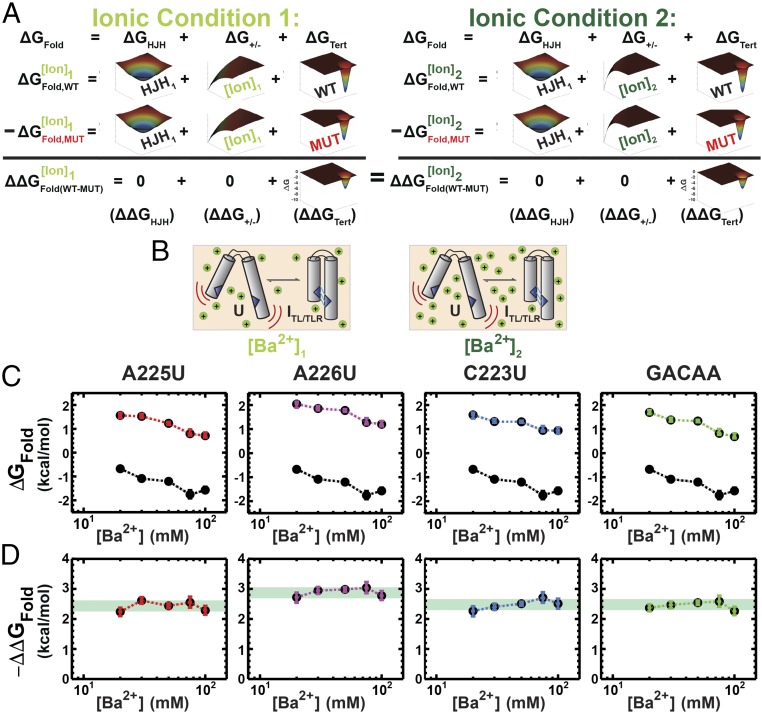
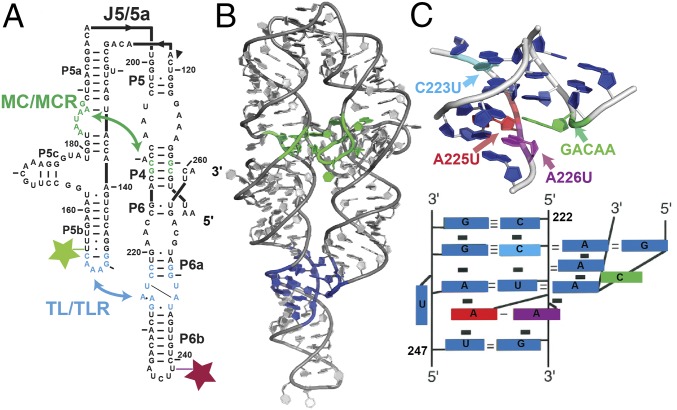
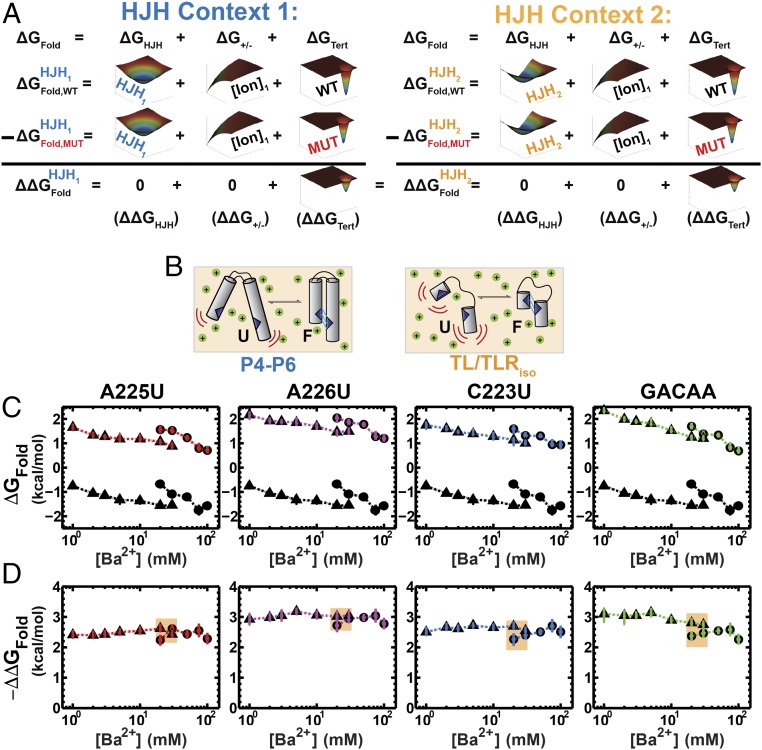
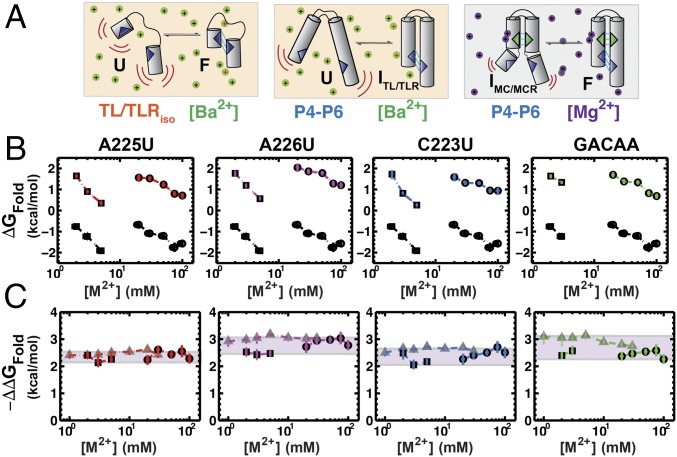
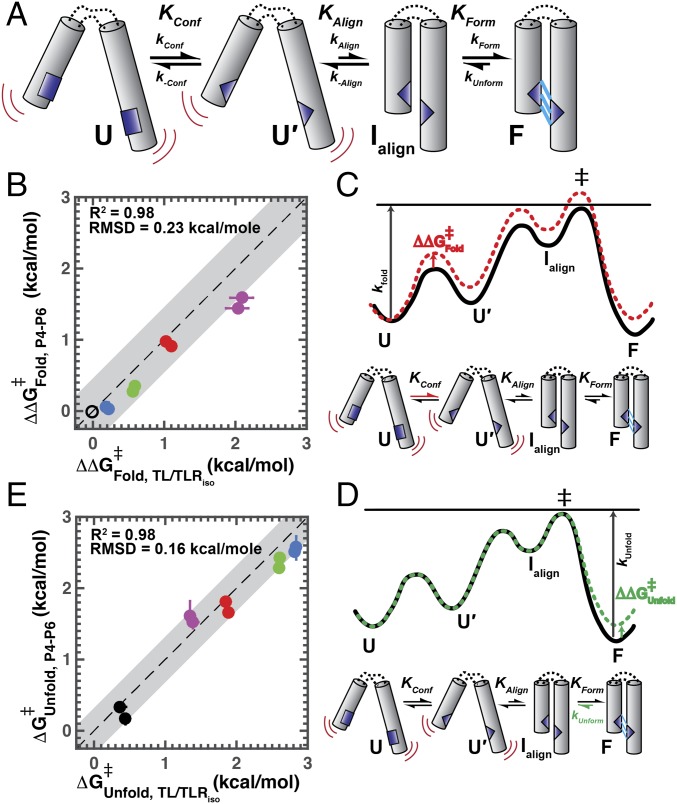
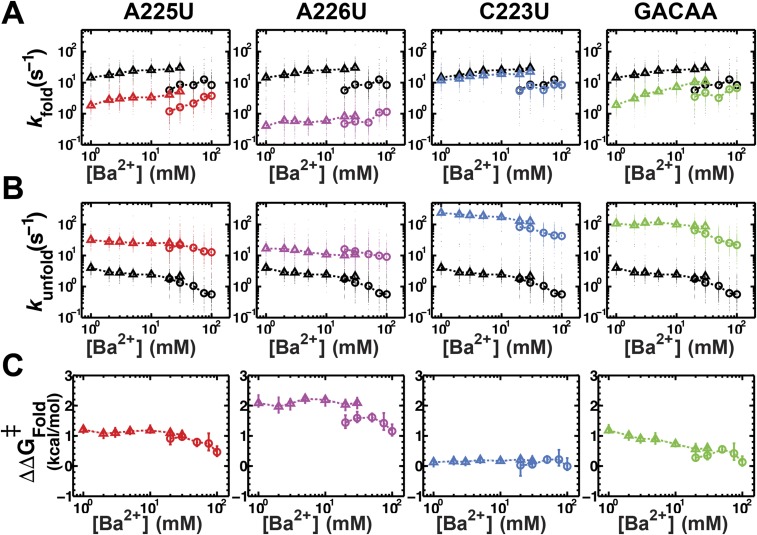
Decades of study of the architecture and function of structured RNAs have led to the perspective that RNA tertiary structure is modular, made of locally stable domains that retain their structure across RNAs. We formalize a hypothesis inspired by this modularity-that RNA folding thermodynamics and kinetics can be quantitatively predicted from separable energetic contributions of the individual components of a complex RNA. This reconstitution hypothesis considers RNA tertiary folding in terms of ΔGalign, the probability of aligning tertiary contact partners, and ΔGtert, the favorable energetic contribution from the formation of tertiary contacts in an aligned state. This hypothesis predicts that changes in the alignment of tertiary contacts from different connecting helices and junctions (ΔGHJH) or from changes in the electrostatic environment (ΔG+/-) will not affect the energetic perturbation from a mutation in a tertiary contact (ΔΔGtert). Consistent with these predictions, single-molecule FRET measurements of folding of model RNAs revealed constant ΔΔGtert values for mutations in a tertiary contact embedded in different structural contexts and under different electrostatic conditions. The kinetic effects of these mutations provide further support for modular behavior of RNA elements and suggest that tertiary mutations may be used to identify rate-limiting steps and dissect folding and assembly pathways for complex RNAs. Overall, our model and results are foundational for a predictive understanding of RNA folding that will allow manipulation of RNA folding thermodynamics and kinetics. Conversely, the approaches herein can identify cases where an independent, additive model cannot be applied and so require additional investigation.

Keywords: RNA folding; RNA tertiary structure; folding kinetics; folding thermodynamics; single-molecule FRET.


Conflict of interest statement

The authors declare no conflict of interest.

Figures

Fig. 1.
Fig. 1.
Building blocks of structured RNAs and the reconstitution hypothesis. (A) Crystal structure of the group II intron with representative RNA tertiary structure building blocks highlighted (73). Tertiary elements include HJH elements, with helices in black and junctions colored: internal loop (cyan), bulges (orange and yellow), and tertiary contacts, loop-helix (blue) and kissing-loop (magenta). (B) The overall folding (ΔGFold) of a simple HJH element with a single tertiary contact (blue) is shown to illustrate the reconstitution hypothesis. The first folding step involves a search for the conformational states in which tertiary contact partners are aligned and can form (ΔGAlign). This step can be further separated into the contributions due to the orientational preferences of the HJH elements connecting the two helices (ΔGHJH) and the electrostatic forces that bias the conformational ensemble of the HJH element to favor more extended conformations (ΔG+/−). The second step in folding involves formation of the tertiary contact (ΔGTert) that stabilizes the folded state F. (C) The reconstitution hypothesis posits that the overall folding of a HJH element (ΔGFold) is the sum of the energetic contributions from the HJH elements, electrostatics, and tertiary contact formation (ΔGFold = ΔGHJH + ΔG+/− + ΔGTert). Each energetic contribution is figuratively depicted by a 3D free energy landscape, and these landscapes are summed to give the overall folding energetics. Free energy diagrams were generated in Matlab to qualitatively depict the folding landscape. The x–y plane represents all possible states of the HJH element, and encircled in yellow is the ensemble of states in which the tertiary contact is aligned to form. The value on the z axis is free energy represented by ΔG = −RTln(Ki), where Ki is the ratio of being in the aligned state relative to all other states. Illustrative conformations for the HJH element are shown above each free energy landscape.
Fig. 2.
Fig. 2.
Predicted and observed effects of changing the ion environment on the folding effects of point mutants in a tertiary contact. (A) The reconstitution hypothesis predicts that the effects of a mutation in a tertiary contact (ΔΔGFold = ΔGWT − ΔGMut) should be the same under different electrostatic conditions [e.g., [Ba2+]1 (Left) vs. [Ba2+]2 (Right)], as the different electrostatic conditions are posited to only alter ΔG+/−. This effect is depicted by a different distribution for ΔG+/− (only) in the two contexts. Mutation in a tertiary contact leads to a smaller contribution of ΔGTert to overall folding, as shown by a relatively smaller peak in the negative free energy relative to that of WT solely for ΔGTert. As depicted, ΔΔGFold (i.e., the effect of a mutation) is predicted to be the same in the two salt conditions. (B) Schematic for P4–P6 folding in Ba2+, whereby different Ba2+ concentrations modulate folding. (C) Folding across a range of Ba2+ concentrations (20–100 mM), for TL/TLR point mutants; colors designate the mutation measured and are defined in Fig. 3. WT folding at each concentration is shown in black and repeated in each panel. Errors represent the 95% confidence interval of the mean determined by bootstrapping (Methods; data in Table S1). (D) The effect of the mutation relative to WT folding, ΔΔGFold,(WT−Mut) versus Ba2+. Light green overlays designate the ΔΔGFold,(WT–Mut) range for each mutant.
Fig. 3.
Fig. 3.
P4–P6 RNA structure and point mutations. (A) Secondary structure of the P4–P6 RNA. Two tertiary contacts, the MC/MCR (green) and the TL/TLR (blue), are highlighted. (B) Tertiary structure of the P4–P6 RNA. The tertiary contacts are colored as in A [Protein Data Bank (PBD) ID code 1GID] (36). (C) Tertiary structure and schematic of the TL/TLR highlighting the residues that were mutated and studied herein: A225U (red), A226U (magenta), C223U (cyan), and GACAA (green); these colors are used throughout. A225U, A226U, and C223U are point mutations in the receptor, and GACAA is an insertion in the tetraloop.
Fig. 4.
Fig. 4.
Comparison of the effect of TLR mutations in P4–P6 RNA and the TL/TLRiso construct. (A) The reconstitution hypothesis predicts that the effects of a mutation in a tertiary contact (ΔΔGFold = ΔGWT − ΔGMut) will be the same in different structural contexts [HJH1 (Left) vs. HJH2 (Right)]. Mutation in a tertiary contact leads to a lower probability for formation of the tertiary contact and thus a less negative value of ΔGTert and weaker overall folding, without affecting the other free energy terms. (B) Depiction of P4–P6 folding (Left) versus the TL/TLRiso (Right) in Ba2+. (C) Folding across a range of Ba2+ concentrations (1–100 mM) for P4–P6 (circles) and TL/TLRiso (triangles); colors correspond to point mutations in the TL/TLR as in Fig. 3C, and the black points repeated in each panel are for WT P4–P6 and WT TL/TLRiso. Data are provided in Tables S1 and S2. (D) The effect of the mutation relative to WT (ΔΔGFold,(WT–Mut) = ΔGWT − ΔGMut) versus Ba2+ for P4–P6 (circles) and the TL/TLRiso (triangles). Tan overlay designates the overlapping Ba2+ concentrations where the ΔΔGFold,(WT−Mut) values can be directly compared. Errors represent the 95% confidence interval of the mean determined by bootstrapping (Methods).
Fig. 5.
Fig. 5.
Effect of HJH changes on the effect of TL/TLR point mutants. (A) Depiction of TL/TLRiso (Left) folding in Ba2+, P4–P6 folding in Ba2+ (Middle), and P4–P6 folding in Mg2+ (Right). In Ba2+ only, the TL/TLR forms in P4–P6, whereas both the MC/MCR and the TL/TLR form in Mg2+ (38). The formation of the MC/MCR changes the structural connectivity between the TL and TLR and thus the alignment term of the reconstitution hypothesis (ΔGalign; Fig. 2B and Eq. 1). (B) P4–P6 folding across a range of Ba2+ concentrations (circles; 20–100 mM) and Mg2+ concentrations (squares; 1–3 mM), for point mutations in the TL/TLR; colors are as in Fig. 3. Data are presented in Tables S1 and S2. (C) The effect of each mutation relative to WT (ΔΔGFold) for P4–P6 in Ba2+ (circles) and Mg2+ (squares) and for the TL/TLRiso in Ba2+ (triangles). Purple overlay designated the variation in the ΔΔG values for each mutant in all three HJH contexts. Errors represent the 95% confidence interval of the mean determined by bootstrapping (Methods).
Fig. 6.
Fig. 6.
Kinetic effects of tertiary contact mutations on folding processes. (A) Simple kinetic model for tertiary contact formation based on the diffusion–collision model for RNA folding (21). Folding rates and equilibria for tertiary contact formation are composed of three steps: conformational change of tertiary contact elements to a tertiary-ready state, alignment of tertiary contact elements, and formation of the tertiary interactions between tertiary elements. Comparison of the effects on folding (B) and absolute unfolding (E) rate constants (ΔΔGFold and ΔGUnfold; see Methods) for TL/TLR mutations in P4–P6 versus TL/TLRiso (colors as in Fig. 1). Measurements were made at 20 and 30 mM Ba2+. Error bars represent propagation of the 95% confidence interval of the mean determined by bootstrapping. Reported is the rmsd to the fit of the data to the model y = x + b (Methods; data are presented in Tables S1 and S2) and is denoted in gray outline. Free energy diagrams depicting hypothesized effects on overall folding (C) and unfolding (D) rate constants. Effects on kFold (B) are consistent with effects on the conformational change of tertiary contact partners before formation of the tertiary contact (kConf), as depicted in the free energy diagram in C. Effects on kUnfold (D) are consistent with tertiary contact breaking as the rate-limiting transition in unfolding (kUnform), as depicted in the free energy diagram in (D).
Fig. S1.
Fig. S1.
Folding kinetics of TL/TLR mutations in TL/TLRiso and P4–P6 RNA. Folding (A) and unfolding (B) rate constants of each mutant (colors as in Fig. 1) and WT (black; repeated in each panel) RNA across Ba2+ concentration for TL/TLRiso (open triangles) and P4–P6 (open circles). The rate constant values of each individual molecule under each condition are shown in small circles. Data are presented in Tables S1 and S2. (C) The effect of each mutant on the folding rate constant (ΔΔGFold; see Methods) relative to the WT folding rate constant across [Ba2+] in the TL/TLRiso (open triangles) and P4–P6 (open circles). Errors represent the 95% confidence interval of the mean determined by bootstrapping (Methods).

References

    1. Cech TR, Steitz JA. The noncoding RNA revolution-trashing old rules to forge new ones. Cell. 2014;157:77–94. - PubMed
    1. Moore MJ. From birth to death: The complex lives of eukaryotic mRNAs. Science. 2005;309:1514–1518. - PubMed
    1. Staley JP, Guthrie C. Mechanical devices of the spliceosome: Motors, clocks, springs, and things. Cell. 1998;92:315–326. - PubMed
    1. Noller HF. RNA structure: Reading the ribosome. Science. 2005;309:1508–1514. - PubMed
    1. Aitken CE, Puglisi JD. Following the intersubunit conformation of the ribosome during translation in real time. Nat Struct Mol Biol. 2010;17:793–800. - PMC - PubMed

Publication types

LinkOut - more resources