. 2017 Aug 24;7(1):9351.
doi: 10.1038/s41598-017-07753-0.

A novel approach to low-temperature synthesis of cubic HfO2 nanostructures and their cytotoxicity

Affiliations

A novel approach to low-temperature synthesis of cubic HfO2 nanostructures and their cytotoxicity

Neeraj Kumar et al. Sci Rep. .

Abstract

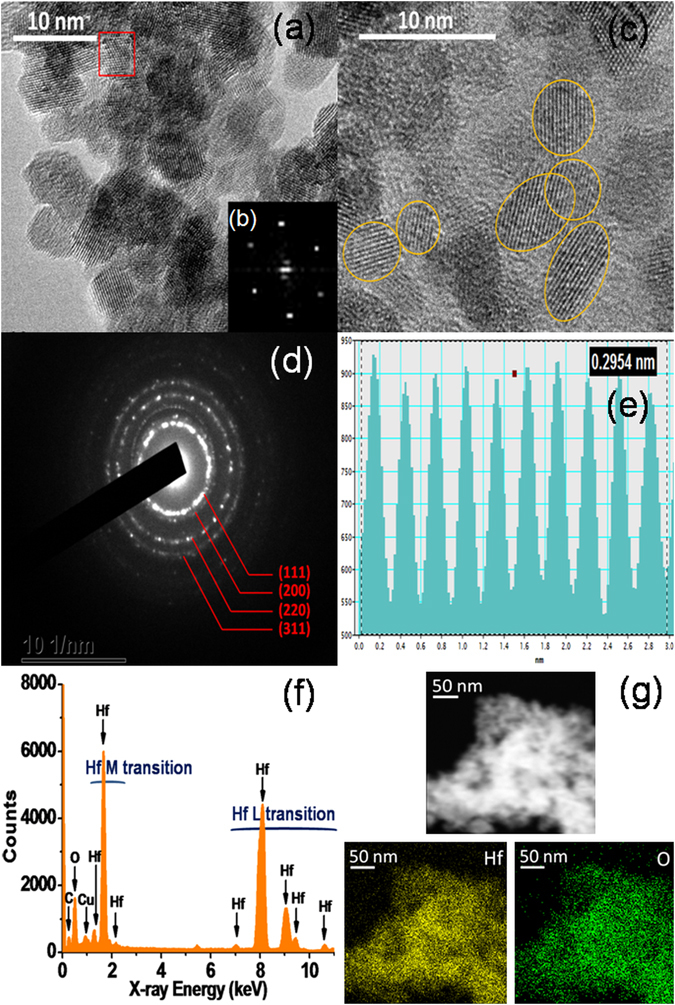
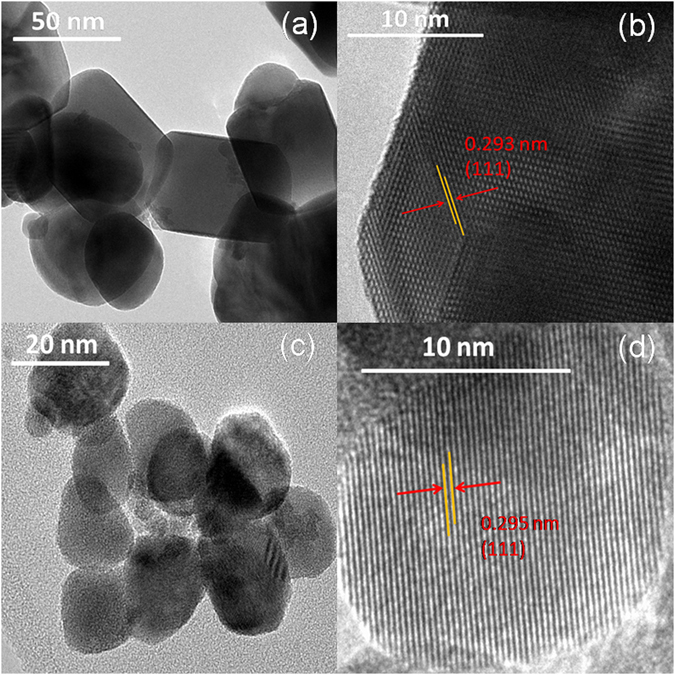
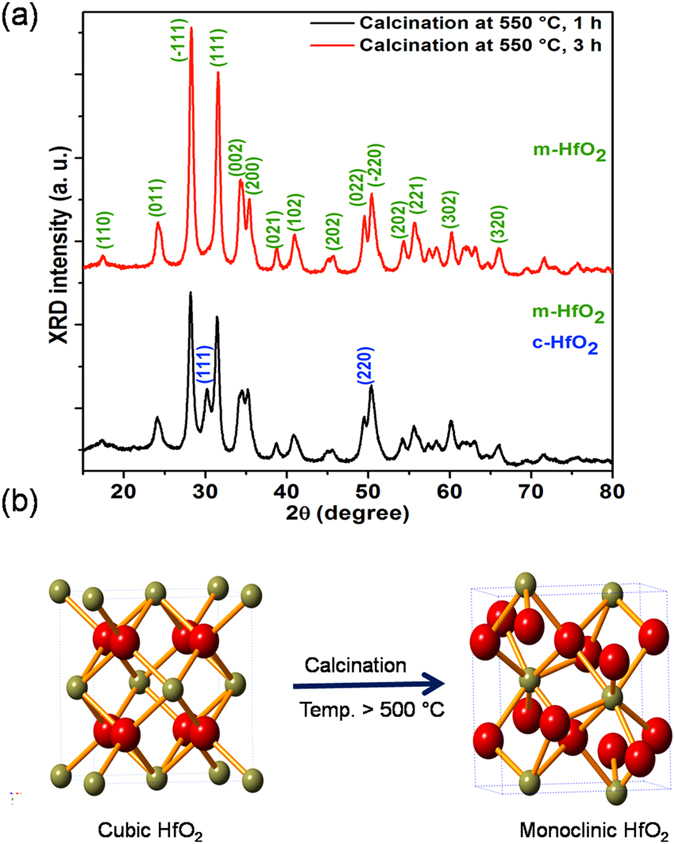
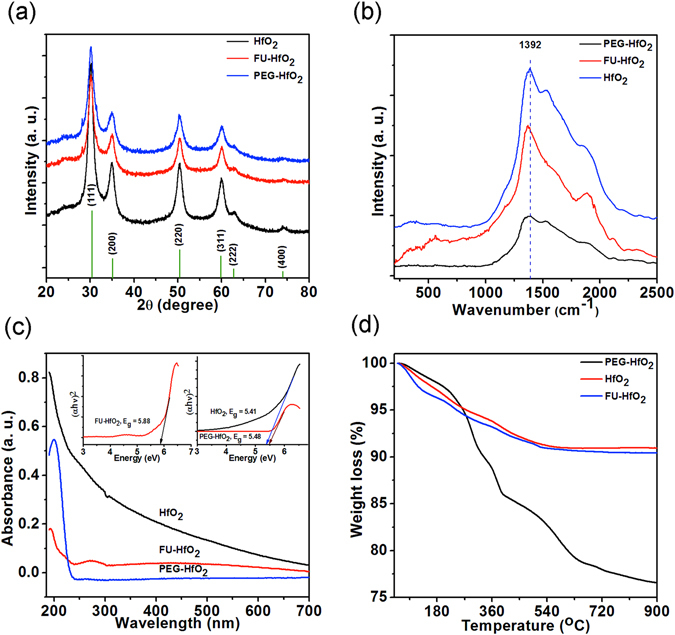
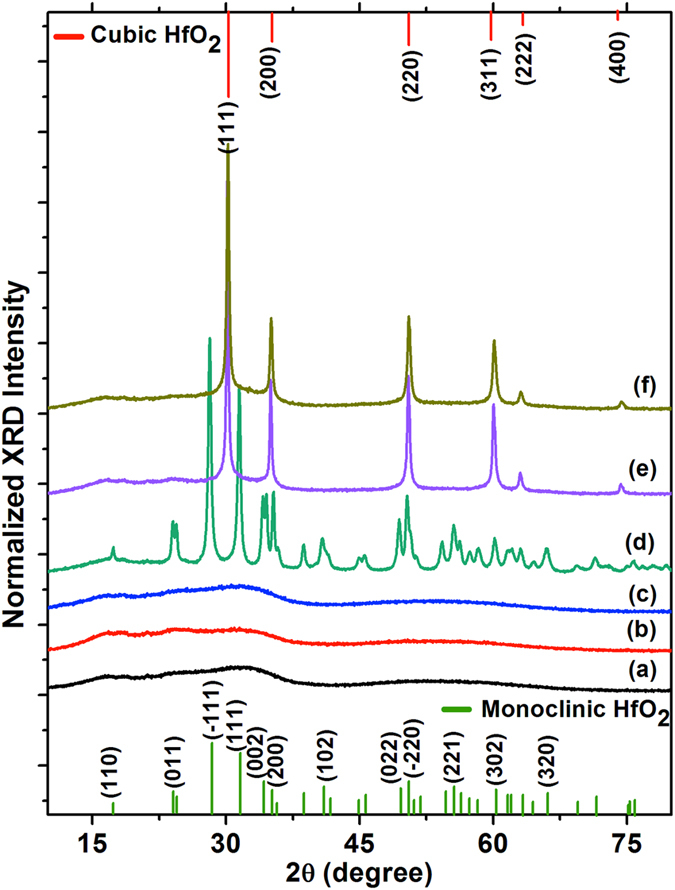
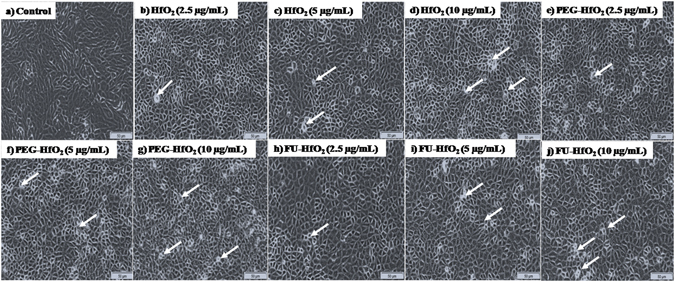
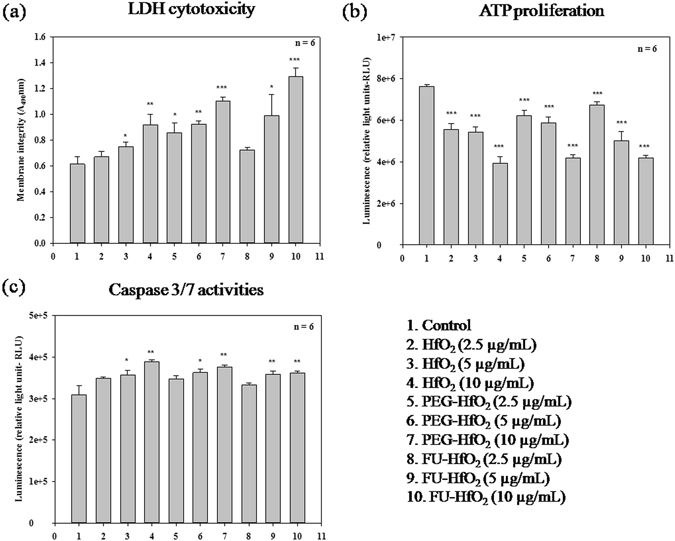
The development of a strategy to stabilise the cubic phase of HfO2 at lower temperatures is necessary for the emergence of unique properties that are not realised in the thermodynamically stable monoclinic phase. A very high temperature (>2600 °C) is required to produce the cubic phase of HfO2, whereas the monoclinic phase is stable at low temperature. Here, a novel rapid synthesis strategy was designed to develop highly crystalline, pure cubic-phase HfO2 nanoparticles (size <10 nm) using microwave irradiation. Furthermore, the as-prepared nanoparticles were converted to different morphologies (spherical nanoparticles and nanoplates) without compromising the cubic phase by employing a post-hydrothermal treatment in the presence of surface modifiers. The cytotoxicities and proliferative profiles of the synthesised cubic HfO2 nanostructures were investigated over the MCF-7 breast cancer cell line, along with caspase-3/7 activities. The low-temperature phase stabilisation was significantly attributed to surface imperfections (defects and deformations) induced in the crystal lattice by the desirable presence of Na2S·xH2O and NaOH. Our work provides unprecedented insight into the stabilisation of nanoscale cubic-phase HfO2 in ambient environments; the method could be extended to other challenging phases of nanomaterials.


Conflict of interest statement

The authors declare that they have no competing interests.

Figures

Figure 1
Figure 1
HR-TEM micrographs of the as-prepared c-HfO2 nanoparticles (a,c); (b) FFTs show a crystalline ring pattern of the selected area in image (a); (d) SAED pattern of c-HfO2; (e) d-spacing calculation using the average of 10 fringes; (f) energy-dispersive X-ray (EDX) spectrum; (g) scanning tunnelling electron microscopy (STEM) EDX mapping images, exhibiting the homogeneous distribution of hafnium and oxygen.
Figure 2
Figure 2
TEM micrographs of c-HfO2 nanostructures obtained after treatment in hydrothermal autoclave with PEG (a,b) and FU (c,d).
Figure 3
Figure 3
Schematic of the formation of HfO2 nanostructures in the presence of PEG and FU (MW represents microwave heating).
Figure 4
Figure 4
XRD patterns obtained with varied concentrations of Na2S·xH2O (0, 1, 3, and 5 mmol); without washing after reaction completion (using 3 mmol of Na2S·xH2O); reaction in aqueous media (used 3 mmol Na2S·xH2O, and 15 mL water).
Figure 5
Figure 5
(a) XRD patterns show the cubic-to-monoclinic conversion of HfO2 with calcination; (b) crystallographic structural transformation from cubic-to-monoclinic HfO2 upon calcination at temperatures greater than 500 °C (red and olive-green spheres represent O and Hf atoms, respectively).
Figure 6
Figure 6
XPS binding energy survey spectrum with marked corresponding peaks (a); high-resolution XPS spectra of Hf (b) and O (c) for synthesised c-HfO2.
Figure 7
Figure 7
(a) XRD patterns, and (b) Raman spectra of c-HfO2 nanostructures; (c) UV-vis absorption spectrum with inset depicting Tauc plots for band gaps; (d) thermogravimetric analysis (TGA) curves for c-HfO2 nanostructures.
Figure 8
Figure 8
Structural evolution of HfO2 when synthesised using varying concentrations of NaOH (4, 6, and 8 mmol). XRD patterns of as-prepared HfO2 (ac) and after calcining at 550 °C for 1 h (de) with various NaOH concentrations (4, 6, and 8 mmol, respectively).
Figure 9
Figure 9
Morphological changes of breast cancer cells (MCF-7) after treatment with HfO2, PEG-HfO2, and FU-HfO2 nanostructures (scale bar for all images is 50 µm; arrows indicate cell death).
Figure 10
Figure 10
Effect of HfO2, PEG-HfO2, and FU-HfO2 nanostructures on: (a) LDH cytotoxicity, (b) ATP proliferation, and (c) Caspase-3/7 activities. Statistical significance values between the control and treated cells are shown as (*) P < 0.05 (**) P < 0.01 and (***) P < 0.001.

References

    1. Gritsenko VA, Perevalov TV, Islamov DR. Electronic properties of hafnium oxide: A contribution from defects and traps. Phys. Rep. 2016;613:1–20. doi: 10.1016/j.physrep.2015.11.002. - DOI
    1. Matovic B, et al. A novel reduction-oxidation synthetic route for hafnia. Ceram. Int. 2016;42:615–620. doi: 10.1016/j.ceramint.2015.08.155. - DOI
    1. Lauria A, Villa I, Fasoli M, Niederberger M, Vedda A. Multifunctional role of rare earth doping in optical materials: Nonaqueous sol-gel synthesis of stabilized cubic HfO2 luminescent nanoparticles. ACS Nano. 2013;7:7041–7052. doi: 10.1021/nn402357s. - DOI - PubMed
    1. Fahrenkopf NM, Rice PZ, Bergkvist M, Deskins NA, Cady NC. Immobilization mechanisms of deoxyribonucleic acid (DNA) to hafnium dioxide (HfO2) surfaces for biosensing applications. ACS Appl. Mater. Interfaces. 2012;4:5360–5368. doi: 10.1021/am3013032. - DOI - PubMed
    1. Larkin J, et al. Slow DNA transport through nanopores in hafnium oxide membranes. ACS Nano. 2013;7:10121–10128. doi: 10.1021/nn404326f. - DOI - PMC - PubMed

Publication types