. 2017 Aug 24;7(1):9365.
doi: 10.1038/s41598-017-09715-y.

The role of the immunoproteasome in interferon-γ-mediated microglial activation

Affiliations

The role of the immunoproteasome in interferon-γ-mediated microglial activation

Kasey E Moritz et al. Sci Rep. .

Abstract

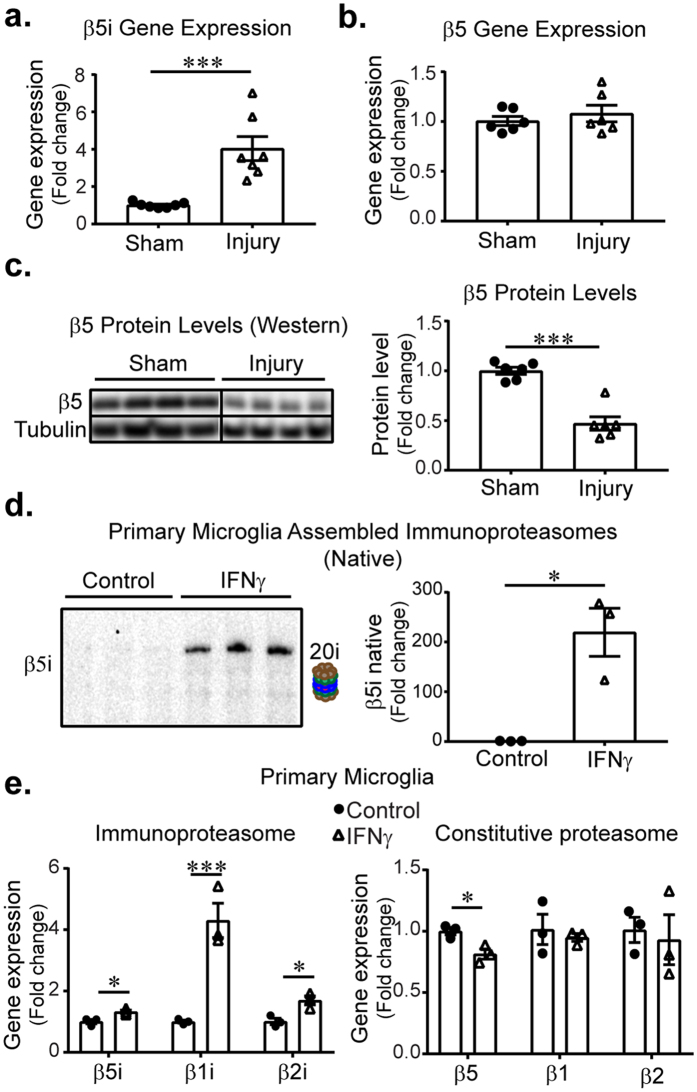
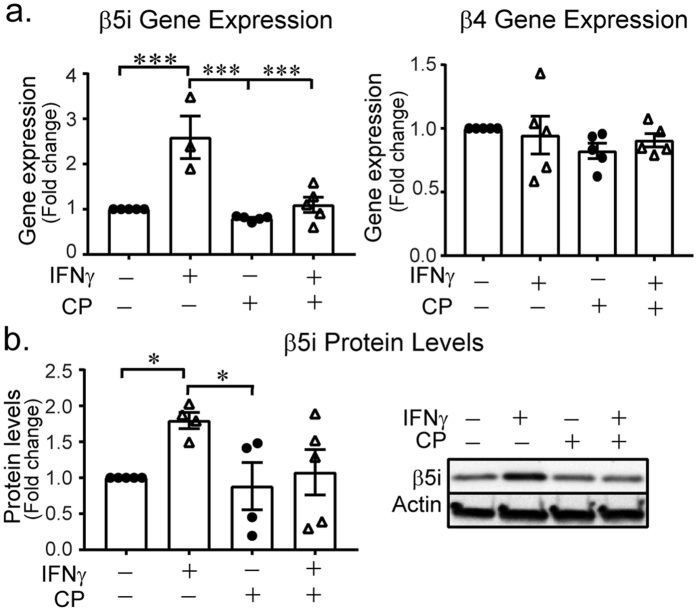
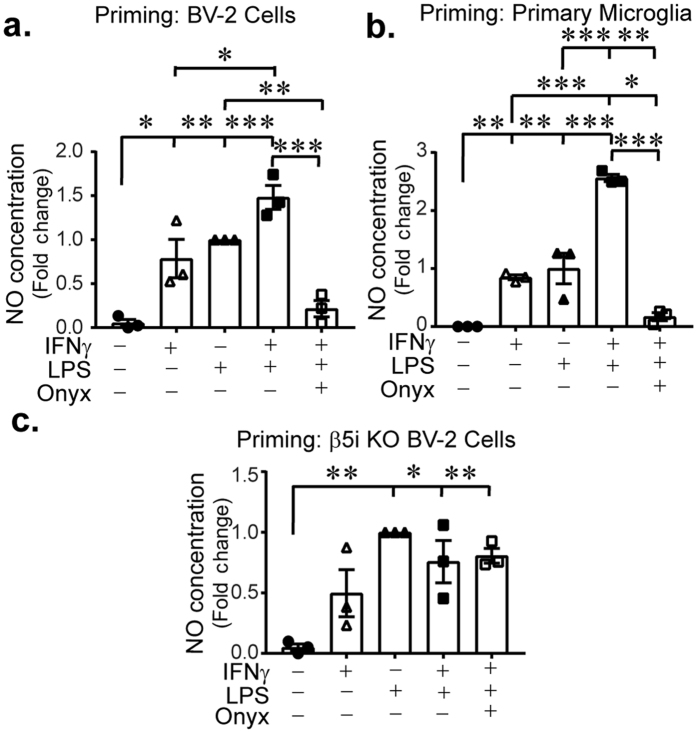
Microglia regulate the brain microenvironment by sensing damage and neutralizing potentially harmful insults. Disruption of central nervous system (CNS) homeostasis results in transition of microglia to a reactive state characterized by morphological changes and production of cytokines to prevent further damage to CNS tissue. Immunoproteasome levels are elevated in activated microglia in models of stroke, infection and traumatic brain injury, though the exact role of the immunoproteasome in neuropathology remains poorly defined. Using gene expression analysis and native gel electrophoresis we characterize the expression and assembly of the immunoproteasome in microglia following interferon-gamma exposure. Transcriptome analysis suggests that the immunoproteasome regulates multiple features of microglial activation including nitric oxide production and phagocytosis. We show that inhibiting the immunoproteasome attenuates expression of pro-inflammatory cytokines and suppresses interferon-gamma-dependent priming of microglia. These results imply that targeting immunoproteasome function following CNS injury may attenuate select microglial activity to improve the pathophysiology of neurodegenerative conditions or the progress of inflammation-mediated secondary injury following neurotrauma.


Conflict of interest statement

The authors declare that they have no competing interests.

Figures

Figure 1
Figure 1
Altered proteasome dynamics in brains and microglia. (a) Animals subjected to CCI contain significantly higher gene expression of immunoproteasome catalytic subunit β5i compared to sham animals (t(12) = 4.69, p < 0.001, n = 7). (b) There is no difference in constitutive proteasome subunit β5 (t(10) = 0.7837, p = 0.451). (c) Injured animals had significantly reduced β5 protein levels (t(10) = 7.024, p < 0.001, n = 6/treatment group). (d) Primary microglia treated with IFNγ for 24 h (n = 3/group) have significantly higher assembled immunoproteasomes than controls (t(2.001) = −4.757, p = 0.041). (e) Gene expression of immunoproteasome subunits β5i (t(2.001) = −4.757, p = 0.024), β1i (t(2.030) = −5.856, p = 0.027), and β2i (t(4) = −3.879, p = 0.018) are all significantly increased. Constitutive proteasome subunit β5 is reduced (t(4) = 3.640, p = 0.022), whereas the others remain unchanged (β1:t(4) = 0.510, p = 0.637; β2:t(4) = 0.352, p = 0.743). Data are presented as relative fold change compared to sham animals or control cells, analysed by independent samples t-test.
Figure 2
Figure 2
Immunoproteasomes in BV-2 microglia. BV-2 cells were subjected to 24 h IFNγ and prepared for gene expression (n = 6) and protein (n = 7) analysis. (a) Immunoproteasome genes are significantly increased following treatment (β5i: t(5.145) = −6.524, p = 0.001; β1i: t(5.024) = −6.795, p = 0.001; β2i: t(5.532) = −17.691, p < 0.001; pa28α: t(4.010) = −3.143, p = 0.035) accompanied by increased β5i protein levels (t(12) = −6.006, p < 0.001). (b) Gene expression analysis reveals that β5 (t(5.783) = 5.745, p = 0.001) is significantly decreased, however no other core subunits catalytic subunits are changed (β1:t(9) = −0.647, p = 0.534; β2:t(6.011) = −0.469, p = 0.656). Total protein levels of the β5 catalytic subunit is significantly reduced following treatment with IFNγ (t(4.637) = 4.129, p = 0.011). (c). Assembled immunoproteasomes are significantly increased (n = 4) following IFNγ treatment (t(3.543) = −4.452, p = 0.015). Assembled constitutive proteasomes are reduced (n = 4) after IFNγ treatment (t(6) = 5.675, p = 0.001). Data are presented as relative fold change compared to untreated control cells, analysed by independent samples t-test. (P-purified proteasome).
Figure 3
Figure 3
24 h immunoproteasome formation is Pomp-dependent. (a) BV-2 cells treated with IFNγ were examined for de novo immunoproteasome production (n = 6). Gene expression of non-catalytic core subunits is reduced (α6: t(10) = 4.013, p = 0.002; β3: t(10) = 2.583, p = 0.027) or unchanged (α5: t(3.197) = −1.112, p = 0.343; β4: t(6.011) = −0.469, p = 0.186) relative to controls. Despite a modest rise in α7 gene expression (t(10) = −7.561, p < 0.001), protein levels are unchanged. (b) Gene expression of assembly chaperones Pac1 (t(10) = 10.650, p < 0.001), Pac2 (t(10) = 3.548, p = 0.005) and Pac4 (t(10) = 14.869, p < 0.001) is significantly reduced following IFNγ treatment. Pac3 is unchanged (t(9) = 1.336, p = 0.214). Late assembly chaperone and proteasome maturation protein, Pomp was significantly increased following treatment (t(10) = −4.158, p = 0.002). (c). We performed siRNA-mediated knockdown of Pomp and measured fold change of immunoproteasome induction in response to IFNγ. Pomp protein levels were significantly changed following knockdown (F(3,8) = 7.730, p = 0.009, one-way ANOVA, n = 3) and IFNγ-dependent immunoproteasome assembly is reduced (t(5) = 3.814, p = 0.012, t-test comparing IFNγ-induced fold-change of NTC (n = 3) vs. Pomp siRNA (n = 4)). (d). Pac1 siRNA-mediated gene silencing was sufficient to reduce Pac1 levels compared to NTC (F (3,8) = 6.198, p = 0.018, n = 3), however did not impact immunoproteasome assembly in response to IFNγ (t(3.076) = −1.318, p = 0.277, t-test comparing IFNγ-induced fold change of NTC vs. IFNγ-induced fold change of Pac1 siRNA knockdown, n = 4).
Figure 4
Figure 4
Immunoproteasome induction is mediated by Jak3 inhibition. BV-2 cells were treated with IFNγ in the absence and presence of Jak3 inhibitor, CP-690550 (CP, 10 µM) for 24 h. (a) Gene expression analysis revealed a significant effect of drug treatment on β5i gene expression (F(3,15) = 5.931, p = 0.007, n = 5). IFNγ-induced (n = 3) β5i expression was higher than control (n = 5, p = 0.016), CP-690550 (n = 5, p = 0.010) and IFNγ + CP-690550 (n = 5, p = 0.020). CP-690550 co-treatment with IFNγ does not increase β5i levels (p = 0.999, compared to control). Jak3 inhibition not have a global effect on all proteasome subunits, as gene expression analysis revealed no change in a non-catalytic core subunit, β4 (F(3,15) = 1.834, p = 0.184, n = 5). (b) β5i protein levels were significantly different between groups (F(3,14) = 4.316, p = 0.024). IFNγ (n = 4) significantly increases protein levels of β5i protein (p = 0.041) compared to control (n = 5). IFNγ does not increase immunoproteasome protein levels in cells that are simultaneously treated with CP-690550 (p = 0.998, compared to control, n = 5). Data are presented as relative fold-change compared to untreated control cells, analysed by one-way ANOVA with Tukey’s post hoc test.
Figure 5
Figure 5
Transcriptome changes in BV-2 cells. BV-2 cells were treated with IFNγ and/or ONX-0914 for 24 h and transcriptome profiling by RNA-seq was performed. (a) Differential expression of 3,482 genes after exposure to IFNγ. (b) Differential expression of 2,670 genes between IFNγ exposed and IFNγ and ONX-0914 exposed cells. (c) Expression signature of 703 differential expressed genes by IFNγ exposure that are reversed with co-administration of ONX-0914. (d) Expression signature of immune response enriched genes with differential expression after IFNγ exposure and reversal by co-administration of ONX-0914. Gene ontologies associated with biological processes are enriched by overlapping gene sets and fold-enrichment (Table 2).
Figure 6
Figure 6
Immunoproteasomes modulate IFNγ-induced inflammation response. BV-2 cells and primary microglia were treated with IFNγ in the absence and presence of immunoproteasome (ONX-0914) and JAK3 (CP-690550, CP) inhibitors, then iNOS and NO levels were measured. (a) Treatment significantly alters iNOS gene expression (F(3,19) = 31.437, p < 0.001). IFNγ (n = 4) significantly increases iNOS gene expression compared to control (n = 5, p < 0.001), whereas IFNγ co-treatment with ONX-0914 (n = 4) results in reduced levels of iNOS gene expression compared to IFNγ alone (p < 0.001). Bars represent mean fold change compared to normalized control. (b) IFNγ and CP-690550 treatment significantly impacts iNOS gene expression (F(3,14) = 16.353, p < 0.001). IFNγ (n = 4) significantly increases iNOS compared to control (n = 5, p < 0.001). IFNγ alone results in significantly higher iNOS gene expression than CP-690550 treatment (n = 5, p = 0.049) and IFNγ + CP-690550 co-treatment (n = 5, p = 0.001). Bars represent mean fold change compared to normalized control. (c) ONX-0914 treatment has a significant effect on NO levels in BV-2 cells (F(3,24) = 68.354, p < 0.001, n = 7). IFNγ treatment increases levels of NO compared to control (p = 0.001). Co-treatment with IFNγ and ONX-0914 results in significantly lower NO production compared to IFNγ alone (p = 0.001). (d) NO levels in primary microglia are significantly different between groups (F(3,8) = 8.717, p = 0.006, n = 3). IFNγ significantly increased NO levels compared to control (p = 0.017), ONX-0914 (p = 0.019) and co-treatment (p = 0.008).
Figure 7
Figure 7
Immunoproteasome inhibition alters phagocytosis. (a) BV-2 cells were treated with IFNγ and/or ONX-0914 for 24 h. Treatment significantly alters phagocytosis of fluorescent microspheres (F(3,20) = 26.91, p > 0.001, n = 6, ANOVA with Tukey’s post hoc). Both IFNγ and ONX treatments significantly decrease phagocytosis (p = 0.001; p < 0.001, respectively). Co-treatment of IFNγ and ONX further decreases phagocytosis compared to control (p > 0.001), IFNγ (p = 0.001) and ONX (p = 0.008). (b) Phagocytosis in β5i KO BV-2 cells is different between groups (F(3,20) = 14.7, p < 0.001, n = 6). Mean fluorescence intensity is higher in control cells compared to IFNγ and ONX-0914/IFNγ co-treatment (p = 0.001 and p < 0.001, respectively). There was no difference between control and ONX-0914 treated cells.
Figure 8
Figure 8
Microglia priming is mediated through the immunoproteasome. BV-2 or primary microglia were primed with IFNγ alone or in combination with ONX-0914 for 24 h. Following, cells were stimulated with LPS for an additional 24 h and NO levels were measured. (a) There is a significant effect of treatment on NO (F(4,10) = 22.183, p < 0.001, n = 3) in BV-2 cells. LPS induces NO production compared to control cells (p = 0.002), however IFNγ and LPS co-treatment results in exacerbated NO production (p < 0.001), indicative of the priming effect of IFNγ. Cells treated with ONX-0914 and IFNγ combined do not exhibit the priming response and NO is significantly lower than LPS + IFNγ (p < 0.001). There is no difference between control cells and IFNγ + ONX-0914 + LPS treated cells (p = 0.856). (b) NO release in primary microglia is significantly different between groups (F(4,10) = 64.44, p < 0.001, n = 3). IFNγ, LPS and IFNγ/LPS combination treatment elevates NO levels compared to control (p = 0.005, p = 0.001, p < 0.001, respectively). LPS resulted in an exaggerated NO response compared to LPS alone (p < 0.001), indicative of priming. Pre-treatment with ONX-0914 simultaneous with IFNγ priming, blocks the LPS-induced increase of NO, suggesting that immunoproteasome inhibition blocks priming. (c) β5i knockout BV-2 cells were treated in the same way as above, and NO was measured. There is a significant effect of treatment (F(4,10) = 9.454, p = 0.002, n = 3). LPS increased NO production compared to control (p = 0.002), however priming with IFNγ did not result in an LPS-induced increase of NO (p = 0.637). Data is presented as mean fold change normalized to LPS treatment.
Figure 9
Figure 9
Immunoproteasome induction alters microglia function. Summary illustration of select microglia functions that are altered following ONX treatment. (a) Surveying microglia, in response to IFNγ, (b) transition to a reactive state accompanied by vast transcriptome alterations, up-regulation of the immunoproteasome, increased NO release and reduced phagocytosis. (c) IFNγ stimulated microglia become primed and respond more robustly to subsequent insults. (d) Immunoproteasome inhibition blocks the IFNγ-induced increase in NO release but exacerbates the reduction of phagocytosis. (e) Immunoproteasome inhibition protects cells from becoming primed, thus they do not have exaggerated response to a secondary stimulus.

References

    1. Nimmerjahn A, Kirchhoff F, Helmchen F. Resting microglial cells are highly dynamic surveillants of brain parenchyma in vivo. Science. 2005;308:1314–1318. doi: 10.1126/science.1110647. - DOI - PubMed
    1. Davalos D, et al. ATP mediates rapid microglial response to local brain injury in vivo. Nature neuroscience. 2005;8:752–758. doi: 10.1038/nn1472. - DOI - PubMed
    1. Haynes SE, et al. The P2Y12 receptor regulates microglial activation by extracellular nucleotides. Nature neuroscience. 2006;9:1512–1519. doi: 10.1038/nn1805. - DOI - PubMed
    1. Hanisch UK, Kettenmann H. Microglia: active sensor and versatile effector cells in the normal and pathologic brain. Nature neuroscience. 2007;10:1387–1394. doi: 10.1038/nn1997. - DOI - PubMed
    1. Huh Y, et al. Microglial activation and tyrosine hydroxylase immunoreactivity in the substantia nigral region following transient focal ischemia in rats. Neuroscience letters. 2003;349:63–67. doi: 10.1016/S0304-3940(03)00743-2. - DOI - PubMed

Publication types

MeSH terms