

A global analysis of alternative tillage and crop establishment practices for economically and environmentally efficient rice production
- PMID: 28839240
- PMCID: PMC5571152
- DOI: 10.1038/s41598-017-09742-9
A global analysis of alternative tillage and crop establishment practices for economically and environmentally efficient rice production
Abstract
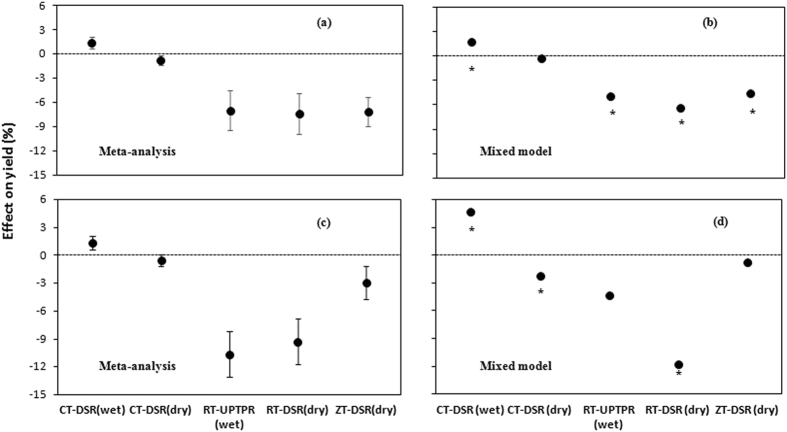
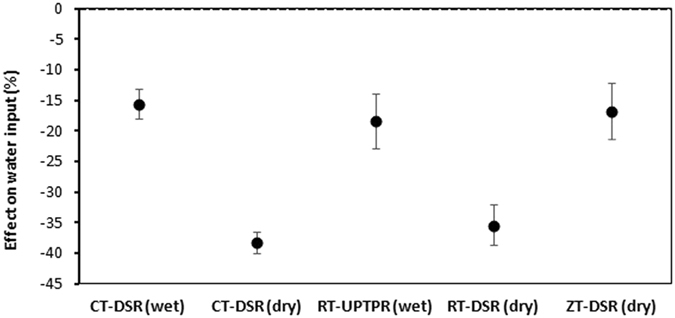
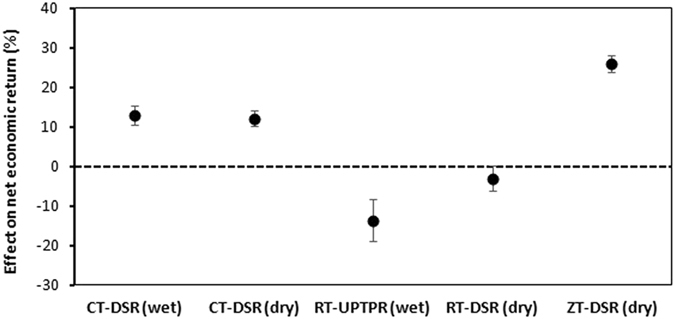
Alternative tillage and rice establishment options should aim at less water and labor to produce similar or improved yields compared with traditional puddled-transplanted rice cultivation. The relative performance of these practices in terms of yield, water input, and economics varies across rice-growing regions. A global meta and mixed model analysis was performed, using a dataset involving 323 on-station and 9 on-farm studies (a total of 3878 paired data), to evaluate the yield, water input, greenhouse gas emissions, and cost and net return with five major tillage/crop establishment options. Shifting from transplanting to direct-seeding was advantageous but the change from conventional to zero or reduced tillage reduced yields. Direct-seeded rice under wet tillage was the best alternative with yield advantages of 1.3-4.7% (p < 0.05) and higher net economic return of 13% (p < 0.05), accompanied by savings of water by 15% (p < 0.05) and a reduction in cost by 2.4-8.8%. Direct-seeding under zero tillage was another potential alternative with high savings in water input and cost of cultivation, with no yield penalty. The alternative practices reduced methane emissions but increased nitrous oxide emissions. Soil texture plays a key role in relative yield advantages, and therefore refinement of the practice to suit a specific agro-ecosystem is needed.
Conflict of interest statement
The authors declare that they have no competing interests.
Figures


References
-
- USDA. Economic Research Service. Available at https://www.ers.usda.gov/data-products/rice-yearbook/. (Accessed: April 16, 2017).
-
- FAO (Food & Agriculture Organization of the United Nations). Rice Market Monitor. December 2016, Vol. XXIX(4) (2016).
-
- OECD/Food and Agriculture Organization of the United Nations. OECD-FAO Agricultural Outlook 2015, OECD Publishing, Paris. 1‒143 (2015).
-
- Wise, T. A. Can We Feed the World in 2050? A scoping paper to assess the evidence. GDAE Working Paper No. 13–04. Global Development and Environment Institute, Tufts University, Medford, MA, USA. Available at http://www.ase.tufts.edu/gdae/Pubs/wp/13-04WiseFeedWorld2050.pdf. (Accessed: May 15, 2017).
Publication types
MeSH terms
LinkOut - more resources
Full Text Sources
Other Literature Sources
