. 2017 Aug 24;7(1):9341.
doi: 10.1038/s41598-017-10022-9.

Activation-tagging in indica rice identifies a novel transcription factor subunit, NF-YC13 associated with salt tolerance

Affiliations

Activation-tagging in indica rice identifies a novel transcription factor subunit, NF-YC13 associated with salt tolerance

P Manimaran et al. Sci Rep. .

Abstract

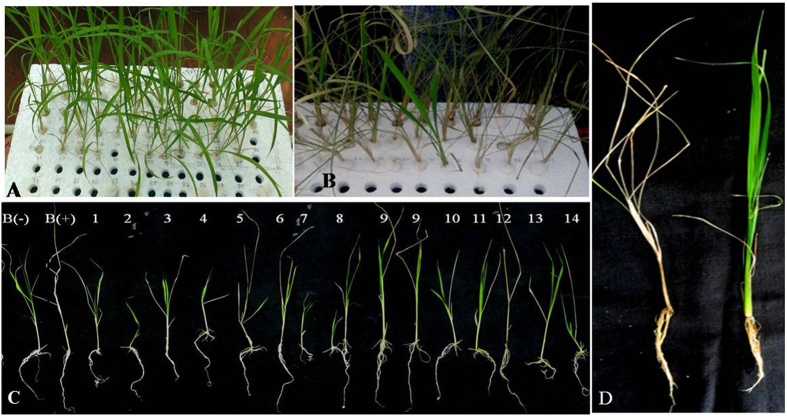
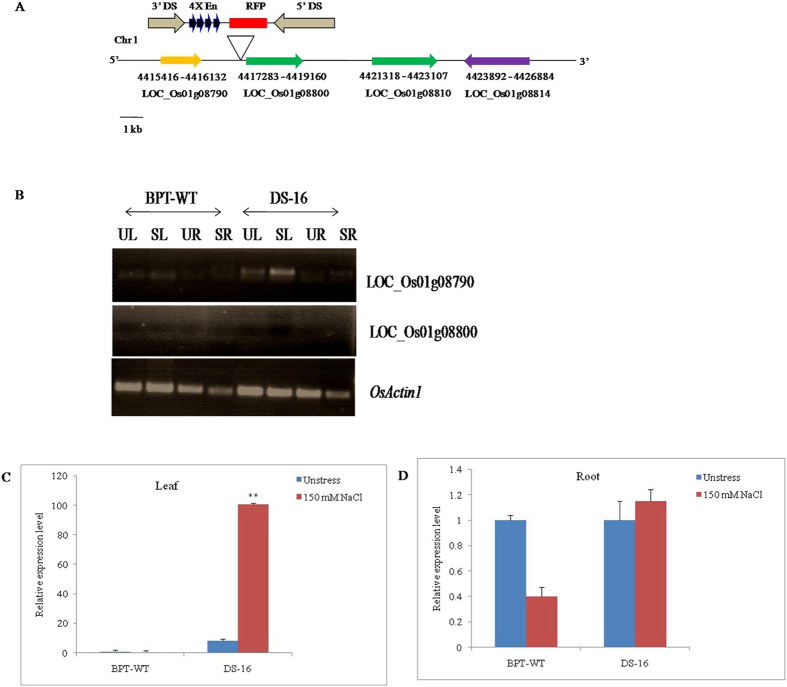
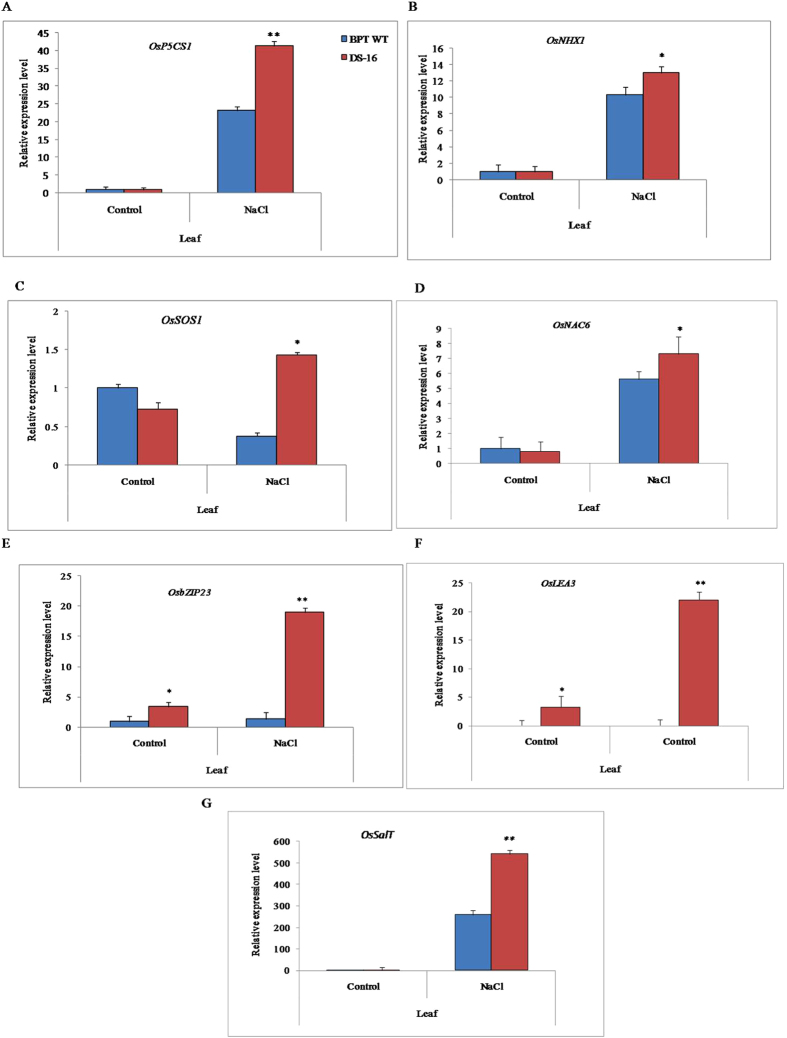
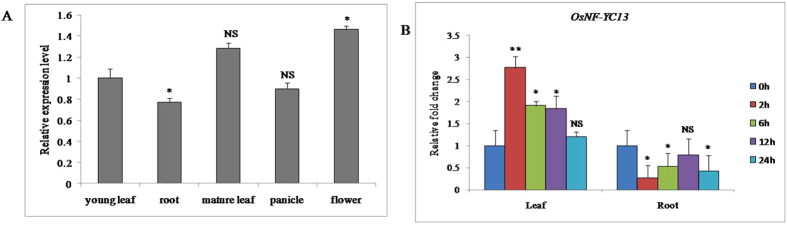
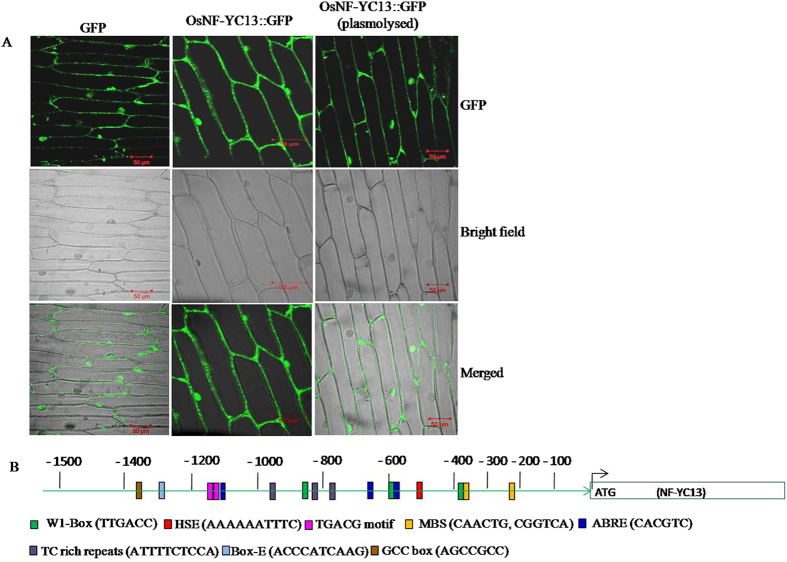
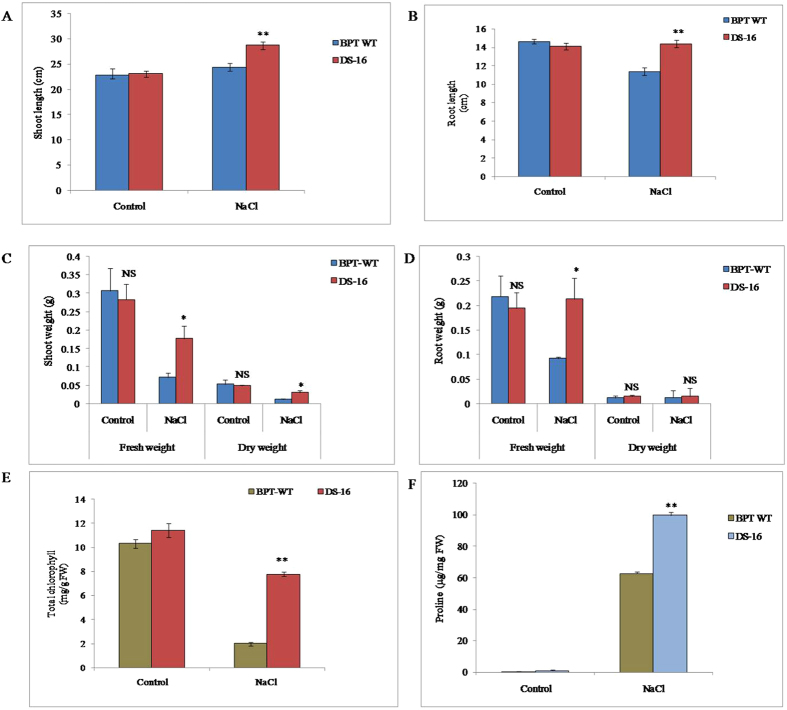
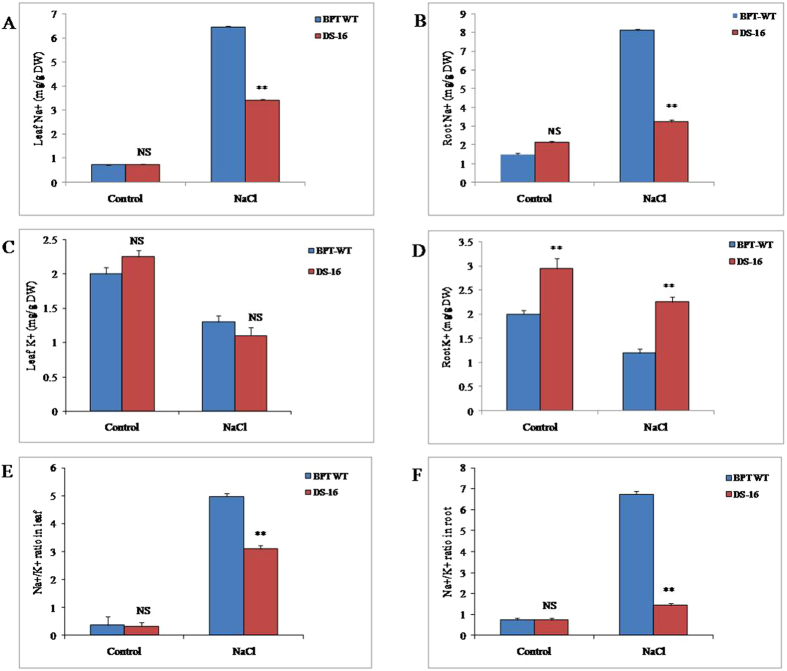
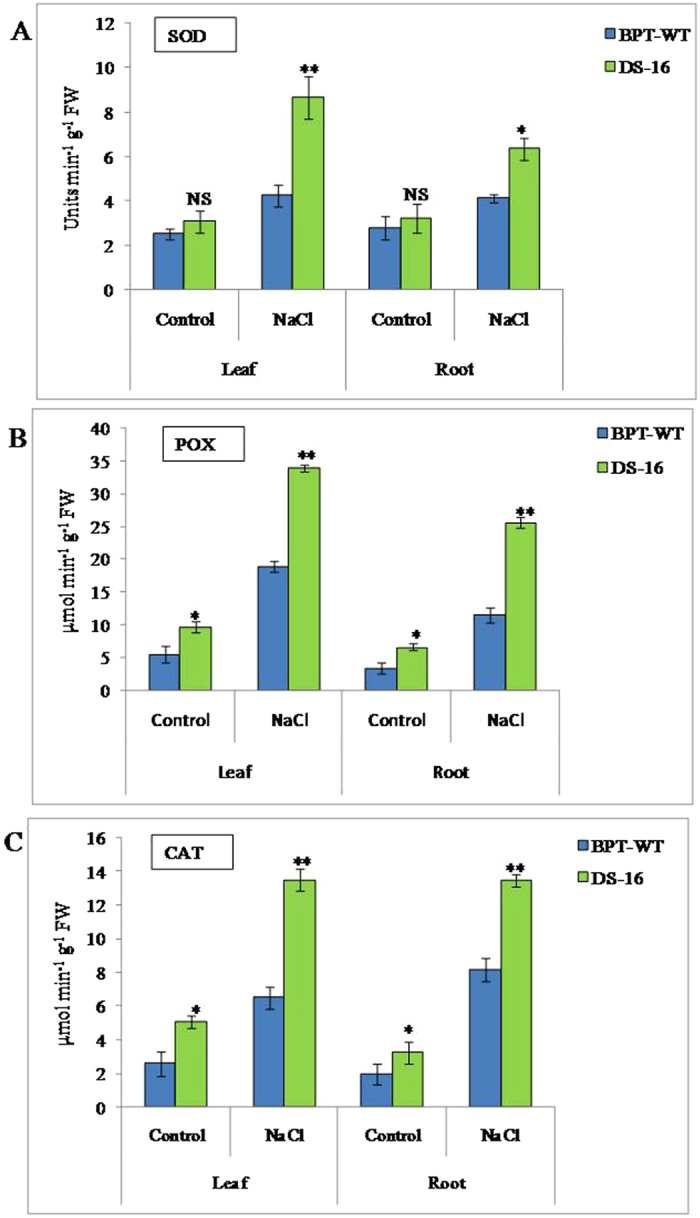
Nuclear factor Y (NF-Y) is a heterotrimeric transcription factor with three distinct NF-YA, NF-YB and NF-YC subunits. It plays important roles in plant growth, development and stress responses. We have reported earlier on development of gain-of-function mutants in an indica rice cultivar, BPT-5204. Now, we screened 927 seeds from 70 Ac/Ds plants for salinity tolerance and identified one activation-tagged salt tolerant DS plant (DS-16, T3 generation) that showed enhanced expression of a novel 'histone-like transcription factor' belonging to rice NF-Y subfamily C and was named as OsNF-YC13. Localization studies using GFP-fusion showed that the protein is localized to nucleus and cytoplasm. Real time expression analysis confirmed upregulation of transcript levels of OsNF-YC13 during salt treatment in a tissue specific manner. Biochemical and physiological characterization of the DS-16 revealed enhanced K+/Na+ ratio, proline content, chlorophyll content, enzymes with antioxidant activity etc. DS-16 also showed transcriptional up-regulation of genes that are involved in salinity tolerance. In-silico analysis of OsNF-YC13 promoter region evidenced the presence of various key stress-responsive cis-regulatory elements. OsNF-YC13 subunit alone does not appear to have the capacity for direct transcription activation, but appears to interact with the B- subunits in the process of transactivation.


Conflict of interest statement

The authors declare that they have no competing interests.

Figures

Figure 1
Figure 1
Hydroponic screening of Ds plants for salinity tolerance. (A) Two weeks old seedlings were in Yoshida’s solution before stress treatment. (B) Seedlings in Yoshida’s solution supplemented with 150 mM NaCl. (C) Salt tolerant Ds plants after NaCl treatment. (D) Plants after recovery (Represented line). B(−): WT-BPT without stress; B( + ): WT-BPT with NaCl stress treatment; 1–14: Ds lines showing tolerance after two weeks of NaCl stress.
Figure 2
Figure 2
Physical mapping of insertion site of Ds-Enhancer (DS-En) elements and expression analysis of NF-YC13 in salt tolerant activation-tagged DS-16 line. (A) Ds element was inserted in the intergenic region on chromosome 1 and location of neighboring four putative genes (up to 20 kb region) near the insertion site. (B) Semi-quantitative RT-PCR analysis of activation-tagged DS-16 line. Two weeks old seedlings grown in Yoshida’s solution supplemented with 150 mM NaCl for 15 d and those without NaCl supplementation used as control. One of the genes, LOC_Os01g08790 shows expression during control and NaCl stress conditions while no expression in leaf and root of WT-BPT and LOC_Os01g08800 respectively. (C,D) Quantitative real time-PCR analysis of expression of NF-YC13 in the activation-tagged DS-16 line in leaf and root tissues. OsActin1 was used as a reference gene for quantitative RT-PCR. Means of three independent samples and standard errors are presented. ** and * indicates significant difference at P < 0.01 and P < 0.05.
Figure 3
Figure 3
Analysis of transcript levels of stress responsive marker genes in activation tagged DS-16 line in comparison with WT-BPT under NaCl stress treatment. (A) OsP5CS1; (B) OsNHX1; (C) OsSOS1; (D) OsNAC6; (E) OsbZIP23; (F) OsLEA3; (G) OsSalT. Two weeks old seedlings grown in Yoshida’s solution supplemented with 150 mM NaCl for 15 d and those without NaCl supplement used as control. OsActin1 was used as a reference gene for quantitative real-time RT-PCR. Means of three independent samples and standard errors are presented. ** and * indicates significant difference at P < 0.01 and P < 0.05.
Figure 4
Figure 4
Expression pattern of OsNF-YC13 in wild-type BPT 5204. (A) Relative expression profile of OsNF-YC13 gene in different organs of wild-type rice plants. The transcript level of OsNY-YC13 in young leaf as standard. (B) Relative expression of OsNF-YC13 under NaCl stress (150 mM) treatment in leaf and root. Two week-old rice seedlings grown in Yoshida’s solution were collected for gene expression analysis of different time intervals. Total RNA was prepared from 2-week-old seedlings of wild-type rice after the above treatments and then cDNA was prepared. Real-time PCR was performed using OsActin1 was used as an internal control. qRT-PCR was performed with OsNF-YC13 specific primers. Data represent means and standard errors of three biological replicates are shown.
Figure 5
Figure 5
Subcellular localization of OsNF-YC13 in onion epidermal cells and graphical representation of various cis-regulatory elements in 1.5 kb upstream regulatory region of OsNF-YC13. (A) The coding region of OsNF-YC13 was fused to the N-terminus of green fluorescence protein (GFP) and transformed into onion epidermal cells through Agrobacterium-infiltration using GFP as control. The GFP fluorescence was detected under confocal laser scanning microscope. (B) Physical mapping of key cis-elements involved in different stresses. A 1.5 kb upstream region of OsNF-YC13 was extracted from rice genome database and searched for various stress related elementsusing online tool, PlantCare.
Figure 6
Figure 6
Evaluation of activation tagged DS-16 plants for salinity tolerance and chlorophyll and proline content in the activation tagged DS-16 line. (A,B) Shoot and root length. (C,D) Fresh and dry weight of shoot and root. E: Total chlorophyll content (F) proline content. Two weeks old rice seedlings from DS-16 and WT-BPT were treated with 150 mM NaCl stress treatment for 2-weeks. Experiment was carried out before and after stress treatment of DS-16 and WT. A total of 5–10 rice seedlings were measured and two independent biological repeats were performed for each treatment with error bar. ** indicates significant differences in comparison with the WT at P < 0.01, *P < 0.05, NS - non significant.
Figure 7
Figure 7
Estimation of Sodium and potassiumcontent of salt tolerant activation tagged DS-16 line. (A) Leaf Na+, (B) root Na+, (C) leaf K+, (D) root K+, (E) Leaf Na+/K+ ratio, (F) root Na+/K+ ratio. Two weeks old rice seedlings from DS-16 and WT-BPT were treated with 150 mM NaCl stress for two weeks. Ion accumulation was estimated before and after stress treatment in DS-16 and WT. Three rice seedlings were used in each treatment and three independent biological repeats were performed for each treatment with error bar. * indicates significant differences in comparison with the WT at P < 0.05, **P < 0.01, NS - non significant.
Figure 8
Figure 8
Analysis of antioxidant enzymes activity in activation tagged DS-16 and WT before and after NaCl treatment. (A) super oxide dismutase (SOD), (B) peroxidase (POX), (C) catalase (CAT). Two weeks old DS-16 seedlings and WT-BPT were treated with 150 mM NaCl for twoweeks. Three rice seedlings were used in each treatment and three independent biological repeats were performed for each treatment with error bar. * indicates significant differences in comparison with the WT at P < 0.05, **P < 0.01, NS - non significant.

References

    1. Boyer JS. Plant productivity and environment. Science. 1982;218:443–448. doi: 10.1126/science.218.4571.443. - DOI - PubMed
    1. Kumari S, et al. Transcriptome map for seedling stage specific salinity stress response indicates a specific set of genes as candidate for saline tolerance in Oryza sativa L. Funct Integr Genomics. 2009;9:109–123. doi: 10.1007/s10142-008-0088-5. - DOI - PubMed
    1. Cuartero J, Bolarin MC, Asins MJ, Moreno V. Increasing salt tolerance in tomato. J Exp Bot. 2006;57:1045–1058. doi: 10.1093/jxb/erj102. - DOI - PubMed
    1. Murphy KST, Durako MJ. Physiological effects of short-term salinity changes on Ruppia maritima. Aquat Bot. 2003;75:293–309. doi: 10.1016/S0304-3770(02)00206-1. - DOI
    1. Deinlein U, et al. Plant salt-tolerance mechanisms. Trends Plant Sci. 2014;19:371–379. doi: 10.1016/j.tplants.2014.02.001. - DOI - PMC - PubMed

Publication types

LinkOut - more resources