. 2017 Aug 24;7(1):9391.
doi: 10.1038/s41598-017-10008-7.

The adjuvant value of Herba Cistanches when used in combination with statin in murine models

Affiliations

The adjuvant value of Herba Cistanches when used in combination with statin in murine models

Elaine Wat et al. Sci Rep. .

Abstract

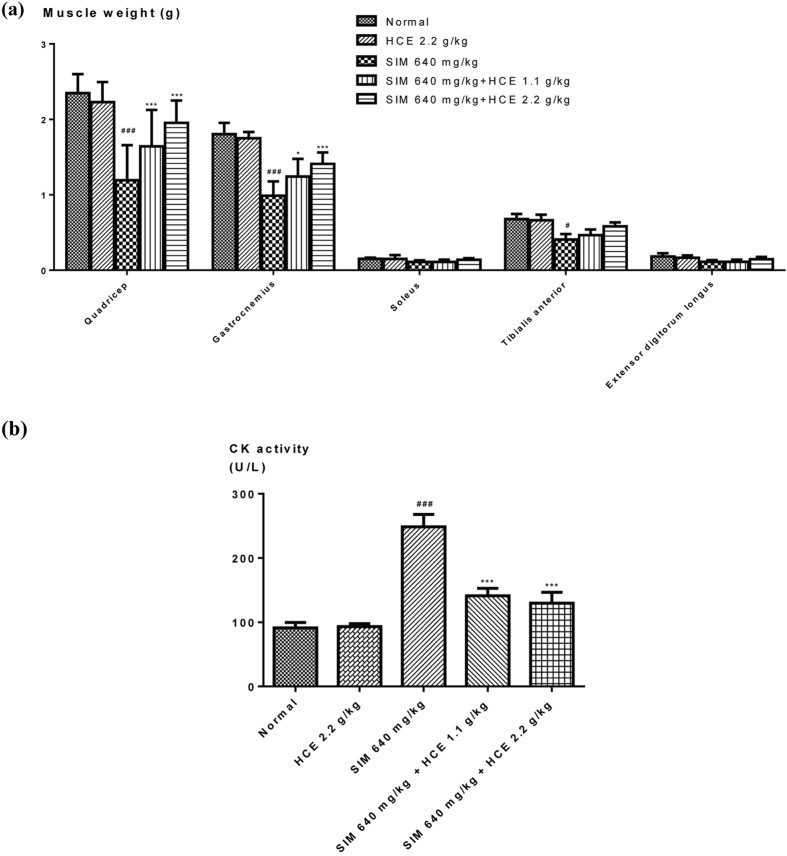
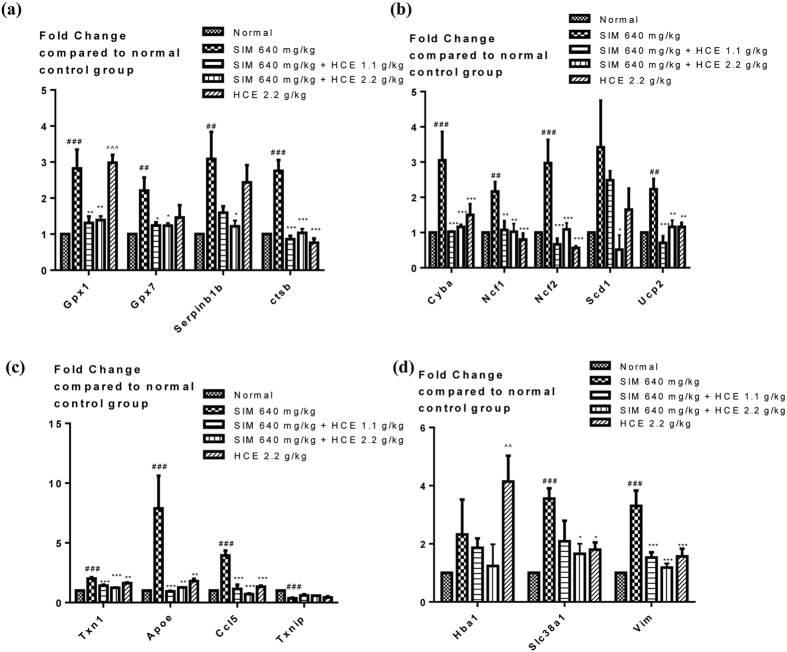
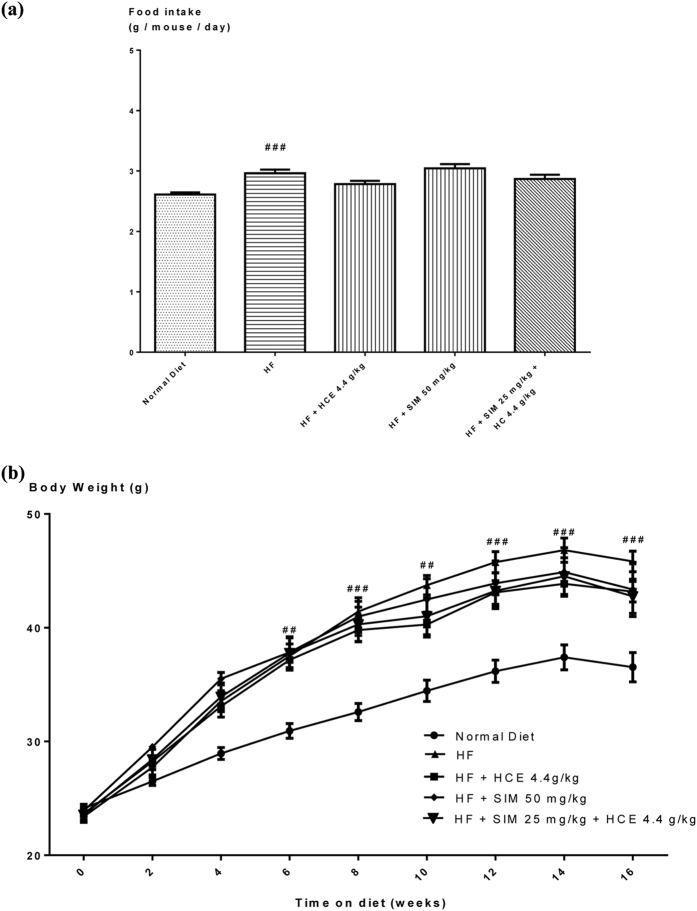
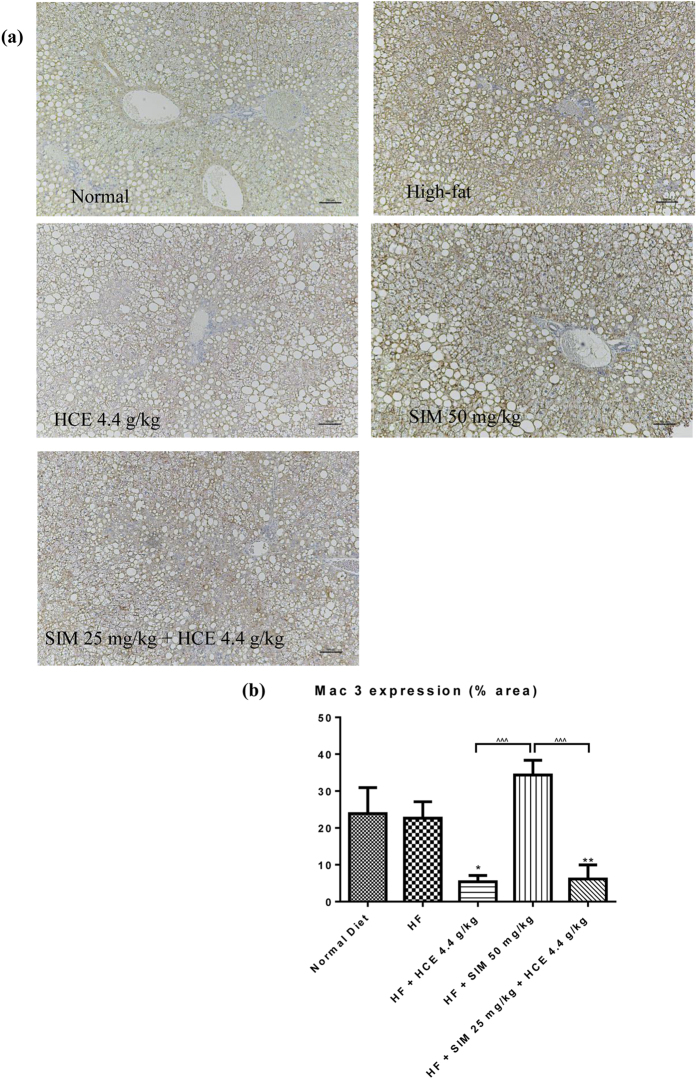
Statins are well known to have muscle toxicity problem. Herba Cistanches (HC) is a Chinese herb traditionally used for pain in the loins and knees. Our previous in vitro study suggested that it could protect against statin-induced muscle toxicity. However, its in vivo protective effect has never been investigated. The objective of this study was to determine if the aqueous extract of HC (HCE) could prevent simvastatin-induced muscle toxicity in rats, and whether HCE could also exert beneficial effects on reducing high-fat diet-induced hypercholesterolemia and elevated liver cholesterol, thereby reducing the dose of simvastatin when used in combined therapy. From our results, HCE significantly restored simvastatin-induced reduction in muscle weights and reduced elevated plasma creatine kinase in rats. HCE also improved simvastatin-induced reduction in muscle glutathione levels, muscle mitochondrial membrane potential, and reduced simvastatin-induced muscle inflammation. Furthermore, HCE could exert reduction on liver weight, total liver lipid levels and plasma lipid levels in high-fat-fed mice. In conclusion, our study provided in vivo evidence that HCE has potential protective effect on simvastatin-induced toxicity in muscles, and also beneficial effects on diet-induced non-alcoholic fatty liver and hyperlipidemia when being used alone or in combination with simvastatin at a reduced dose.


Conflict of interest statement

The authors declare that they have no competing interests.

Figures

Figure 1
Figure 1
Effects of HCE on simvastatin-induced (a) muscle weight loss; and (b) creatine kinase activity in rats. Values represent means ± SEM (n = 5–10). Significant difference between simvastatin treatment alone and normal control group using Student’s t-test: # p < 0.05, ### p < 0.001. Significant difference among simvastatin treatment alone group and simvastatin co-treatment groups with HCE using one-way ANOVA: *p < 0.05, **p < 0.01, ***p < 0.001. No significant difference was observed among the normal control group and HCE (2.2 g/kg) alone treatment group.
Figure 2
Figure 2
Effects of HCE on (a) muscle glutathione peroxidase levels (GPx); (b) muscle mitochondrial membrane potential (MMP); and (c) muscle mitochondrial reactive oxygen species (ROS) levels after simvastatin treatment. Values represent means ± SEM (n = 5–10). Significant difference between simvastatin treatment alone and normal control group using Student’s t-test: # p < 0.05, ## p < 0.01. Significant difference among simvastatin treatment alone group and simvastatin co-treatment with HCE groups using one-way ANOVA: *p < 0.05, **p < 0.01, ***p < 0.001. No significant difference was observed among the normal control group and HCE (2.2 g/kg) alone treatment group.
Figure 3
Figure 3
Representative gastrocnemius muscle sections (x100 magnification) from rats given different treatments and stained with haematoxylin and eosin. The yellow arrows represent infiltration of inflammatory markers. The scale bar represents 100 μm.
Figure 4
Figure 4
Representative gastrocnemius muscle sections (x100 magnification) from rats given different treatments and stained with (a) CD68; and (b) percentage area of gastrocnemius muscle section infiltrated by CD68. Values represent means ± SEM (n = 5–10). Significant difference between simvastatin treatment alone and normal control group using Student’s t-test: ## p < 0.01. Significant difference among simvastatin alone treatment group and simvastatin co-treatment with HCE groups using one-way ANOVA: *p < 0.05. No significant difference was observed among the normal control group and HCE (2.2 g/kg) alone treatment group. The scale bar represents 100 μm.
Figure 5
Figure 5
Representative gastrocnemius muscle sections (x100 magnification) from rats given different treatments and stained with (a) CD163; and (b) percentage area of gastrocnemius muscle section infiltrated by CD163. Values represent means ± SEM (n = 5–10). Significant difference between simvastatin treatment alone and normal control group using Student’s t-test: ## p < 0.01. Significant difference among simvastatin alone treatment group and simvastatin co-treatment with HCE groups using one-way ANOVA: *p < 0.05. No significant difference was observed among the normal control group and HCE (2.2 g/kg) alone treatment group. The scale bar represents 100 μm.
Figure 6
Figure 6
Effect of simvastatin treatment with or without HCE co-treatment on the expression levels of genes regulating (a) antioxidants; (b) superoxide metabolism; (c) oxidative stress response; and (d) oxygen transporter of rats within the muscles. Values represent means ± SEM (n = 5–10). Significant difference between simvastatin treatment alone and normal control group using Student’s t-test: ## p < 0.01, ### p < 0.001. Significant difference among simvastatin alone treatment group and simvastatin co-treatment with HCE groups using one-way ANOVA: *p < 0.05, **p < 0.01, ***p < 0.001. Significant difference among the normal control group and HCE treatment group alone using student t-test: ^^ p < 0.01, ^^^ p < 0.001.
Figure 7
Figure 7
Effect of simvastatin treatment with or without HCE co-treatment in mice fed with a normal chow or high-fat diet on (a) daily food intake; and (b) weekly body weight. Values represent means ± SEM (n = 8–10). Significant difference between HF-fed and normal chow-fed group using Student’s t-test: ## p < 0.01, ### p < 0.001. No significant difference was observed among HF-fed group vs HF + SIM 50 mg/kg, or HF + HCE 4.4 g/kg, or HF + SIM 25 mg/kg + HCE 4.4 g/kg groups. No significant difference was observed among HF + SIM 25 mg/kg + HCE 4.4 g/kg, HF + HCE 4.4 g/kg, and HF + SIM 50 mg/kg groups.
Figure 8
Figure 8
Effect of simvastatin treatment with or without HCE co-treatment in mice fed with a normal chow or high-fat diet on (a) plasma total cholesterol (TC); (b) plasma triglyceride (TG); (c) plasma high-density-lipoprotein cholesterol (HDL-C); (d) plasma low-density-lipoprotein cholesterol (LDL-C); and (e) plasma creatine kinase levels. Values represent means ± SEM (n = 8–10). Significant difference between HF-fed and normal chow-fed group using Student’s t-test: # p < 0.05, ### p < 0.001. Significant difference among HF-fed group vs HF + SIM 50 mg/kg, or HF + HCE 4.4 g/kg, or HF + SIM 25 mg/kg + HCE 4.4 g/kg groups using one-way ANOVA: *p < 0.05, **p < 0.01, ***p < 0.001. Significant difference among HF + SIM 25 mg/kg + HCE 4.4 g/kg, HF + HCE 4.4 g/kg, and HF + SIM 50 mg/kg groups using one-way ANOVA: ^^ p < 0.01, ^^^ p < 0.001.
Figure 9
Figure 9
Effect of simvastatin treatment with or without HCE co-treatment in mice fed with a normal chow or high-fat diet on (a) total liver lipid weight; (b) liver total cholesterol; and (c) liver triglyceride levels. Values represent means ± SEM (n = 8–10). Significant difference between HF-fed and normal chow-fed group using Student’s t-test: ### p < 0.001. Significant difference among HF-fed group vs HF + SIM 50 mg/kg, or HF + HCE 4.4 g/kg, or HF + SIM 25 mg/kg + HCE 4.4 g/kg groups using one-way ANOVA: *p < 0.05, **p < 0.01, ***p < 0.001. Significant difference among HF + SIM 25 mg/kg + HCE 4.4 g/kg, HF + HCE 4.4 g/kg, and HF + SIM 50 mg/kg groups using one-way ANOVA: ^^ p < 0.01.
Figure 10
Figure 10
(a) Immunohistological staining (x100 magnification) for the presence of macrophage (Mac-3) in liver sections of mice given different treatments and (b) percentage area of liver section infiltrated by macrophages, as determined by Mac-3 immunohistological staining in different groups. Values represent means ± SEM (n = 8–10). No significant difference was observed between HF-fed and normal chow-fed group using Student’s t-test. Significant difference among HF-fed group vs HF + SIM 50 mg/kg, or HF + HCE 4.4 g/kg, or HF + SIM 25 mg/kg + HCE 4.4 g/kg groups using one-way ANOVA: *p < 0.05, **p < 0.01. Significant difference among HF + SIM 25 mg/kg + HCE 4.4 g/kg, HF + HCE 4.4 g/kg, and HF + SIM 50 mg/kg groups using one-way ANOVA: ^^^ p < 0.001. The scale bar represents 100 μm.

References

    1. Golomb BA, Evans MA. Statin adverse effects: a review of the literature and evidence for a mitochondrial mechanism. Am J Cardiovasc Drugs. 2008;8(6):373–418. doi: 10.2165/0129784-200808060-00004. - DOI - PMC - PubMed
    1. Kromer A, Moosmann B. Statin-induced liver injury involves cross-talk between cholesterol and selenoprotein biosynthetic pathways. Mol Pharmacol. 2009;75(6):1421–9. doi: 10.1124/mol.108.053678. - DOI - PubMed
    1. Thompson PD, et al. Statin-associated myopathy. JAMA. 2003;289(13):1681–90. doi: 10.1001/jama.289.13.1681. - DOI - PubMed
    1. Kobayashi M, et al. Bicarbonate supplementation as a preventive way in statins-induced muscle damage. J Pharm Pharm Sci. 2008;11(1):1–8. doi: 10.18433/J33018. - DOI - PubMed
    1. Rosenbaum D, et al. Discontinuation of statin therapy due to muscular side effects: a survey in real life. Nutr Metab Cardiovasc Dis. 2013;23(9):871–5. doi: 10.1016/j.numecd.2012.04.012. - DOI - PubMed

Publication types

MeSH terms