. 2017 Oct;4(4):041408.
doi: 10.1117/1.NPh.4.4.041408. Epub 2017 Aug 19.

Investigation of data-driven optical neuromonitoring approach during general anesthesia with sevoflurane

Affiliations

Investigation of data-driven optical neuromonitoring approach during general anesthesia with sevoflurane

Gabriela Hernandez-Meza et al. Neurophotonics. 2017 Oct.

Abstract

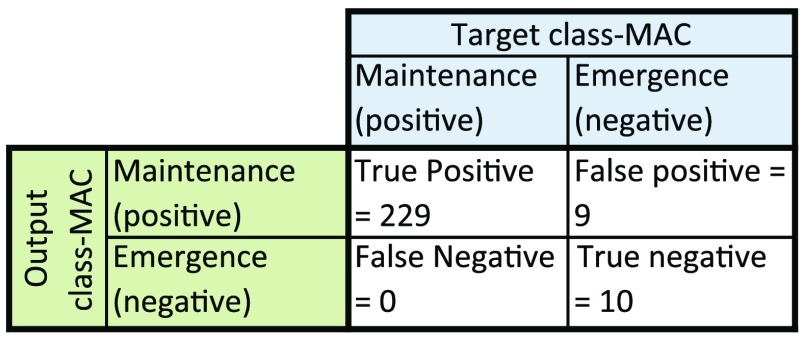
Anesthesia monitoring currently needs a reliable method to evaluate the effects of the anesthetics on its primary target, the brain. This study focuses on investigating the clinical usability of a functional near-infrared spectroscopy (fNIRS)-derived machine learning classifier to perform automated and real-time classification of maintenance and emergence states during sevoflurane anesthesia. For 19 surgical procedures, we examine the entire continuum of the maintenance-transition-emergence phases and evaluate the predictive capability of a support vector machine (SVM) classifier during these phases. We demonstrate the robustness of the predictions made by the SVM classifier and compare its performance with that of minimum alveolar concentration (MAC) and bispectral (BIS) index-based predictions. The fNIRS-SVM investigated in this study provides evidence to the usability of the fNIRS signal for anesthesia monitoring. The method presented enables classification of the signal as maintenance or emergence automatically as well as in real-time with high accuracy, sensitivity, and specificity. The features local mean HbTotal, std [Formula: see text], local min Hb and [Formula: see text], and range Hb and [Formula: see text] were found to be robust biomarkers of this binary classification task. Furthermore, fNIRS-SVM was capable of identifying emergence before movement in a larger number of patients than BIS and MAC.

Keywords: anesthesia monitoring; cerebral hemodynamics; depth of anesthesia; functional near-infrared spectroscopy; machine learning.


Figures

Fig. 1
Fig. 1
Timeline of the study in relation to phases of general anesthesia.
Fig. 2
Fig. 2
fNIRS and BIS sensor data were simultaneously collected in this study.
Fig. 3
Fig. 3
Description of the time periods studied: maintenance (M), transition (T), and light anesthesia/emergence (E).
Fig. 4
Fig. 4
Mean and 95% confidence interval of six features used in the training set (mean HbTotal, std HbO2, min Hb, min HbO2, range Hb, and range HbO2) and MAC for 19 patients represented in the training set with categories maintenance and emergence.
Fig. 5
Fig. 5
Mean and 95% confidence interval of MAC, BIS index, mean HR (bpm), mean SpO2 (%), mean EtCO2 (%), and mean MAP (mmHg) for 19 patients represented in the training set with categories of maintenance and emergence.
Fig. 6
Fig. 6
fNIRS-SVM confusion matrix.
Fig. 7
Fig. 7
(a–d) Four examples of classification results with fNIRS-SVM along with mean BIS and mean MAC versus time to emergence. The transition phase is shown in light gray. Examples “a,” “b,” and “c” show intermittent classification of emergence during maintenance. Example “d” shows continuous classification of emergence using fNIRS-SVM during the 3-min preceding movement/emergence.
Fig. 8
Fig. 8
ROC curves for fNIRS-SVM, BIS, and MAC.
Fig. 9
Fig. 9
Confusion matrix for classification of BIS.
Fig. 10
Fig. 10
Confusion matrix for classification of MAC.

References

    1. DeCou J., Johnson K., “An introduction to predictive modelling of drug concentration in anaesthesia monitors,” Anaesthesia 72(Suppl. 1), 58–69 (2017).10.1111/anae.13741 - DOI - PubMed
    1. Alkire M. T., et al. , “Cerebral metabolism during propofol anesthesia in humans studied with positron emission tomography,” Anesthesiology 82(2), 393–403 (1995).ANESAV10.1097/00000542-199502000-00010 - DOI - PubMed
    1. Alkire M. T., et al. , “Positron emission tomography study of regional cerebral metabolism in humans during isoflurane anesthesia,” Anesthesiology 86, 549–557 (1997).ANESAV10.1097/00000542-199703000-00006 - DOI - PubMed
    1. Alkire M. T., et al. , “Functional brain imaging during anesthesia in humans: effects of halothane on global and regional cerebral glucose metabolism,” Anesthesiology 90(3), 701–709 (1999).ANESAV10.1097/00000542-199903000-00011 - DOI - PubMed
    1. Patel P. M., Drummond J. C., “Cerebral physiology and the effects of anesthetic drugs,” in Miller’s Anesthesia, Miller R. D., Ed., Vol. 1, pp. 594–674, Churchill-Livingstone, Philadelphia: (2010).