Disease stage-dependent relationship between diffusion tensor imaging and electrophysiology of the visual system in a murine model of multiple sclerosis
- PMID: 28840346
- PMCID: PMC6394834
- DOI: 10.1007/s00234-017-1904-1
Disease stage-dependent relationship between diffusion tensor imaging and electrophysiology of the visual system in a murine model of multiple sclerosis
Abstract
Purpose: Diffusion tensor imaging (DTI) is commonly used to evaluate white matter integrity in multiple sclerosis (MS), but the relationship between DTI measures and functional changes during disease remains ambiguous. Using a mouse model of MS, we tested the hypothesis that DTI measures would correlate to the visual evoked potential (VEPs) dynamically at different disease stages.
Methods: In vivo DTI, gadolinium-enhanced T1WI (Gd-T1WI) and VEPs were performed in 5 control and 25 mice after 2-12 weeks of experimental autoimmune encephalomyelitis (EAE). DTI indices, including fractional anisotropy (FA), axial and radial diffusivities (AD and RD), and Gd-T1WI enhancement, were measured in the optic nerve and tract (ON and OT), which were compared with measured VEPs.
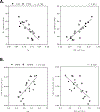
Results: Gd-T1WI showed a 3- to 4-fold enhancement over controls beginning after 2 weeks of EAE. Across the time course, we found progressive reductions in FA and increases in RD with increases in VEP latency and reductions in amplitude. Significant correlations between DTI (FA and RD) and VEP evolved; in control/early asymptomatic EAE mice, both FA and RD were highly correlated with VEP latency (but not amplitude), while in late EAE, both DTI indices were highly correlated with VEP amplitude (but not latency).
Conclusion: DTI measures FA and RD are associated to VEP latency in early stages of EAE but associated to VEP amplitude in later stages, suggesting that the patterns of DTI related to the functional decline may depend on the stage of disease progression.
Keywords: Diffusion tensor imaging (DTI); Experimental autoimmune encephalomyelitis (EAE); Gd-enhanced T1WI (Gd-T1WI); Multiple sclerosis (MS); Visual evoked potential (VEP).
Conflict of interest statement
Figures


Similar articles
-
Using the Anterior Visual System to Assess Neuroprotection and Remyelination in Multiple Sclerosis Trials.Curr Neurol Neurosci Rep. 2018 Jun 19;18(8):49. doi: 10.1007/s11910-018-0858-y. Curr Neurol Neurosci Rep. 2018. PMID: 29923130 Review.
-
Exploring experimental autoimmune optic neuritis using multimodal imaging.Neuroimage. 2018 Jul 15;175:327-339. doi: 10.1016/j.neuroimage.2018.04.004. Epub 2018 Apr 6. Neuroimage. 2018. PMID: 29627590
-
Sequential phases of RGC axonal and somatic injury in EAE mice examined using DTI and OCT.Mult Scler Relat Disord. 2019 Jan;27:315-323. doi: 10.1016/j.msard.2018.11.010. Epub 2018 Nov 13. Mult Scler Relat Disord. 2019. PMID: 30469023 Free PMC article.
-
Deciphering the microstructure of hippocampal subfields with in vivo DTI and NODDI: Applications to experimental multiple sclerosis.Neuroimage. 2018 May 15;172:357-368. doi: 10.1016/j.neuroimage.2018.01.061. Epub 2018 Jan 31. Neuroimage. 2018. PMID: 29409838
-
The role of diffusion tensor imaging and fractional anisotropy in the evaluation of patients with idiopathic normal pressure hydrocephalus: a literature review.Neurosurg Focus. 2016 Sep;41(3):E12. doi: 10.3171/2016.6.FOCUS16192. Neurosurg Focus. 2016. PMID: 27581308 Review.
Cited by
-
Using the Anterior Visual System to Assess Neuroprotection and Remyelination in Multiple Sclerosis Trials.Curr Neurol Neurosci Rep. 2018 Jun 19;18(8):49. doi: 10.1007/s11910-018-0858-y. Curr Neurol Neurosci Rep. 2018. PMID: 29923130 Review.
-
Visual pathways evaluation in Kearns Sayre syndrome: a diffusion tensor imaging study.Neuroradiology. 2020 Feb;62(2):241-249. doi: 10.1007/s00234-019-02302-0. Epub 2019 Nov 4. Neuroradiology. 2020. PMID: 31680196
-
Functional evolution of visual involvement in experimental autoimmune encephalomyelitis.Mult Scler J Exp Transl Clin. 2020 Oct 28;6(4):2055217320963474. doi: 10.1177/2055217320963474. eCollection 2020 Oct-Dec. Mult Scler J Exp Transl Clin. 2020. PMID: 35145730 Free PMC article.
References
-
- Polman CH, Reingold SC, Banwell B, Clanet M, Cohen JA, Filippi M, Fujihara K, Havrdova E, Hutchinson M, Kappos L, Lublin FD, Montalban X, O’Connor P, Sandberg-Wollheim M, Thompson AJ, Waubant E, Weinshenker B, Wolinsky JS (2011) Diagnostic criteria for multiple sclerosis: 2010 revisions to the McDonald criteria. Ann Neurol 69 (2):292–302. doi:10.1002/ana.22366 - DOI - PMC - PubMed
-
- Kolbe S, Chapman C, Nguyen T, Bajraszewski C, Johnston L, Kean M, Mitchell P, Paine M, Butzkueven H, Kilpatrick T, Egan G (2009) Optic nerve diffusion changes and atrophy jointly predict visual dysfunction after optic neuritis. Neuroimage 45 (3):679–686. doi:10.1016/j.neuroimage.2008.12.047 S1053-8119(08)01337-2 [pii] - DOI - PubMed
MeSH terms
Substances
Grants and funding
LinkOut - more resources
Full Text Sources
Other Literature Sources
Medical
Miscellaneous

