. 2018 Jan;22(1):600-612.
doi: 10.1111/jcmm.13347. Epub 2017 Aug 25.

The enhancement of combination of berberine and metformin in inhibition of DNMT1 gene expression through interplay of SP1 and PDPK1

Affiliations

The enhancement of combination of berberine and metformin in inhibition of DNMT1 gene expression through interplay of SP1 and PDPK1

Fang Zheng et al. J Cell Mol Med. 2018 Jan.

Abstract

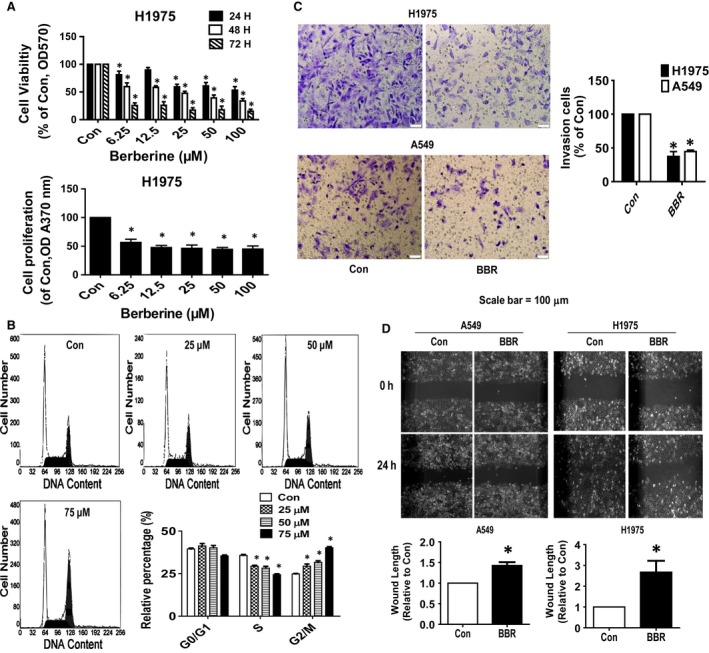
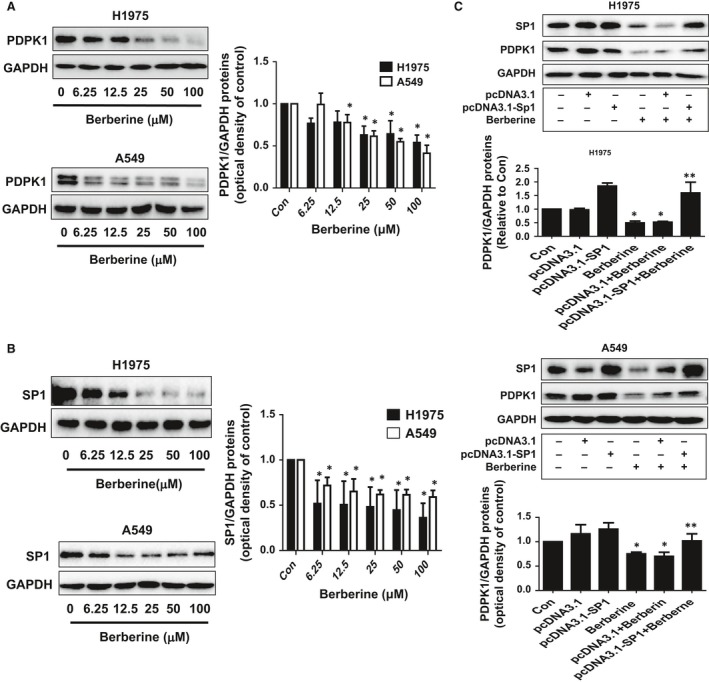
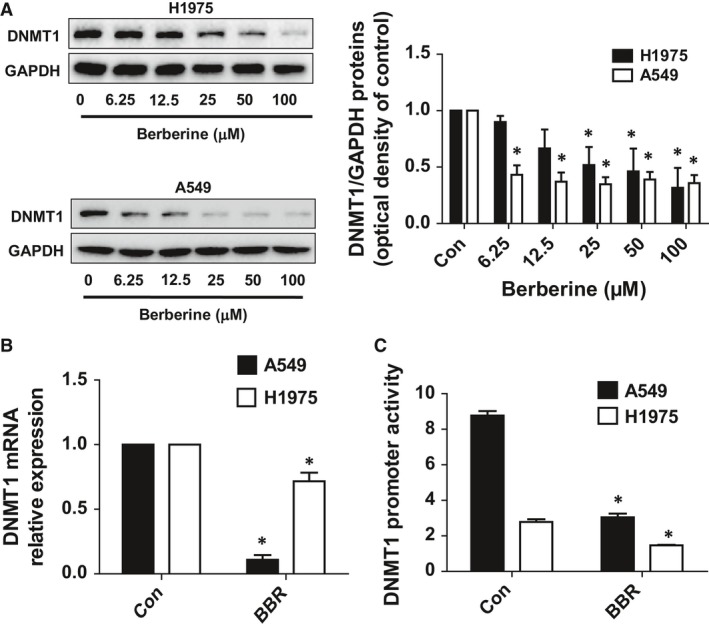
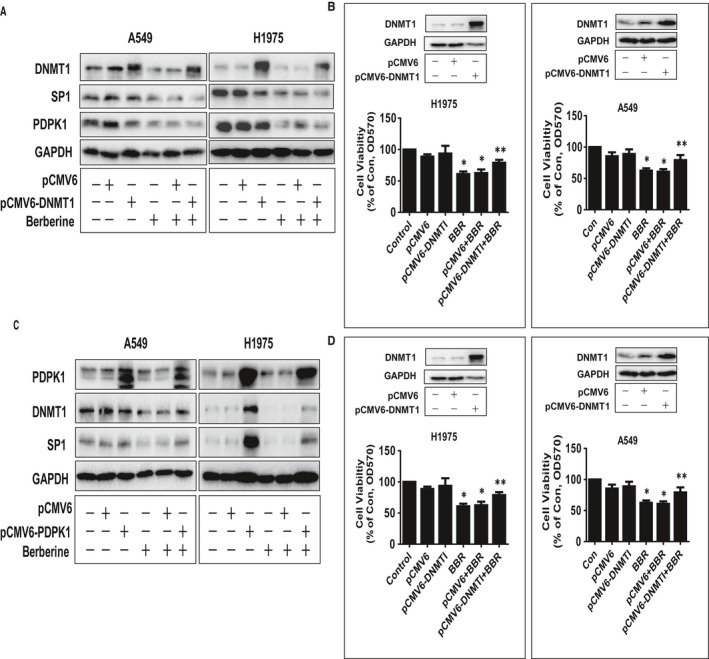
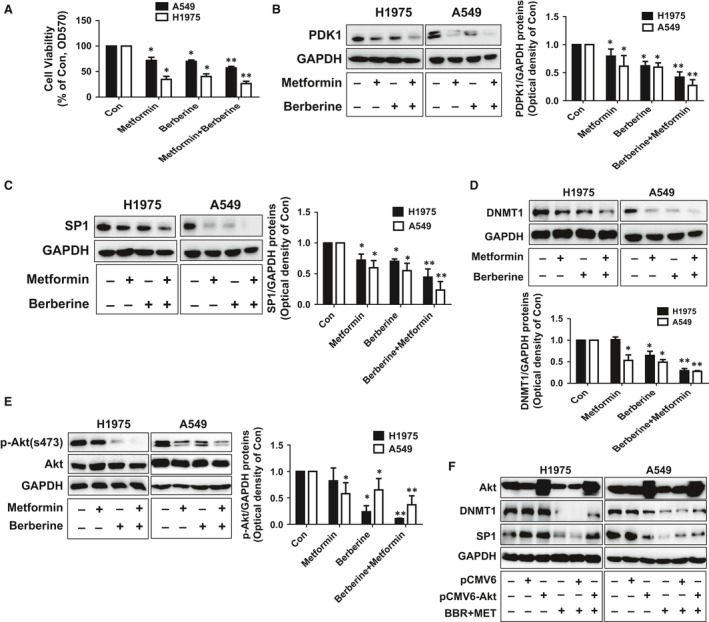
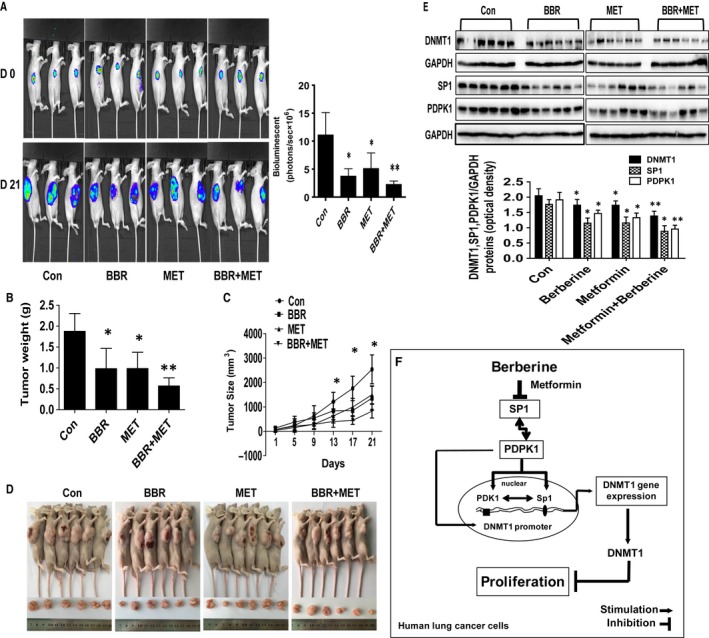
Berberine (BBR), one of active alkaloid found in the rhizome, exhibited anti-cancer properties. We have showed that BBR inhibited growth of non-small cell lung cancer (NSCLC) cells through mitogen-activated protein kinase (MAPK)-mediated increase in forkhead box O3a (FOXO3a). However, the in-depth mechanism underlying the anti-tumor effects still remained to be elucidated. Herein, we further confirmed that BBR not only induced cell cycle arrest, but also reduced migration and invasion of NSCLC cells. Mechanistically, we observed that BBR reduced 3-phosphoinositide-dependent protein kinase-1 (PDPK1) and transcription factor SP1 protein expressions. Exogenously expressed SP1 overcame BBR-inhibited PDPK1 expression. Moreover, BBR inhibited DNA methyltransferase 1 (DNMT1) gene expression and overexpressed DNMT1 resisted BBR-inhibited cell growth. Intriguingly, overexpressed PDPK1 antagonized BBR-inhibited SP1 and DNMT1 expressions. Finally, metformin enhanced the effects of BBR both in vitro and in vivo. Collectively, we observe that BBR inhibits proliferation of NSCLC cells through inhibition of SP1 and PDPK1; this results in a reduction of DNMT1 expression. The interplay of PDPK1 and SP1 contributes to the inhibition of DNMT1 in response to BBR. In addition, there is a synergy of BBR and metformin. This study uncovers a new mechanism of BBR in combination with metformin for NSCLC-associated therapy.

Keywords: Berberine; DNMT1; Metformin; NSCLC; PDPK1; SP1.


Figures

Figure 1
Figure 1
BBR inhibited growth, migration, invasion, and induced cell cycle arrest in lung cancer cells. (A–B) H1975 cells were treated with increased concentrations of BBR for up to 72 hrs to examine the cell viability by MTT and colorimetric BrdU ELISA methods as described in the Materials and Methods section. (C) H1975 cells were treated with BBR (50 μM) for up to 24 hrs. Shown are representative images of fixed and crystal violet‐stained H1650 cell invasion on the Matrigel‐coated inserts in the presence of vehicle control (Con), and 50 μM BBR. Scale bar = 100 μm. *indicates a significant difference from the control group (P < 0.05). (D) Cell migration ability was determined by scratching confluent A549 and H1975 cell monolayers with a pipette tip. Cells were incubated with BBR (50 μM) for 24 hrs. The extent of migration in each sample was photographed by Axiovert 200 microscope (magnification, ×100) and expressed as relative to control (0 hr). Values are given as the mean ± S.D. from three independent experiments. *indicates a significant difference from the control group (P < 0.05).
Figure 2
Figure 2
BBR decreased protein expression of PDPK1 and SP1. (A–B) A549 and H1975 cells were exposed to increased concentrations of BBR for 24 hrs, followed by measuring PDPK1 and SP1 proteins by Western blot. (C) A549 and H1975 cells were transfected with the control or expression constructs of SP1 for 24 hrs before exposing the cells to BBR for an additional 24 hrs. Afterwards, SP1 and PDPK1 protein expressions were determined using Western blot. Figures are representative cropped gels/blots that have been run under the same experimental conditions. Values are given as the mean ± S.D. from three independent experiments. *indicates a significant difference from the control group (P < 0.05).
Figure 3
Figure 3
BBR inhibited DNMT1 mRNA, protein and promoter activity. (A‐B) A549 and H1975 cells were exposed to increased doses of BBR for 24 hrs, followed by measuring the protein, mRNA expressions of DNMT1 by Western Blot and qRT‐PCR, respectively. Figures are representative cropped gels/blots that have been run under the same experimental conditions. (C) A549 and H1975 cells were transfected with wild‐type human DNMT1 promoter reporter construct ligated to luciferase reporter gene and internal control secreted alkaline phosphatase for 24 hrs, followed by treating with BBR for an additional 24 hrs. Afterwards, the promoter activities were determined using the Secrete‐Pair Dual Luminescence Assay Kit as described in the Materials and Methods section. Values in bar graphs were given as the mean ± S.D. from three independent experiments performed in triplicate. * indicates significant difference as compared to the untreated control group (P < 0.05).
Figure 4
Figure 4
Overexpression of DNMT1 resisted cell growth inhibition affected by BBR. (A) A549 and H1975 cells were transfected with the control (pCMV6) or expression constructs of DNMT1 for 24 hrs before exposing the cells to BBR (50 μM) for an additional 24 hrs. Afterwards, PDPK1, SP1 and DNMT1 proteins were determined by Western blot. Figures are representative cropped gels/blots that have been run under the same experimental conditions. (B) A549 and H1975 cells were transfected with the control or expression constructs of DNMT1 for 24 hrs before exposing the cells to BBR (50 μM) for an additional 48 hrs. Afterwards, the cell viability was determined using the MTT assay as described in the Materials and Methods section. Insert on the upper panel represented the protein levels of DNMT1 as determined using Western blot. GAPDH was used as internal control. (C) A549 and H1975 cells were transfected with the control (pCMV6) or expression constructs of PDPK1 for 24 hrs before exposing the cells to BBR (50 μM) for an additional 24 hrs. Afterwards, PDPK1, SP1 and DNMT1 proteins were determined by Western blot. GAPDH was used as control. Figures are representative cropped gels/blots that have been run under the same experimental conditions. (D) A549 and H1975 cells were transfected with the control (pCMV6) or expression constructs of PDPK1, and wild‐type human DNMT1 promoter reporter construct ligated to luciferase reporter gene and internal control secreted alkaline phosphatase for 24 hrs, followed by treating with BBR for an additional 24 hrs. Afterwards, the promoter activities were determined using the Secrete‐Pair Dual Luminescence Assay Kit as described in the Materials and Methods section. Insert on the upper panel represented the protein levels of PDPK1 as determined using Western blot. Values in bar graphs were given as the mean ± S.D. from three independent experiments. * indicates significant difference as compared to the untreated control group (P < 0.05). ** indicates significant difference from the BBR treated alone (P < 0.05).
Figure 5
Figure 5
The synergistic effects of BBR and MET. (A) A549 and H1975 cells were exposed to BBR (50 μM) and MET (10 mM) for 24 hrs. Afterwards, the cell viability was determined using the MTT assay as described in the Materials and Methods section, and was expressed as percentage of control in the mean ± S.D. of three separate experiments. (B–D) A549 and H1975 cells were exposed to BBR (50 μM) and MET (10 mM) for 24 hrs, followed by measuring the protein expression of SP1, PDPK1 and DNMT1 by Western blot. (E) A549 and H1975 cells were exposed to BBR (50 μM) and MET (10 mM) for 24 hrs, followed by measuring the phosphorylation and protein expression of Akt by Western blot. The figures are representative cropped gels/blots that have been run under the same experimental conditions. (F) A549 and H1975 cells were transfected with the control (pCMV6) or expression constructs of Akt for 24 hrs before exposing the cells to BBR (50 μM) and MET (10 mM) for an additional 24 hrs. Afterwards, Akt, SP1 and DNMT1 proteins were determined by Western blot. GAPDH was used as control. Figures are representative cropped gels/blots that have been run under the same experimental conditions. * indicates significant difference as compared to the untreated control group (P < 0.05); ** indicates significance of combination treatment as compared to BBR alone (P < 0.05). The bar graphs represent the mean ± S.D. of PDPK1/SP1/DNMT1/GAPDH of three independent experiments.
Figure 6
Figure 6
In vivo anti‐tumour efficacy of BBR in mice. Mice (n = 6/group) were divided into four groups [Con (saline), BBR alone (10 mg/kg), metformin (MET, 250 mg/kg) and the combination of BBR and metformin, which were given at the 1 week after tumour cells injection by either intraperitoneal injection or gavages for up to 21 days. (A) The xenografts were assessed by in vivo bioluminescence imaging at the day 0 and the end of the experiments (on day 21). The tumour growth was monitored by injecting luciferin in the mice followed by measuring bioluminescence and quantification of signals were controlled by the acquisition and analysis software as described in the Materials and Methods section. Representative images in all groups are shown. (B‐C) The xenografts were harvested on day 21, and the volume and weight of tumours were measured. (D) The photographs of vehicle‐ and drugs‐treated xenografts derived from nude mice are shown. (E) At the end of the experiments, xenografted tumours from the high dose and control groups were isolated from individual animals, and the corresponding lysates were processed for detecting PDPK1, SP1 and DNMT1 by Western blot. GAPDH was used as loading control. Figures are representative cropped gels/blots that have been run under the same experimental conditions. The bar graphs represented the tumour weight and volume of mice results of as mean ± S.D. * indicates the significant difference from the untreated control (P < 0.05). (F) The diagram shows that BBR inhibits growth of NSCLC cells through inhibition of SP1 and PDPK1; subsequently, this results in the reduction of DNMT1 gene expression. The interplay of PDPK1 and SP1 contribute to the inhibition of DNMT1 in response to BBR. In addition, there is a potential synergy of BBR and MET.

Similar articles

Cited by

References

    1. Torre LA, Siegel RL, Jemal A. Lung Cancer Statistics. Adv Exp Med Biol. 2016; 893: 1–19. - PubMed
    1. Dudani S, Leighl NB, Ho C, et al Approach to the non‐operative management of patients with stage II non‐small cell lung cancer (NSCLC): a survey of Canadian medical and radiation oncologists. Lung Cancer. 2016; 94: 74–80. - PubMed
    1. Hussain S. Nanomedicine for Treatment of Lung Cancer. Adv Exp Med Biol. 2016; 890: 137–47. - PubMed
    1. Han Y, Wang H, Xu W, et al Chinese herbal medicine as maintenance therapy for improving the quality of life for advanced non‐small cell lung cancer patients. Complement Ther Med. 2016; 24: 81–9. - PubMed
    1. Wu X, Chung VC, Lu P, et al Chinese herbal medicine for improving quality of life among nonsmall cell lung cancer patients: overview of systematic reviews and network meta‐analysis. Medicine (Baltimore). 2016; 95: e2410. - PMC - PubMed

Publication types

MeSH terms