. 2017 Oct-Dec;7(4):777-792.
doi: 10.1177/2045893217731295. Epub 2017 Sep 12.

Single cell cloning generates lung endothelial colonies with conserved growth, angiogenic, and bioenergetic characteristics

Affiliations

Single cell cloning generates lung endothelial colonies with conserved growth, angiogenic, and bioenergetic characteristics

Ji Young Lee et al. Pulm Circ. 2017 Oct-Dec.

Abstract

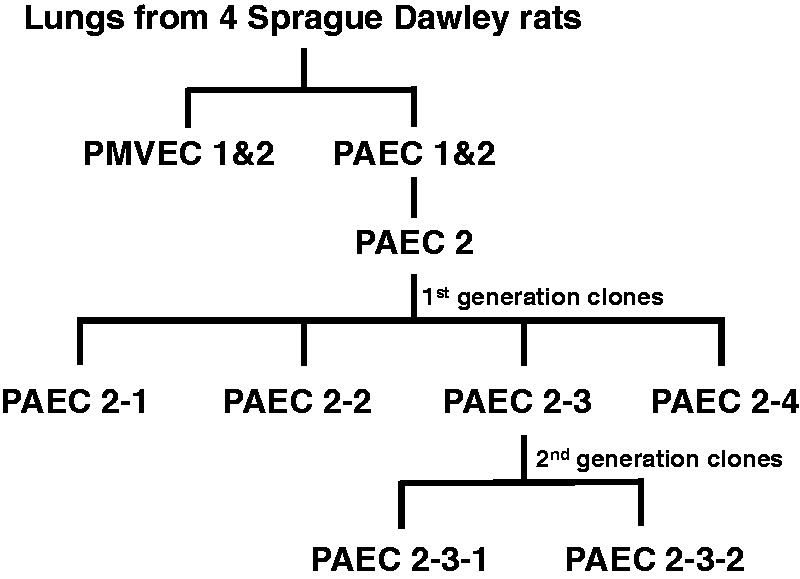
Pulmonary artery, capillary, and vein endothelial cells possess distinctive structures and functions, which represent a form of vascular segment specific macroheterogeneity. However, within each of these segmental populations, individual cell functional variability represents a poorly characterized microheterogeneity. Here, we hypothesized that single cell clonogenic assays would reveal microheterogeneity among the parent cell population and enable isolation of highly representative cells with committed parental characteristics. To test this hypothesis, pulmonary microvascular endothelial cells (PMVECs) and pulmonary arterial endothelial cells (PAECs) were isolated from different Sprague Dawley rats. Serum stimulated proliferation of endothelial populations and single cell clonogenic potential were evaluated. In vitro Matrigel assays were utilized to analyze angiogenic potential and the Seahorse assay was used to evaluate bioenergetic profiles. PMVEC populations grew faster and had a higher proliferative potential than PAEC populations. Fewer PMVECs were needed to form networks on Matrigel when compared with PAECs. PMVECs primarily utilized aerobic glycolysis, while PAECs relied more heavily on oxidative phosphorylation, to support bioenergetic demands. Repeated single cell cloning and expansion of PAEC colonies generated homogeneous first-generation clones that were highly reflective of the parental population in terms of growth, angiogenic potential, and bioenergetic profiles. Repeated single cell cloning of the first-generation clones generated second-generation clones with increased proliferative potential while maintaining other parental characteristics. Second-generation clones were highly homogeneous populations. Thus, single cell cloning reveals microheterogeneity among the parent cell population and enables isolation of highly representative cells with parental characteristics.

Keywords: aerobic glycolysis; heterogeneity; metabolism; proliferation; pulmonary circulation.


Figures

Fig. 1.
Fig. 1.
PMVECs grow faster, have a high proliferative potential, and have a propensity to form networks. (a) Serum stimulated growth of PMVECs and PAECs were assessed for seven days. PMVECs grew faster than PAECs. Data represent mean ± standard deviation. One-way ANOVA was used to assess significance over the seven-day time course and two-way ANOVA and Bonferroni post hoc tests were used to compare between cell types. For each cell type, two separate experiments were performed using a total of four wells. * denotes significantly different (P < 0.05) in PMVECs vs. PAECs (n = number of different cell types, 2 and 4 for PMVECs and PAECs, respectively). ^denotes significantly different (P < 0.05) from baseline at day 1. (b) PMVECs and PAECs were seeded one cell per well on 96-well plates, four plates per cell type, by FACS sorter. Plates were examined on day 14. PMVECs had a higher percentage of medium and large colonies than PAECs. Data represent the average of percent colony counts for each colony size. Student's t-test was used to compare the percentages of different colony sizes between PMVECs and PAECs. *denotes significant difference (P < 0.05) in small colony counts (<500 cells) between PMVECs and PAECs groups (n = 2 and 4, respectively). (c, d) PMVECs and PAECs were seeded on Matrigel coated 96-well plates at 4.0 × 104 and 8.0 × 104 cells per well, respectively. Images were obtained 24 h after seeding at 10 × magnification. (c) Representative images are shown for each cell type. (d) Networks were quantified by ImageJ software. PMVECs formed networks with relatively thin webs and larger luminal areas compared to PAECs. Data represent mean ± standard deviation. Images from three independent experiments were used for each group. Student's t-test was used to compare two cell types. *denotes significant difference (P < 0.05).
Fig. 1.
Fig. 1.
PMVECs grow faster, have a high proliferative potential, and have a propensity to form networks. (a) Serum stimulated growth of PMVECs and PAECs were assessed for seven days. PMVECs grew faster than PAECs. Data represent mean ± standard deviation. One-way ANOVA was used to assess significance over the seven-day time course and two-way ANOVA and Bonferroni post hoc tests were used to compare between cell types. For each cell type, two separate experiments were performed using a total of four wells. * denotes significantly different (P < 0.05) in PMVECs vs. PAECs (n = number of different cell types, 2 and 4 for PMVECs and PAECs, respectively). ^denotes significantly different (P < 0.05) from baseline at day 1. (b) PMVECs and PAECs were seeded one cell per well on 96-well plates, four plates per cell type, by FACS sorter. Plates were examined on day 14. PMVECs had a higher percentage of medium and large colonies than PAECs. Data represent the average of percent colony counts for each colony size. Student's t-test was used to compare the percentages of different colony sizes between PMVECs and PAECs. *denotes significant difference (P < 0.05) in small colony counts (<500 cells) between PMVECs and PAECs groups (n = 2 and 4, respectively). (c, d) PMVECs and PAECs were seeded on Matrigel coated 96-well plates at 4.0 × 104 and 8.0 × 104 cells per well, respectively. Images were obtained 24 h after seeding at 10 × magnification. (c) Representative images are shown for each cell type. (d) Networks were quantified by ImageJ software. PMVECs formed networks with relatively thin webs and larger luminal areas compared to PAECs. Data represent mean ± standard deviation. Images from three independent experiments were used for each group. Student's t-test was used to compare two cell types. *denotes significant difference (P < 0.05).
Fig. 2.
Fig. 2.
Whereas PMVECs utilize aerobic glycolysis, PAECs are more reliant on oxidative phosphorylation, to meet metabolic demands. (a–e) PMVECs and PAECs were grown to confluence in 100-mm dishes and the principal bioenergetic pathways were determined by mitochondrial (a–c) and glycolysis (d) stress tests, using the Seahorse extracellular flux analyzer. (a, d) OCR and ECAR at baseline and with mitochondrial (oligomycin, FCCP, and rotenone) and glycolytic (glucose, oligomycin, and 2-DG) stressors are shown over time. PMVECs utilize aerobic glycolysis whereas PAECs utilize oxidative phosphorylation as their primary metabolic pathway. Data represent mean ± standard error. Two-way ANOVA and Bonferroni post hoc test were used to compare between cell types. Results from five independent experiments, each with five replicates, a total of 20–30 wells per group are shown. *denotes significantly different (P < 0.05) in PMVECs vs. PAECs (n = 4–5 per group). (b) OCR and ECAR at baseline of mitochondrial stress test at three different time points are depicted. Each dot represents the value of each individual well. (c) Basal OCR, ATP-linked respiration (average basal OCR – oligomycin response), maximal respiration (FCCP response) and spare capacity (maximal OCR – average basal OCR) are noted. (e) OCR at baseline of glycolysis stress test at three different time points are depicted. Each dot represents the value of individual well. Student's t-test was used. *denotes significant difference (P < 0.05) between PMVECs and PAECs groups. Each dot represents the value of individual well at each time point.
Fig. 2.
Fig. 2.
Whereas PMVECs utilize aerobic glycolysis, PAECs are more reliant on oxidative phosphorylation, to meet metabolic demands. (a–e) PMVECs and PAECs were grown to confluence in 100-mm dishes and the principal bioenergetic pathways were determined by mitochondrial (a–c) and glycolysis (d) stress tests, using the Seahorse extracellular flux analyzer. (a, d) OCR and ECAR at baseline and with mitochondrial (oligomycin, FCCP, and rotenone) and glycolytic (glucose, oligomycin, and 2-DG) stressors are shown over time. PMVECs utilize aerobic glycolysis whereas PAECs utilize oxidative phosphorylation as their primary metabolic pathway. Data represent mean ± standard error. Two-way ANOVA and Bonferroni post hoc test were used to compare between cell types. Results from five independent experiments, each with five replicates, a total of 20–30 wells per group are shown. *denotes significantly different (P < 0.05) in PMVECs vs. PAECs (n = 4–5 per group). (b) OCR and ECAR at baseline of mitochondrial stress test at three different time points are depicted. Each dot represents the value of each individual well. (c) Basal OCR, ATP-linked respiration (average basal OCR – oligomycin response), maximal respiration (FCCP response) and spare capacity (maximal OCR – average basal OCR) are noted. (e) OCR at baseline of glycolysis stress test at three different time points are depicted. Each dot represents the value of individual well. Student's t-test was used. *denotes significant difference (P < 0.05) between PMVECs and PAECs groups. Each dot represents the value of individual well at each time point.
Fig. 3.
Fig. 3.
Cell nomenclature is shown in the study design. PMVECs and PAECs were isolated from the lungs of four different male Sprague Dawley rats. PMVECs were isolated from two different rats (PMVEC 1 and 2), and PAECs were isolated from two separate rats (PAEC 1 and 2). PAEC 2 was single cell cloned to generate four randomly selected first-generation colonies, PAEC 2-1, 2-2, 2-3, and 2-4. PAEC 2-3 was single cell cloned to generate two second-generation colonies, PAEC 2-3-1 and 2-3-2.
Fig. 4.
Fig. 4.
First generation PAEC 2 clones closely mimic their parent population. (a) Serum stimulated growth of four first-generation clones of PAEC 2 were assessed. PAEC 2-1, 2-2, and 2-3 grew at a similar growth rate as their parent population. PAEC 2-4 showed decreased growth rate compared to the other clones. Data represent mean ± standard deviation. Two-way ANOVA and Bonferroni post hoc tests were used to compare between cell types. For each cell type, two separate experiments were performed using a total of four wells. The PAEC 2 growth curve is depicted as a dotted line for a reference. *denotes significantly different (P < 0.05; PAEC 2-4 vs. PAEC 2-1, 2-2, or 2-3). Data were gathered from two independent experiments with four wells per group. PAEC 2 mean cell number values from Fig. 1a are depicted in a broken line for a reference. (b) PAEC 2-1, 2-2, 2-3 and 2-4 were seeded one cell per well on 96-well plates, four plates per cell type, by FACS sorting. Plates were examined on day 14. Only PAEC 2-3 had visible small-sized colonies, whereas PAEC 2-1, 2-2, and 2-4 did not grow discernible colonies. Data represent a total number of colonies in four plates. (c) PAEC 2 first generation clones were seeded on Matrigel coated 96-well plates at 8.0 × 104 cells per well. Images were obtained 24 h after seeding at 10 × magnification. All first-generation PAEC 2 clones formed networks similar to their parent population. (d–f) The principal bioenergetic pathways utilized by PAEC 2 first-generation clones were determined by mitochondrial (d, e) and glycolysis (f) stress tests using the Seahorse extracellular flux analyzer. OCR and ECAR at baseline and with different mitochondrial (oligomycin, FCCP, and rotenone) and glycolytic (glucose, oligomycin, and 2-DG) stressors are shown over time. There was no significant difference between groups. Data represent mean ± standard error. (d, f) Two-way ANOVA and Bonferroni post hoc test were used to compare between cell types. Results from three independent experiments, each with five replicates, a total of 15 wells per group are shown. Mean values of OCR and ECAR of PAEC 2 from Fig. 2a and d are depicted in broken lines for references. For the purposes of clarity standard deviation has been removed. *denotes significant difference (P < 0.05) PAEC 2 vs. 2-1, 2-2, 2-3, or 2-4 (n = 3 per group). (e) Basal OCR, ATP-linked respiration (average basal OCR – oligomycin response), maximal respiration (FCCP response), and spare capacity (maximal OCR – average basal OCR) are noted. One-way ANOVA and Bonferroni post hoc test were used to compare between cell types. Each dot represents the value of individual well at each time point. *denotes significant difference between PAEC 2-1 vs. 2-4. ^denotes significant difference between PAEC 2-2 vs. 2-4.
Fig. 4.
Fig. 4.
First generation PAEC 2 clones closely mimic their parent population. (a) Serum stimulated growth of four first-generation clones of PAEC 2 were assessed. PAEC 2-1, 2-2, and 2-3 grew at a similar growth rate as their parent population. PAEC 2-4 showed decreased growth rate compared to the other clones. Data represent mean ± standard deviation. Two-way ANOVA and Bonferroni post hoc tests were used to compare between cell types. For each cell type, two separate experiments were performed using a total of four wells. The PAEC 2 growth curve is depicted as a dotted line for a reference. *denotes significantly different (P < 0.05; PAEC 2-4 vs. PAEC 2-1, 2-2, or 2-3). Data were gathered from two independent experiments with four wells per group. PAEC 2 mean cell number values from Fig. 1a are depicted in a broken line for a reference. (b) PAEC 2-1, 2-2, 2-3 and 2-4 were seeded one cell per well on 96-well plates, four plates per cell type, by FACS sorting. Plates were examined on day 14. Only PAEC 2-3 had visible small-sized colonies, whereas PAEC 2-1, 2-2, and 2-4 did not grow discernible colonies. Data represent a total number of colonies in four plates. (c) PAEC 2 first generation clones were seeded on Matrigel coated 96-well plates at 8.0 × 104 cells per well. Images were obtained 24 h after seeding at 10 × magnification. All first-generation PAEC 2 clones formed networks similar to their parent population. (d–f) The principal bioenergetic pathways utilized by PAEC 2 first-generation clones were determined by mitochondrial (d, e) and glycolysis (f) stress tests using the Seahorse extracellular flux analyzer. OCR and ECAR at baseline and with different mitochondrial (oligomycin, FCCP, and rotenone) and glycolytic (glucose, oligomycin, and 2-DG) stressors are shown over time. There was no significant difference between groups. Data represent mean ± standard error. (d, f) Two-way ANOVA and Bonferroni post hoc test were used to compare between cell types. Results from three independent experiments, each with five replicates, a total of 15 wells per group are shown. Mean values of OCR and ECAR of PAEC 2 from Fig. 2a and d are depicted in broken lines for references. For the purposes of clarity standard deviation has been removed. *denotes significant difference (P < 0.05) PAEC 2 vs. 2-1, 2-2, 2-3, or 2-4 (n = 3 per group). (e) Basal OCR, ATP-linked respiration (average basal OCR – oligomycin response), maximal respiration (FCCP response), and spare capacity (maximal OCR – average basal OCR) are noted. One-way ANOVA and Bonferroni post hoc test were used to compare between cell types. Each dot represents the value of individual well at each time point. *denotes significant difference between PAEC 2-1 vs. 2-4. ^denotes significant difference between PAEC 2-2 vs. 2-4.
Fig. 5.
Fig. 5.
Second-generation PAEC 2 clones mimic the parent population and possess increased replication competence. (a) Serum stimulated growth of two PAEC 2-3 second-generation clones were assessed. There was no significant difference between groups when compared to the parent population. Data represent mean ± standard deviation. Two-way ANOVA and Bonferroni post hoc test were used to compare between cell types. ns denotes not significant. PAEC 2-3 growth curves are depicted as a dotted line for a reference. PAEC 2-2 mean values of cell number from Fig. 2a are depicted in a broken line for a reference. (b, c) PAEC 2-3-1 and 2-3-2 were seeded one cell per well on 96-well plates, four plates per cell type, by FACS sorting. (b) Plates were examined on day 14. There was no significant difference between groups in total numbers of colony counts. The absolute colony counts are increased in both PAEC 2-3-1 and 2-3-2 compared to PAEC 2-3. Data represent number of colonies per plate, mean ± standard deviation. Unpaired t-test was used to compare between two groups. ns, not significant. A total number of colonies observed in single cell clonogenic assays of PAEC 2-3 is depicted in a broken line for a reference. (c) Plates were reexamined on day 28. Over this extended time course, both second-generation PAEC 2 clones reconstituted a hierarchy of small- to large-sized colonies. PAEC 2-3-1 had a lower number of large-sized colonies than PAEC 2-3-2. *denotes significantly different (P < 0.05) compared to PAEC 2-3-1 vs. 2-3-2 in small-sized colonies. ns, not significant. # denotes significantly different (P < 0.05) compared to PAEC 2-3-1 vs. PAEC 2-3-2 in large-sized colonies. (d) Cells were seeded on Matrigel (30 µL per well) coated 96-well plates at densities of 8.0 × 104 cells depending on a cell type at a total cell solution volume of 80 µL. Cells were incubated at 37 ℃ with 5% CO2-room air for 24 h and then observed and pictures taken. Images are at 10 × magnification. Both PAEC 2-3-1 and 2-3-2 formed thin networks with large luminal areas similar to those of PAEC 2 and 2-3. (e–h) The principal bioenergetic pathways utilized by PAEC 2-3-1 and 2-3-2 were determined by mitochondrial (e–g) and glycolysis (h) stress tests using the Seahorse extracellular flux analyzer. OCR and ECAR at baseline and with different mitochondrial (oligomycin, FCCP, and rotenone) and glycolytic (glucose, oligomycin, and 2-DG) stressors are shown over time. PAEC 2-3-1 showed decreased aerobic glycolysis and increased oxidative phosphorylation when compared to PAEC 2-3-2. OCR and ECAR patterns of 2-3-2 closely mimicked those of PAEC 2-3. Data represent mean ± standard error. Two-way ANOVA and Bonferroni post hoc test were used to compare between cell types. Results from three independent experiments, each with five replicates, a total of 15 wells per group are shown. *denotes significantly different (P < 0.05) in PAEC 2-3-1 vs. PAEC 2-3-2 (n = 3 per group). Mean values of OCR and ECAR of PAEC 2-3 from Fig. 4d and f are depicted in broken lines for references. For the purposes of clarity standard deviation has been removed. (f) Basal OCR, ATP-linked respiration (average basal OCR – oligomycin response), maximal respiration (FCCP response), and spare capacity (maximal OCR – average basal OCR) are noted. (g) ECAR at baseline of mitochondrial stress test at three different time points are depicted. Each dot represents the value of individual well at each time point. Student's t-test was used. *denotes significant difference (P < 0.05) between PAEC 2-3-1 vs. 2-3-2.
Fig. 5.
Fig. 5.
Second-generation PAEC 2 clones mimic the parent population and possess increased replication competence. (a) Serum stimulated growth of two PAEC 2-3 second-generation clones were assessed. There was no significant difference between groups when compared to the parent population. Data represent mean ± standard deviation. Two-way ANOVA and Bonferroni post hoc test were used to compare between cell types. ns denotes not significant. PAEC 2-3 growth curves are depicted as a dotted line for a reference. PAEC 2-2 mean values of cell number from Fig. 2a are depicted in a broken line for a reference. (b, c) PAEC 2-3-1 and 2-3-2 were seeded one cell per well on 96-well plates, four plates per cell type, by FACS sorting. (b) Plates were examined on day 14. There was no significant difference between groups in total numbers of colony counts. The absolute colony counts are increased in both PAEC 2-3-1 and 2-3-2 compared to PAEC 2-3. Data represent number of colonies per plate, mean ± standard deviation. Unpaired t-test was used to compare between two groups. ns, not significant. A total number of colonies observed in single cell clonogenic assays of PAEC 2-3 is depicted in a broken line for a reference. (c) Plates were reexamined on day 28. Over this extended time course, both second-generation PAEC 2 clones reconstituted a hierarchy of small- to large-sized colonies. PAEC 2-3-1 had a lower number of large-sized colonies than PAEC 2-3-2. *denotes significantly different (P < 0.05) compared to PAEC 2-3-1 vs. 2-3-2 in small-sized colonies. ns, not significant. # denotes significantly different (P < 0.05) compared to PAEC 2-3-1 vs. PAEC 2-3-2 in large-sized colonies. (d) Cells were seeded on Matrigel (30 µL per well) coated 96-well plates at densities of 8.0 × 104 cells depending on a cell type at a total cell solution volume of 80 µL. Cells were incubated at 37 ℃ with 5% CO2-room air for 24 h and then observed and pictures taken. Images are at 10 × magnification. Both PAEC 2-3-1 and 2-3-2 formed thin networks with large luminal areas similar to those of PAEC 2 and 2-3. (e–h) The principal bioenergetic pathways utilized by PAEC 2-3-1 and 2-3-2 were determined by mitochondrial (e–g) and glycolysis (h) stress tests using the Seahorse extracellular flux analyzer. OCR and ECAR at baseline and with different mitochondrial (oligomycin, FCCP, and rotenone) and glycolytic (glucose, oligomycin, and 2-DG) stressors are shown over time. PAEC 2-3-1 showed decreased aerobic glycolysis and increased oxidative phosphorylation when compared to PAEC 2-3-2. OCR and ECAR patterns of 2-3-2 closely mimicked those of PAEC 2-3. Data represent mean ± standard error. Two-way ANOVA and Bonferroni post hoc test were used to compare between cell types. Results from three independent experiments, each with five replicates, a total of 15 wells per group are shown. *denotes significantly different (P < 0.05) in PAEC 2-3-1 vs. PAEC 2-3-2 (n = 3 per group). Mean values of OCR and ECAR of PAEC 2-3 from Fig. 4d and f are depicted in broken lines for references. For the purposes of clarity standard deviation has been removed. (f) Basal OCR, ATP-linked respiration (average basal OCR – oligomycin response), maximal respiration (FCCP response), and spare capacity (maximal OCR – average basal OCR) are noted. (g) ECAR at baseline of mitochondrial stress test at three different time points are depicted. Each dot represents the value of individual well at each time point. Student's t-test was used. *denotes significant difference (P < 0.05) between PAEC 2-3-1 vs. 2-3-2.
Fig. 6.
Fig. 6.
Second-generation single cell clones arise from one cell phenotype. Cells within the parental population may originate from different areas within the pulmonary artery (e.g. A, B and/or C areas). By single cell cloning, first-generation clones are generated, which separate potentially heterogeneous cells from one another. Repeated single cell cloning generates second-generation clones; these clones arise from one cell phenotype. Tan shaded regions of “B” cells represent clones isolated from the first and second cloning strategies, respectively.

References

    1. Aird WC. Endothelial cell heterogeneity. Cold Spring Harb Perspect Med 2012; 2: a006429. - PMC - PubMed
    1. Fuchs A, Weibel ER. Morphometrische untersuchung der verteilung einer spezifischen cytoplasmatischen organelle in endothelzellen der ratte. Zeitschrift für Zellforschung und Mikroskopische Anatomie 1966; 73: 1–9. - PubMed
    1. Steinsiepe KF, Weibel ER. Electron microscopic studies on specific organelles of endothelial cells in the frog (Rana temporaria). Zeitschrift für Zellforschung und Mikroskopische Anatomie 1970; 108: 105–126. - PubMed
    1. Weibel ER. Fifty years of Weibel-Palade bodies: the discovery and early history of an enigmatic organelle of endothelial cells. J Thromb Haemost 2012; 10: 979–984. - PubMed
    1. Kelly JJ, Moore TM, Babal P, et al. Pulmonary microvascular and macrovascular endothelial cells: differential regulation of Ca2 + and permeability. Am J Physiol 1998; 274: L810–L819. - PubMed

LinkOut - more resources