. 2018;14(1):152-168.
doi: 10.1080/15548627.2017.1339001. Epub 2017 Sep 1.

ESRRA (estrogen-related receptor α) is a key coordinator of transcriptional and post-translational activation of autophagy to promote innate host defense

Affiliations

ESRRA (estrogen-related receptor α) is a key coordinator of transcriptional and post-translational activation of autophagy to promote innate host defense

Soo Yeon Kim et al. Autophagy. 2018.

Abstract

The orphan nuclear receptor ESRRA (estrogen-related receptor α) is a key regulator of energy homeostasis and mitochondrial function. Macroautophagy/autophagy, an intracellular degradation process, is a critical innate effector against intracellular microbes. Here, we demonstrate that ESRRA is required for the activation of autophagy to promote innate antimicrobial defense against mycobacterial infection. AMP-activated protein kinase pathway and SIRT1 (sirtuin 1) activation led to induction of ESRRA, which is essential for autophagosome formation, in bone marrow-derived macrophages. ESRRA enhanced the transcriptional activation of numerous autophagy-related (Atg) genes containing ERR response elements in their promoter regions. Furthermore, ESRRA, operating in a feed-forward loop with SIRT1, was required for autophagy activation through deacetylation of ATG5, BECN1, and ATG7. Importantly, ESRRA deficiency resulted in a decrease of phagosomal maturation and antimicrobial responses against mycobacterial infection. Thus, we identify ESRRA as a critical activator of autophagy via both transcriptional and post-translational control to promote antimicrobial host responses.

Keywords: Mycobacterium tuberculosis; autophagy-related genes; estrogen-related receptor α; innate antimicrobial defense; post-translational modifications; sirtuin 1.


Figures
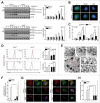
Figure 1.
Figure 1.
ESRRA is required for autophagy activation in macrophages in response to various autophagy inducers. Esrra+/+ and esrra−/− BMDMs were stimulated with AICAR (0.5 mM) or resveratrol (10 µM) for the indicated times. (A) BMDMs were harvested and subjected to immunoblot analysis of LC3A/B, ESRRA, and ACTB. The densitometry values for LC3-II were normalized to ACTB in each right panel. (B, D and E) Esrra+/+ and esrra−/− BMDMs were stimulated with AICAR (B to E) or resveratrol (B to D) for 24 h. (B) Immunofluorescence microscopy analysis of LC3A/B puncta formation. Merged signals of LC3A/B (Alexa Fluor 488-conjugated goat anti-rabbit IgG, green) and DAPI (nuclei, blue). Scale bar: 10 μm. (C) Quantification of LC3A/B punctate foci per cell. (D) Quantitative LC3B analysis by flow cytometry. (E) Representative transmission electron microscopy images. Scale bar: 1 and 0.2 μm. (F) Quantification of 200 cells with autophagic vacuoles per experimental condition by transmission electron microscopy. (G and H) Esrra+/+ and esrra−/− BMDMs were transduced with retroviruses expressing a tandem LC3B plasmid (mCherry-EGFP-LC3B) for 24 h and stimulated with AICAR or resveratrol for 24 h. (G) Representative immunofluorescence images. Scale bar: 10 µm. (H) Quantification of the number of red puncta per cell. Experiments were repeated at least 3 times. (B and G) Immunofluorescence microscopy images are from one representative of 7 independent samples, with each experiment including at least 200 cells scored in 7 random fields. Graphs show mean ± SD. **P < 0.01 (two-tailed unpaired Mann–Whitney). U, untreated; A, AICAR; R or RSV, resveratrol.
Figure 2.
Figure 2.
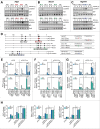
ESRRA is required for the transcriptional activation of autophagy-related genes in macrophages in response to various autophagy inducers. (A) Heatmap analysis from gene array data of Esrra+/+ and esrra−/− BMDMs. Differential gene expression patterns were observed in 39 autophagy-related genes between Esrra+/+ and esrra−/− BMDMs before and after LPS (100 ng/ml, for 6 h) stimulation (gene accession number: GSE58515). The genes investigated in this study are indicated by red color. (B) Esrra+/+ and esrra−/− BMDMs were stimulated with AICAR (0.5 mM) or resveratrol (10 µM) for 6 h. (C) BMDMs were transduced with lentiviruses expressing nonspecific shRNA (shNS) or shRNA specific for Esrra (shEsrra), and then stimulated with AICAR or resveratrol for 6 h. (D and E) BMDMs were incubated with or without XCT790 (1, 5, and 10 µM) for 48 h and followed by AICAR or resveratrol for 24 h (D) and 6 h (E). (B and C) Quantitative PCR analysis of the mRNA levels of 16 essential autophagy genes for which 15 contain > 3 ESRRA binding sites and ATG7 contains 1 motif (B) or Atg5, Becn1, Maplc13b, Atg16l1 and Ambra1 mRNA expression (C). (D) Cell lysates were subjected to immunoblot analysis using antibodies against ESRRA and ACTB. (E) Quantitative PCR analysis of Atg5, Becn1, and Map1lc3b mRNA expression. Experiments were repeated at least 3 times. Graphs show mean ± SD. *P < 0.05 and **P < 0.01 (2-tailed unpaired Mann–Whitney). U, untreated; SC, solvent control; RSV, resveratrol.
Figure 3.
Figure 3.
ESRRA upregulates the transcriptional activation of Atg5, Becn1, and Atg16l1, through direct binding to their promoter regions. (A to C) ESRRA ChIP analyses of the 4 proximal ERREs within Atg5 and Becn1, the 3 proximal ERREs within Atg16l1 and a distal region of the Atg5, Becn1, and Atg16l1 promoters. BMDMs were stimulated with AICAR (0.5 mM) or resveratrol (10 µM) for 6 h and subjected to chromatin immunoprecipitation assays using Abs specific for ESRRA, and semi-quantitative-PCR analysis using primers specific for the different Atg5, Becn1, and Atg16l1 ERREs. (D) Schematic diagram of Esrra consensus motifs in the Atg5, Becn1, and Atg16l1 promoters (left), and the wild-type (WT) and mutant construct sequences (right). (E to G) RAW264.7 cells were transfected with Atg5, Becn1, and Atg16l1-luciferase reporter constructs (ATG5–3 or ATG5–4 mutant; BECN1–1 or BECN1–4 mutant; ATG16L1–3 mutant carrying point mutations in the critical ESRRA-binding site) in the presence or absence of plasmid encoding FLAG-tagged murine ESRRA (pcDNA-Esrra). (H) RAW264.7 cells were transfected with Atg5-, Becn1- or Atg16l1-luciferase reporter constructs in the presence or absence of pcDNA-Esrra and a plasmid encoding FLAG-tagged human PPARGC1A (pcDNA-PPARGC1A). (E to H) Cells were stimulated with AICAR or resveratrol for 6 h and subjected to luciferase activity. Experiments were repeated at least 3 times. Graphs show mean ± SD. *P < 0.05, **P < 0.01 and ***P < 0.001 (2-tailed unpaired Welch t test). A5–1, A5–2, A5–3, and A5–4, for Atg5 promoter regions −3092/−2842, −2646/−2436, −1143/−931, and −1018/−841, respectively; B1–1, B1–2, B1–3 and B1–4, for Becn1 promoter regions −1239/−1060, −1131/−911, −819/−609, and −362/−173, respectively; A16L1-1, A16L1-2, and A16L1-3, for Atg16l1 promoter regions −4493/−4224, −3447/−3233 and −3372/−3222, respectively; NC, negative control; SC, solvent control; RSV, resveratrol.
Figure 4.
Figure 4.
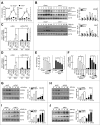
Mutual induction of ESRRA and SIRT1 expression in macrophages. (A and B) Esrra+/+ and esrra−/− BMDMs were stimulated with AICAR (0.5 mM) or resveratrol (10 µM) for the indicated times. (A) Quantitative PCR analysis of Sirt1 mRNA expression. (B) Immunoblot analysis of SIRT1 and ACTB. (C and D) RAW264.7 cells were transfected with a Sirt1-luciferase reporter construct (Sirt1 mut1, SIRT1 carrying point mutations in the ESRRA binding site) in the presence or absence of plasmid encoding FLAG-tagged murine ESRRA (pcDNA-Esrra). Cells were stimulated with AICAR (C) or resveratrol (D) for 6 h and subjected to luciferase activity. (E) BMDMs were incubated with or without XCT790 (1, 5, and 10 µM) for 48 h and followed by AICAR or resveratrol for 6 h. (F) RAW264.7 cells were transfected with pGL3 basic vector or Sirt1-luciferase reporter construct. Cells were incubated with or without XCT790 (1, 5, and 10 µM) for 48 h and followed by AICAR or resveratrol for 6 h. (G and H) BMDMs were transduced with lentiviruses expressing nonspecific shRNA (shNS) or shRNA specific for Sirt1 (shSirt1), followed by AICAR or resveratrol for 4 or 24 h. (I and J) The mock vector or SIRT1-expressed RAW264.7 cells followed by AICAR or resveratrol for 4 or 24 h. Cell lysates were subjected to immunoblot analysis using antibodies against ESRRA, SIRT1, and ACTB. (B and G to J) The densitometry values for SIRT1 or ESRRA were normalized to ACTB in each right panel. Experiments were repeated at least 3 times. Graphs show mean ± SD. *P < 0.01, **P < 0.01, and ***P < 0.001 (2-tailed unpaired Mann–Whitney, A, B, and E to J; 2-tailed unpaired t test, C and D). U, untreated; SC, solvent control; RSV, resveratrol.
Figure 5.
Figure 5.
ESRRA-mediated SIRT1 induction contributes to deacetylation of ATG5, BECN1, and ATG7 in macrophages. (A and B) HEK293T cells were transfected with mock vector (vector) or Esrra-Flag plasmid and stimulated with AICAR (0.5 mM; A) or resveratrol (10 µM; B) for 8 or 24 h. (C) BMDMs were transduced with lentiviruses expressing shRNA (shNS) or shRNA specific for Esrra (shEsrra) and the cells were stimulated with AICAR for 8 or 24 h. (D and E) HEK293T cells transfected with mock vector (vector) or a FLAG-tagged BECN1-encoding plasmid (BECN1; D), and RAW264.7 cells transfected with mock vector (vector) or a HA-tagged SIRT1-encoding plasmid (SIRT1; E) were treated with AICAR or resveratrol for 8 or 24 h. (A to E) Cells were immunoprecipitated using Ac-Lys, FLAG, or SIRT1 antibody, followed by immunoblotting with indicated proteins. Protein levels in nonprecipitated cell lysates were determined by immunoblot analysis. Experiments were repeated at least 3 times. RSV, resveratrol.
Figure 6.
Figure 6.
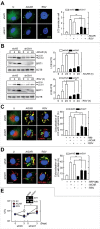
SIRT1 deficiency affects autophagy induction and Mtb phagosomal maturation in macrophages in response to AICAR and resveratrol. (A and B) BMDMs were transduced with lentiviruses expressing nonspecific shRNA (shNS) or shRNA specific for Sirt1 (shSirt1). Cells were stimulated with AICAR (0.5 mM) or resveratrol (10 µM) for 24 h. (A) Immunofluorescence microscopy analysis of LC3A/B puncta formation (left). Quantification of LC3A/B punctate foci per cell (right). Scale bar: 10 µm. (B) Cell lysates were subjected to immunoblot analysis using antibodies against LC3A/B, SIRT1, and ACTB. The densitometry values for LC3-II were normalized to ACTB in each right panel. (C and D) BMDMs were transduced with shSirt1 and infected with Mtb-ERFP (MOI = 10, for 4 h), and then stimulated with AICAR or resveratrol for 24 h. (C) Cells were immunostained using antibodies for LC3A/B (Alexa Fluor 488-conjugated goat anti-rabbit IgG, green), LAMP1 (Alexa Fluor 594-conjugated goat anti-rat IgG, red) and DAPI to visualize nuclei. Quantitative analysis of cells showing LC3A/B and LAMP1 colocalization (right). Scale bar: 10 µm. (D) Cells were immunostained using an anti-LC3A/B antibody (Alexa Fluor 488-conjugated goat anti-rabbit IgG, green) and DAPI to visualize nuclei (blue). Quantification of LC3A/B and Mtb-ERFP colocalization per cell with 200 internalized mycobacteria (right). Scale bar: 10 µm. (E) BMDMs were transduced with shRNA specific for Sirt1 (shSirt1) and infected Mtb (MOI = 10, for 4 h), and then stimulated with AICAR or resveratrol for 3 d after which the cells were lysed to determine intracellular bacterial loads. (E, inset) RT-PCR analysis of transduction efficiency. Experiments were repeated at least 3 times. Immunofluorescence microscopy images are from one representative of 7 independent samples, with each experiment including at least 200 cells scored in 7 random fields (A, C, and D). Experiments were repeated at least 3 times. Graphs show mean ± SD. **P < 0.01 (2-tailed unpaired Mann–Whitney). U, untreated; RSV, resveratrol.
Figure 7.
Figure 7.
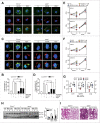
ESRRA is critical for the AMPK- or SIRT1-mediated enhancement of Mtb phagosomal maturation and antimicrobial responses in macrophages. (A to D) Esrra+/+ and esrra−/− BMDMs were infected with Mtb-ERFP (MOI = 10, for 4 h), and then stimulated with AICAR (0.5 mM) or resveratrol (10 µM) for 24 h. (A) Immunofluorescence microscopy analysis of LC3A/B colocalization formation. Scale bar: 10 µm. (B) Quantitation of LC3A/B colocalization per cell with 200 internalized mycobacteria. (C) Cells were immunostained using antibodies for LAMP2 (Alexa Fluor 488-conjugated goat anti-rabbit IgG, green) and DAPI to visualize nuclei. Scale bar: 10 µm. (D) Quantitative analysis of cells showing LAMP2 and Mtb-ERFP colocalization per cell with 200 internalized mycobacteria colocalization. (E and F) Esrra+/+ and esrra−/− BMDMs were infected with Mtb (MOI = 1 or 10) for 4 h, stimulated with AICAR (0.1, 0.5, and 1 mM) or resveratrol (0.1, 1, or 10 μM) for 3 d after which the cells were lysed to determine intracellular bacterial loads. (G) Esrra+/+ and esrra−/− mice were infected with Mtb (1 × 10⁶ CFU/mouse, i.v.) for 3 wk and then treated with AICAR (500 mg/kg, i.p.) or vehicle (PBS, i.p.) for 7 consecutive d. Mice were killed 4 wk after mycobacterium infection and bacterial loads in organs of infected mice (n = 4 to 5 per group) were determined by CFU assay. Data are from a representative of 2 independent experiments. (H and I) Three wk after Mtb infection in vivo, Esrra+/+ and esrra−/− mice were treated with resveratrol (20 mg/kg, i.p.) or vehicle (5% EtOH, i.p.) for 7 consecutive d. (H) Lung lysates were harvested and subjected to immunoblot analysis. Data are from a representative of 2 independent experiments. The densitometry values for LC3-II were normalized to ACTB in the right panel. (I) H&E staining in lung tissue (n = 3). Scale bar: 100 μm. Experiments were repeated at least 3 times. Immunofluorescence microscopy images are from one representative of 7 independent samples, with each experiment including at least 200 cells scored in 7 random fields (A and C). Graphs show mean ± SD. *P < 0.05 and **P < 0.01 (2-tailed unpaired Mann–Whitney). ns, not significant; U, untreated; SC, solvent control; Vehi, vehicle control; RSV, resveratrol.

References

    1. Evans RM, Mangelsdorf DJ. Nuclear receptors, RXR, and the Big Bang. Cell 2014; 157:255-66; PMID:24679540; https://doi.org/10.1016/j.cell.2014.03.012 - DOI - PMC - PubMed
    1. Giguère V, Yang N, Segui P, Evans RM. Identification of a new class of steroid hormone receptors. Nature 1988; 331:91-4; PMID:3267207; https://doi.org/10.1038/331091a0 - DOI - PubMed
    1. Deblois G, Giguère V. Functional and physiological genomics of estrogen-related receptors (ERRs) in health and disease. Biochim Biophys Acta 2011; 1812:1032-40; PMID:21172432; https://doi.org/10.1016/j.bbadis.2010.12.009 - DOI - PubMed
    1. Villena JA, Kralli A. ERRalpha: a metabolic function for the oldest orphan. Trends Endocrinol Metab 2008; 19:269-76; PMID:18778951; https://doi.org/10.1016/j.tem.2008.07.005 - DOI - PMC - PubMed
    1. Sonoda J, Laganière J, Mehl IR, Barish GD, Chong LW, Li X, Scheffler IE, Mock DC, Bataille AR, Robert F, et al.. Nuclear receptor ERR alpha and coactivator PGC-1 beta are effectors of IFN-gamma-induced host defense. Genes Dev 2007; 21:1909-20; PMID:17671090; https://doi.org/10.1101/gad.1553007 - DOI - PMC - PubMed

Publication types

Grants and funding