. 2017 Aug 24;170(5):1028-1043.e19.
doi: 10.1016/j.cell.2017.08.003.

In Situ Capture of Chromatin Interactions by Biotinylated dCas9

Affiliations

In Situ Capture of Chromatin Interactions by Biotinylated dCas9

Xin Liu et al. Cell. .

Abstract

Cis-regulatory elements (CREs) are commonly recognized by correlative chromatin features, yet the molecular composition of the vast majority of CREs in chromatin remains unknown. Here, we describe a CRISPR affinity purification in situ of regulatory elements (CAPTURE) approach to unbiasedly identify locus-specific chromatin-regulating protein complexes and long-range DNA interactions. Using an in vivo biotinylated nuclease-deficient Cas9 protein and sequence-specific guide RNAs, we show high-resolution and selective isolation of chromatin interactions at a single-copy genomic locus. Purification of human telomeres using CAPTURE identifies known and new telomeric factors. In situ capture of individual constituents of the enhancer cluster controlling human β-globin genes establishes evidence for composition-based hierarchical organization. Furthermore, unbiased analysis of chromatin interactions at disease-associated cis-elements and developmentally regulated super-enhancers reveals spatial features that causally control gene transcription. Thus, comprehensive and unbiased analysis of locus-specific regulatory composition provides mechanistic insight into genome structure and function in development and disease.

Keywords: CRISPR/Cas9; DNA looping; biotinylation; chromatin; cis-regulatory elements; enhancers; proteomics; super-enhancers.


Figures

Figure 1.
Figure 1.. In Situ Capture of Locus-Specific Chromatin Interactions by Biotinylated dCas9
(A) Schematic of dCas9-mediated capture of chromatin interactions. (B) The three components of the CAPTURE system: a FB-dCas9, a biotin ligase BirA, and target-specific sgRNAs. (C) Schematic of dCas9-mediated capture of human telomeres. (D) Labeling of human telomeres in MCF7 cells. Scale bar, 5 μm. (E) qPCR analysis shows significant enrichment of telomere DNA. Results are mean ± SEM of three experiments and analyzed by two-tailed t-test. **P < 0.01. (F) Western blot shows enrichment of TERF2 in sgTelomere-expressing but not control K562 cells with dCas9 alone (no sgRNA) or the non-targeting sgGal4. (G) iTRAQ-based proteomics analysis of telomere-associated proteins. Representative proteins and the mean iTRAQ ratios are shown. See also Table S3.
Figure 2.
Figure 2.. Biotinylated dCas9-Mediated Capture of the β-Globin Cluster
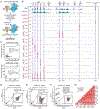
(A) Schematic of CAPTURE-ChIP-seq. (B) Density maps are shown for CAPTURE-ChIP-seq at the β-globin cluster (chr11:5,222,500-5,323,700; hg19) in K562 cells, together with DHS and H3K27ac ChIP-seq profiles. Two independent sgRNAs (sg1 and sg2) or replicate experiments (rep1 and rep2) are shown. Cells expressing dCas9 only (no sgRNA) or dCas9 with sgGal4 were analyzed as controls. (C) Genome-wide analysis of dCas9 binding in cells expressing two sgRNAs (sg1 and sg2) for HS2 or HBG. Data points for the sgRNA target regions and the predicted off-targets are shown as green, red and orange, respectively. The x- and y-axis denote the mean normalized read counts from N = 2 to 5 CAPTURE-ChIP-seq experiments. (D-F) Genome-wide differential analysis of dCas9 binding in cells expressing sgHS2, sgHBG, or sgHS1-5 versus sgGal4. Data points for the sgRNA target regions and the predicted off-targets are shown as green and red, respectively. N = 5, 4, 6 and 4 CAPTURE-ChIP-seq experiments for sgHS2, sgHBG, sgHS1-5 and sgGal4, respectively. (G) RNA-seq analysis was performed in cells expressing dCas9 with sgHS2, sgHBG, sgHS1-5, sgGal4 or WT K562 cells. The Pearson correlation coefficient (R) value is shown. See also Figure S1, Tables S1 and S2.
Figure 3.
Figure 3.. CAPTURE-Proteomics Identify β-Globin CRE-Associated Protein Complexes
(A) Schematic of CAPTURE-Proteomics. (B) Western blot analysis of captured proteins in sgHS1-5 or sgGal4-expressing K562 cells. (C) Schematic of the β-globin cluster and sgRNAs used for CAPTURE-Proteomics. (D) CAPTURE-Proteomics identified β-globin CRE-associated proteins. Volcano plots are shown for the iTRAQ proteomics of purifications in sgHS2, sgHBG or sgHBB versus sgGal4-expressing cells. Relative protein levels in target-specific sgRNAs versus sgGal4 are plotted on the x-axis as mean log2 iTRAQ ratios across N replicate experiments. Negative log10 transformed P values are plotted on the y-axis. Significantly enriched proteins (P ≤0.05; iTRAQ ratio ≥1.5) are denoted by black dots, all others by grey dots. Dotted lines indicate 1.5-fold ratio (x-axis) and P value of 0.05 (y-axis). Representative chromatin-regulating proteins are denoted by red arrowheads. Representative proteins with iTRAQ ratio ≥1.5 and P >0.05 are denoted by blue arrowheads. (E) Connectivity network of CAPTURE-Proteomics-identified proteins converged by β-globin CREs. The connectivity was built using interactions (grey lines) between proteins and CREs. Colored nodes denote proteins enriched at single or multiple CREs. Size of the circles denotes the frequency of interactions. Inset tables show the lists of representative proteins associated with the β-globin promoters (red), enhancers (blue) or both (green). See also Figures S2, S3 and Table S4.
Figure 4.
Figure 4.. CAPTURE-Proteomics Identify Known and New Regulators of β-Globin Genes and Erythroid Enhancers
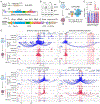
(A) ChIP-seq analysis of the identified regulators in K562 cells. (B) RNAi screen of the identified regulators in human primary erythroid cells. Data are plotted as log2(fold change) of the β-globin mRNA in each shRNA experiment relative to the non-targeting shNT control. Genes are ranked based on the changes in HBE1, HBG or HBB expression. shRNAs against BCL11A and KLF1 were analyzed as controls. Results are mean ± SEM of all shRNAs for each gene from four experiments. (C) Genome-wide distribution of NUP98 and NUP153 ChIP-seq peaks in promoters (−2kb to 1kb of TSS), exons, intragenic and intergenic regions. (D) NUP98 and NUP153 associate with erythroid SEs. SEs were identified by ROSE (Whyte et al., 2013) using the H3K27ac ChIP-seq signal. (E) Representative SE loci co-occupied by NUP98 and NUP153. DHS, ChIP-seq, and chromatin state (ChromHMM) data are shown. Red bars denote the annotated SEs. (F) NUP98 and NUP153-associated genes show significantly higher mRNA expression. Boxes show median of the data and quartiles, and whiskers extend to 1.5x of the interquartile range. P values were calculated by a two-side t-test. (G) Enriched gene ontology (GO) terms associated with NUP98 or NUP153 occupied regions. (H) Motif analysis of NUP98 or NUP153 binding sites.
Figure 5.
Figure 5.. CAPTURE-3C-seq Identifies Locus-Specific Long-Range DNA Interactions
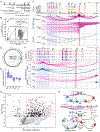
(A) Schematic of CAPTURE-3C-seq. (B) Browser view of the long-range interactions at HS3 (chr11:5,222,500-5,323,700; hg19) is shown. Contact profiles including the density map, interactions (or loops) and PETs are shown. The statistical significance of interactions was determined by the Bayes factor (BF) and indicated by the color scale bars. ChIA-PET, DHS, ChIP-seq, RNA-seq, and ChromHMM data are shown. (C) Circlet plots of the long-range interactions are shown. The numbers of identified inter- (blue lines) and intra-chromosomal (purple lines) interactions are shown. (D) Browser view of the long-range interactions at the active HBG (green shaded lines) and the repressed HBB promoters (red shaded lines) is shown. (E) The fraction of identified interactions relative to the total PETs at each captured region is shown. Results are mean ± SEM of two or three experiments and analyzed by a two-sided t-test. *P < 0.05; ***P < 0.001. (F) KO of de novo CREs impaired the expression of β-globin genes. The log2(fold change) of the mRNA expression in KO versus WT cells are shown. Each circle denotes an independent single-cell-derived KO clone. A diagram depicting the upstream (UpE1, UpE2 and UpE3) and downstream (DnE1, DnE2 and DnE3) CREs is shown on the top. Results are mean ± SEM of independent clones and analyzed by a two-sided t-test. *P < 0.05, **P < 0.01, ***P < 0.001. See also Figures S4, S5, S6, and Table S5.
Figure 6.
Figure 6.. Biotinylated dCas9-Mediated In Situ Capture of A Disease-Associated CRE
(A) Schematic of the 3.5kb intergenic element (chr11:5,255,859-5,259,368; hg19) along with the deletions mapped in prior studies. (B) Genome-wide specificity of sgHBD-1kb was measured by CAPTURE-ChIP-seq. N = 2 and 4 experiments for sgHBD-1kb and sgGal4. (C) Browser view of the long-range interactions at HBD-1kb (red shaded lines) is shown. (D) Circlet plot of the long-range interactions at HBD-1kb is shown. (E) HBD-1kb KO impaired the expression of β-globin genes. Results are mean ± SEM of independent KO clones and analyzed by a two-sided t-test. *P < 0.05, **P < 0.01. (F) HBD-1kb KO led to altered chromatin accessibility and long-range interactions. Results from three ATAC-seq experiments in WT or KO cells are shown. Regions showing increased or decreased ATAC-seq signals in KO relative to WT cells (KO-WT) are depicted in green and red, respectively. HS3 or 3’HS1-mediated long-range interactions were determined by CAPTURE-3C-seq. (G) CAPTURE-Proteomics identified HBD-1kb-associated proteins. Volcano plot is shown for the iTRAQ proteomics of purifications in sgHBD-1kb versus sgGal4-expressing cells. (H) The model of composition-based organization of the β-globin cluster. Top: a previously described model depicting an active chromatin hub (ACH) formed through spatial organization of β-globin CREs (Palstra et al., 2003; Tolhuis et al., 2002). Middle: two-dimensional representation of the long-range DNA interactions (purple lines) identified at HS3 and the HBG1-HBD intergenic CREs (yellow square) by CAPTURE. Bottom: a refined model depicting the composition-based spatial and hierarchical organization of the β-globin CREs. See also Figure S7, Tables S4 and S5.
Figure 7.
Figure 7.. Multiplexed CAPTURE of Developmentally Regulated SEs during Differentiation
(A) Schematic of site-specific knock-in of tetracycline-inducible FB-dCas9-EGFP and BirA. (B) Dox-inducible expression of dCas9 and BirA proteins was confirmed by Western blot in two independent knock-in ESC lines. (C) Schematic of multiplexed CAPTURE of ESC-specific SEs in ESCs and EBs. (D) Differentiated EBs were characterized by downregulation of ESC-associated genes (Oct4, Sox2, Esrrb and Utf1) and upregulation of differentiation-associated genes (Vim, Gata4 and Gata6). Results are mean ± SEM of 3 or 4 experiments and analyzed by a two-sided t-test. **P < 0.01, ***P < 0.001. (E) Browser view of SE-associated long-range interactions captured by CAPTURE-3C-seq in ESCs and EBs. Regions showing increased or decreased ATAC-seq or H3K27ac ChIP-seq signals in EBs relative to ESCs (EB-ESC) are depicted in red and blue, respectively. Red bars denote the annotated SEs. Dashed lines denote the alternative TSS of transcript variants for Oct4 (Pou5f1) and Esrrb.

Comment in

References

    1. Beard C, Hochedlinger K, Plath K, Wutz A, and Jaenisch R (2006). Efficient method to generate single-copy transgenic mice by site-specific integration in embryonic stem cells. Genesis (New York, NY : 2000) 44, 23–28. - PubMed
    1. Capelson M, Liang Y, Schulte R, Mair W, Wagner U, and Hetzer MW (2010). Chromatin-bound nuclear pore components regulate gene expression in higher eukaryotes. Cell 140, 372–383. - PMC - PubMed
    1. Chen B, Gilbert LA, Cimini BA, Schnitzbauer J, Zhang W, Li GW, Park J, Blackburn EH, Weissman JS, Qi LS, et al. (2013). Dynamic imaging of genomic loci in living human cells by an optimized CRISPR/Cas system. Cell 155, 1479–1491. - PMC - PubMed
    1. Cong L, Ran FA, Cox D, Lin S, Barretto R, Habib N, Hsu PD, Wu X, Jiang W, Marraffini LA, et al. (2013). Multiplex genome engineering using CRISPR/Cas systems. Science (New York, NY) 339, 819–823. - PMC - PubMed
    1. Consortium, T.E.P. (2012). An integrated encyclopedia of DNA elements in the human genome. Nature 489, 57–74. - PMC - PubMed