. 2017 Aug 24;170(5):913-926.e19.
doi: 10.1016/j.cell.2017.07.026.

Clonal Evolution of Autoreactive Germinal Centers

Affiliations

Clonal Evolution of Autoreactive Germinal Centers

Søren E Degn et al. Cell. .

Abstract

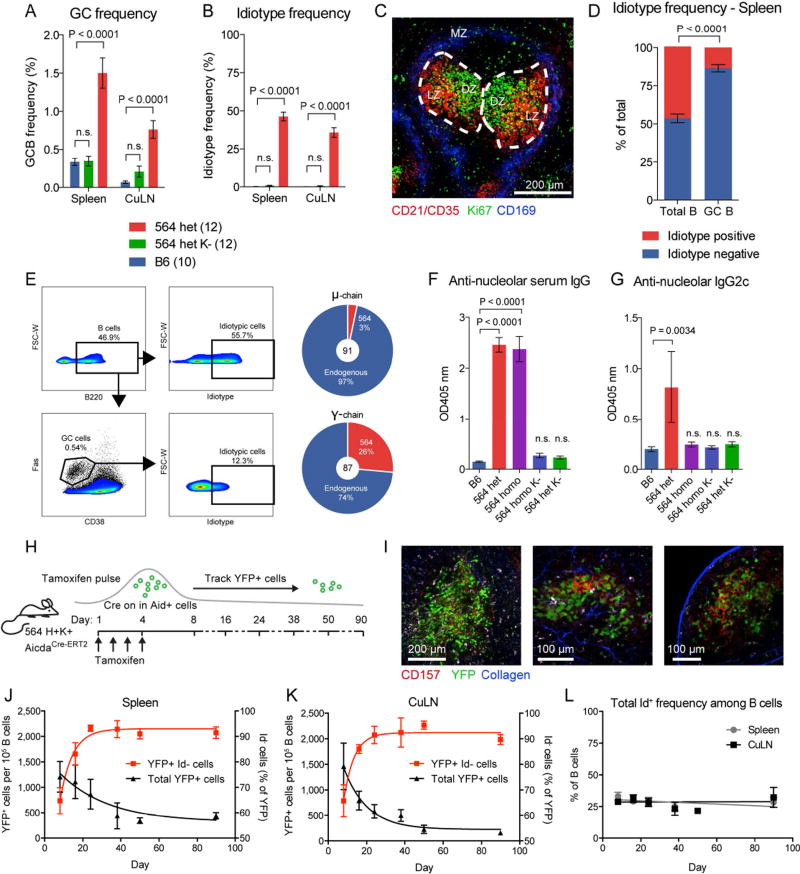
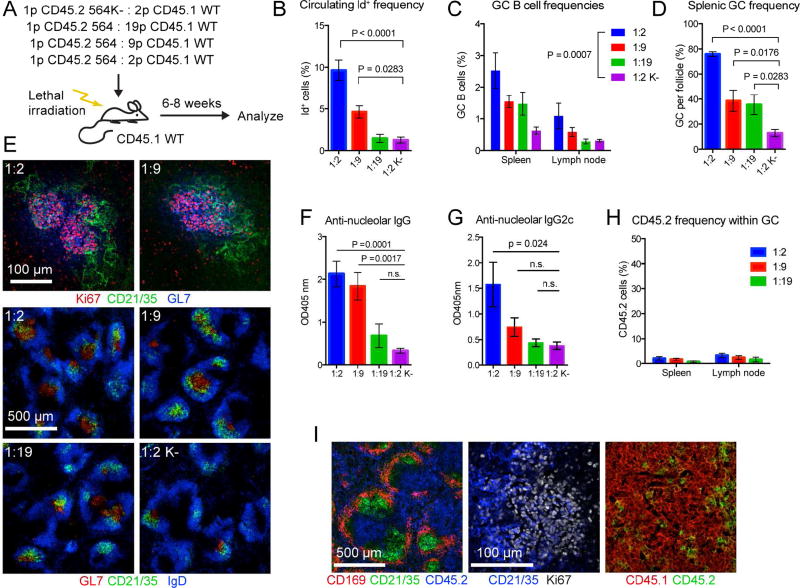
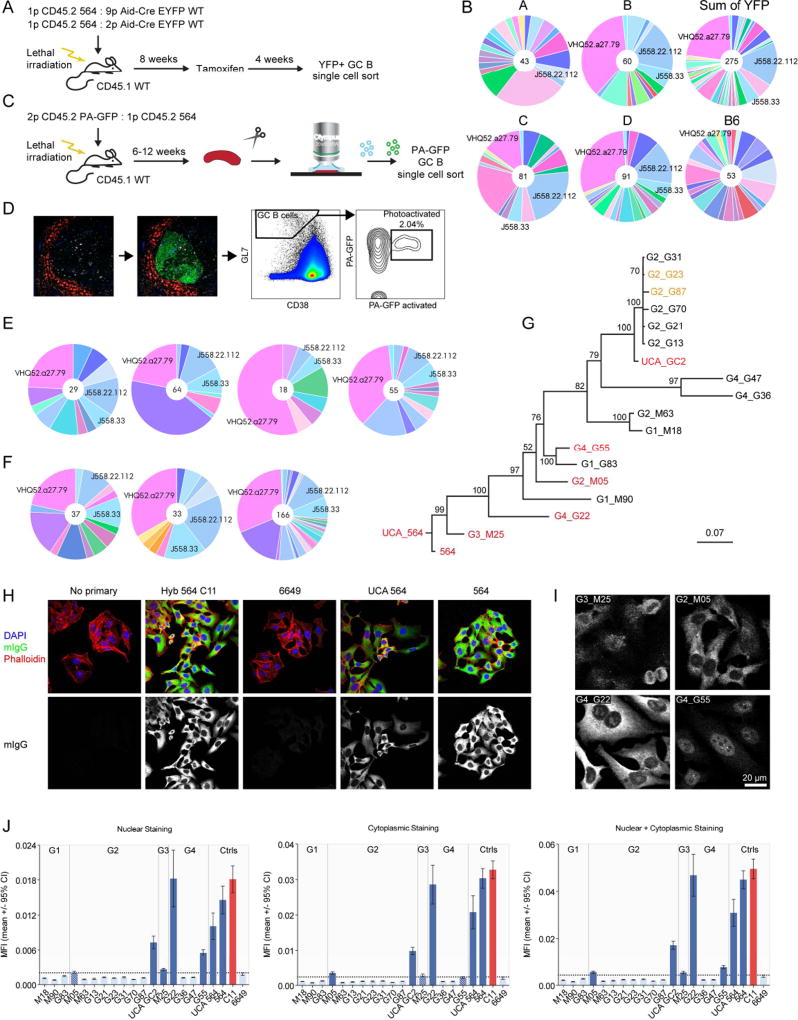
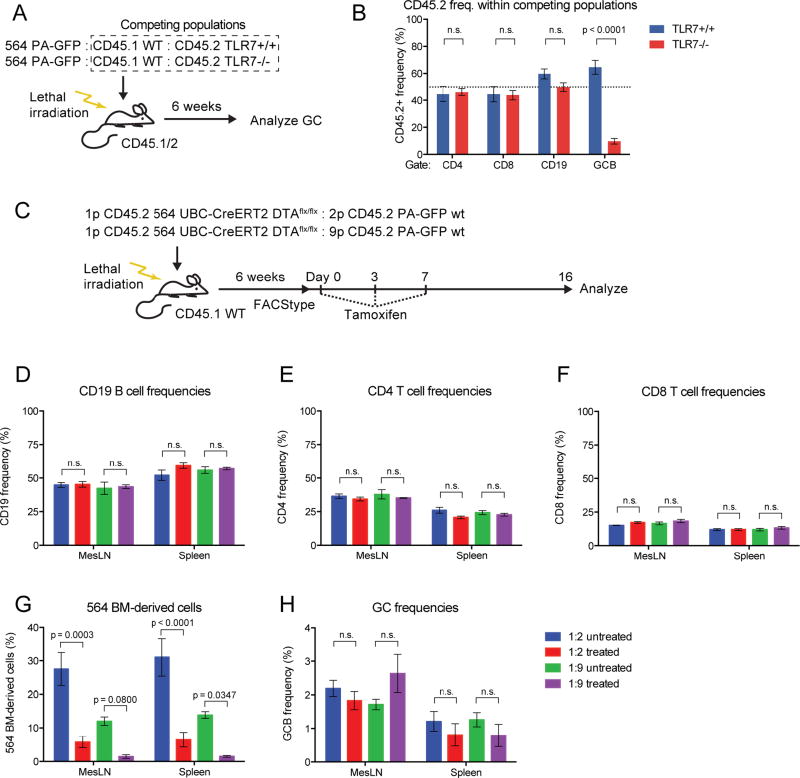
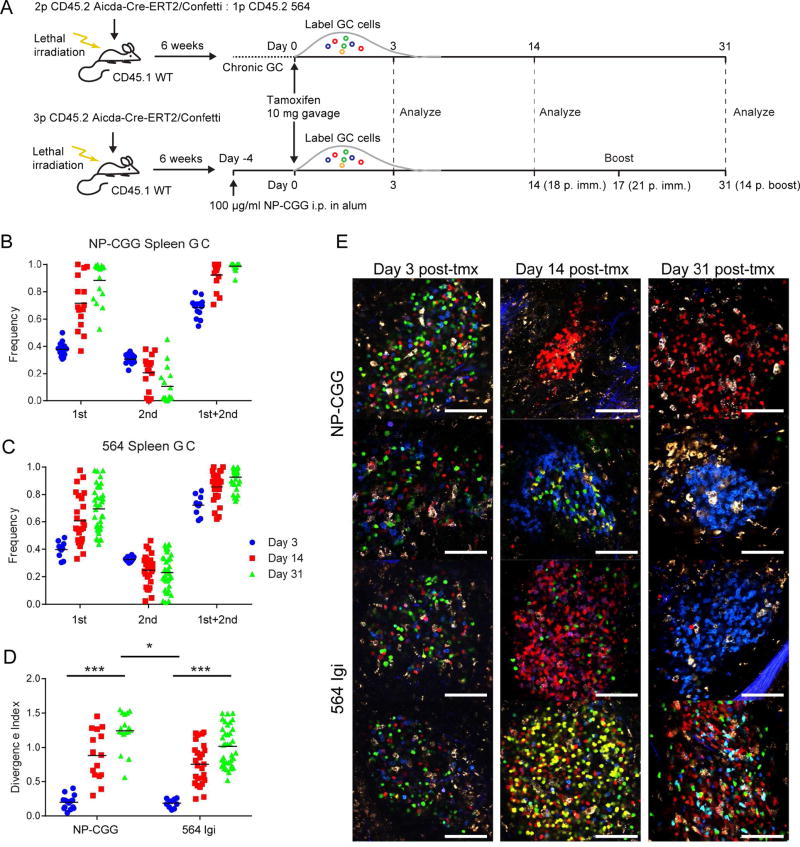
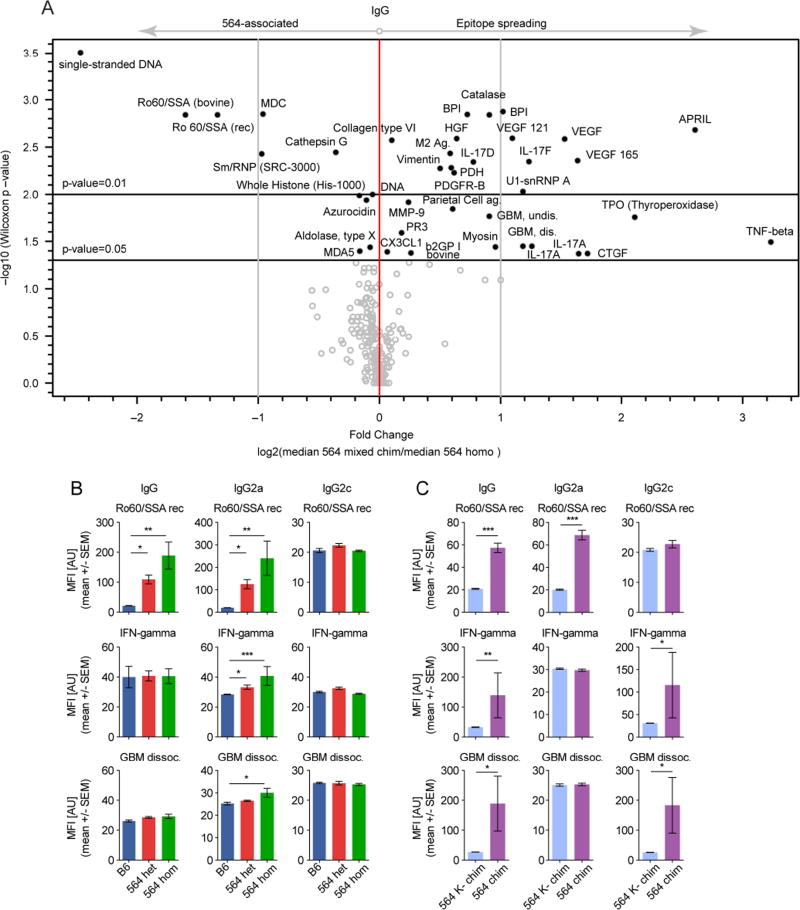
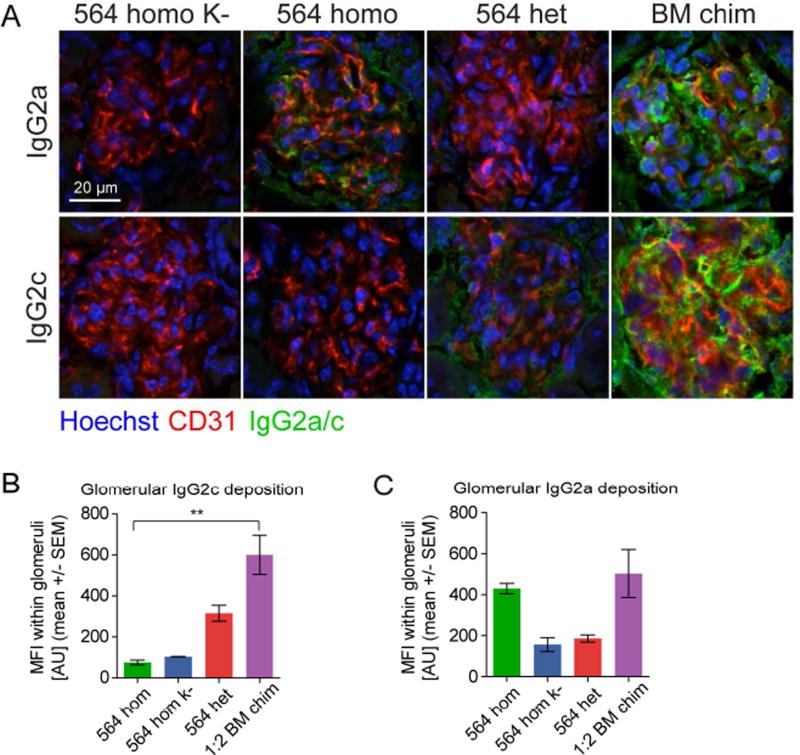
Germinal centers (GCs) are the primary sites of clonal B cell expansion and affinity maturation, directing the production of high-affinity antibodies. This response is a central driver of pathogenesis in autoimmune diseases, such as systemic lupus erythematosus (SLE), but the natural history of autoreactive GCs remains unclear. Here, we present a novel mouse model where the presence of a single autoreactive B cell clone drives the TLR7-dependent activation, expansion, and differentiation of other autoreactive B cells in spontaneous GCs. Once tolerance was broken for one self-antigen, autoreactive GCs generated B cells targeting other self-antigens. GCs became independent of the initial clone and evolved toward dominance of individual clonal lineages, indicating affinity maturation. This process produced serum autoantibodies to a breadth of self-antigens, leading to antibody deposition in the kidneys. Our data provide insight into the maturation of the self-reactive B cell response, contextualizing the epitope spreading observed in autoimmune disease.

Keywords: B-lymphocytes; autoantibodies; autoantigens; autoimmune diseases; autoimmunity; autoreactive B cells; epitope spreading; germinal center; self-tolerance; systemic lupus erythematosus.


Figures

Figure 1
Figure 1. Spontaneous, Chronic GCs in 564Igi Mice Display VDJ diversification, SHM, and CSR
(A) GC frequency within the B220+ gate of B6 (n=10), heterozygous 564Igi K− (n=12), and heterozygous 564Igi mice (n=12). Mean±SEM, multiplicity-adjusted P values for two-way ANOVA with Dunnett’s posttest. (B) Id frequency within the B220+ gate as in (A). (C) Representative confocal IF microscopy of a 10-µm splenic section from a heterozygous 564Igi mouse, displaying GC structures identified by staining for CD21/35 (dim on B cells, bright on FDC in the light zone [LZ], red) and centroblasts (dividing cells in the dark zone [DZ], Ki67 positive cells, green), and staining of the marginal zone (MZ, CD169+ metallophilic macrophages, blue) indicating the border of the red and white pulp. (D) Frequency of Id+ versus Id cells in the total versus GC B cell gate in spleen for the group of mice represented in (A) and (B). Mean±SEM, multiplicity-adjusted P-value for repeated-measures two-way ANOVA with Sidak’s posttest. (E) FACS plots showing frequency of Id+ cells within the total B220+ pool (top right panel) versus the GC population (bottom right panel) defined as Fas+CD38 B cells. Sequencing of the mu chain (top) and gamma chain (bottom) of FACS-sorted GC B cells of heterozygous 564Igi mice. (F) Anti-nucleolar serum IgG of B6 (n=4), heterozygous 564Igi (n=10), homozygous 564Igi (n=7), heterozygous 564Igi K− (n=8), and homozygous 564Igi K− mice (n=3), as measured by ELISA. Mean±SEM, multiplicity-adjusted P values for one-way ANOVA with Dunnett’s posttest. (G) Anti-nucleolar serum IgG2c, as in panel (F). (H) Overview of experimental approach. (I) Representative two-photon imaging of explanted spleen at low (left panel) and high (middle panel) magnification, and of explanted inguinal LN at high magnification (right panel), showing YFP+ cells (green), CD157+ FDC (red), and second harmonics generation (blue). (J) A pulsed GC population followed in the spleen over 90 days. Mean±SEM for 6 (Day 8, 16, 24), 2 (Day 38 and 50) and 3 (Day 90) mice from 3 independent cohorts. (K) Similar to (J), but for cutaneous LN. (L) Overall Id frequencies in spleen and LN over the course of the experiment. See also Figure S1, Movies S1 and S2.
Figure 2
Figure 2. An Autoreactive B Cell Clone is Sufficient to Induce Spontaneous GCs Composed Predominantly of WT-derived B Cells
(A) Overview of experimental approach for generating and analyzing 564 CD45.1 mixed chimeras. (B) Id frequencies in chimera blood. Mean±SEM for 1:2 (n=7), 1:9 (n=7), 1:19 (n=5), and 1:2K− (n=5) chimeras from 3 independent cohorts. Multiplicity-adjusted P value for one-way ANOVA using Holm-Sidak’s posttest. (C) GC B cell frequencies in spleen and cutaneous LN analyzed by flow cytometry. As for (B), but using two-way ANOVA with Holm-Sidak’s posttest. (D) Frequency of GC per follicle assessed by confocal IF microscopy. Two slices per mouse listed in (B). Mean±SEM, multiplicity-adjusted P value for one-way ANOVA using Holm-Sidak’s posttest. (E) Representative confocal IF microscopy of 10-µm spleen sections. Top: representative spleen sections showing T-dependent GC defined by GL7 (blue) and Ki67 (red) bounded by FDC networks (green); Bottom: representative spleen sections at lower magnification showing GL7+ GC (red) and FDC networks (green) within follicular areas containing IgD positive B cells (blue). (F) Serum anti-nucleolar IgG titers for a subset of mice in (B). Mean±SEM for 1:2 (n=6), 1:9 (n=4), 1:19 (n=5), and 1:2K (n=6) chimeras from 3 independent cohorts. Multiplicity-adjusted P value for one-way ANOVA using Holm-Sidak’s posttest. (G) Serum anti-nucleolar IgG2c titers, as in (F). (H) CD45.2 frequencies within GC of panel (C). (I) Left panel: confocal IF microscopy of spleen section showing distribution of 564 BM-derived cells (CD45.2, blue) in relation to the marginal zone (CD169, red) and FDC networks (CD21/35, green). Right two panels: distribution of CD45.2 (green) vs. CD45.1 (red) cell populations within the GC defined by FDC (light zone, CD21/35 in blue) and dividing centroblasts (dark zone, Ki67 in white). See also Figure S2.
Figure 3
Figure 3. WT GC Cells Converge on Stereotypic Autoreactive Sequence Elements
(A) Overview of experimental setup for single-cell sequence analysis of temporal global GC populations. (B) Single-cell sequence analysis of temporal global GC populations from 4 mice (two 1:9 [A+B] and two 1:2 chimeras [C+D]), the sum of all observed YFP-derived sequences (from A–D) and a control B6. A unique color is assigned to each unique V element, and colors are consistent across graphs in Figure 3 and Figure S3. (C) Schematic overview of experimental setup for single GC-level single GC B cell analysis. (D) Example of photoactivation and sort gates for single GC-level single GC B cell sorting. Leftmost panel: the marginal zone is labeled with anti-CD169-PE and based on tingible-body macrophage morphology; follicles containing GC are delineated for photoactivation. Second panel from left: GFP signal following photoactivation. Second panel from right: GC B cell gate defined as CD38lo, GL7hi. Rightmost panel: signal for photoactivated GFP vs. unactivated PA-GFP, and indication of terminal sort gate for photoactivated GC B cells. (E) Clonal composition of four splenic GC from the same mouse, as defined by heavy chain V-segments. (F) Sum of observed Vh-segments in four splenic GC each, for 3 independent mice. (G) Phylogenetic tree for the 17 synthesized PA-GFP clones, 564, and the 564 UCA, based on the nucleotide sequences of heavy+light chains. Clones identified as autoreactive in HEp-2 assay, nucleolar ELISA, and autoAg array are highlighted in red, whereas clones displaying limited autoreactivity in autoAg array only are in orange. The tree was resampled 100 times, and the resulting confidence of branchpoint determination is indicated. (H) Representative results for confocal analysis of human epithelial (HEp-2) cells stained with (from left to right): no primary; 564 Ab derived from a hybridoma (clone C11); cloned heavy and light chain pairs from control anti-influenza HA head Ab (6649); reconstructed 564 unmutated common ancestor (564 UCA); and 564. Development for murine IgG (green), counterstained with DAPI (blue) and phalloidin (red). Overlay of all three channels (top row) or mIgG channel alone (bottom row). (I) Representative examples of the different staining patterns observed for cloned sequences from single GC: perinuclear (G1_M25), predominantly cytoplasmic (G2_M05), cytoplasmic+nucleolar (G4_G22), and nuclear stain with nucleolar exclusion (G4_G55). Channel intensity was adjusted to facilitate visualization of the pattern. (J) Quantified staining intensities based on CellProfiler analysis of raw images. Nuclear staining, cytoplasmic staining, and the sum of the two (left to right). Cloned antibodies are grouped according to GC origin as indicated. The threshold for background signal, defined as the upper limit of the 95% confidence interval for the mean signal in the negative control (6649), is indicated with a horizontal dotted line. Measurements for which the limit of the 95% confidence interval for the mean did not overlap with threshold were considered positive. Positive measurements are indicated in dark blue, while negative are light blue, and borderline are patterned. The positive control, hybridoma-derived 564 C11, is indicated in red. See also Figure S3.
Figure 4
Figure 4. WT GCs Depend on B Cell–Intrinsic TLR7 Signaling and Become Self-Sustained
(A) Overview of experimental approach for generation and analysis of TLR7+/+ and 564 TLR7−/− mixed 564 chimeras. (B) Splenic CD45.2 frequencies in the competition gate within CD4, CD8, CD19 and GC B populations of 564 TLR7+/+ (n=3) and 564 TLR7−/− (n=4) mixed chimeras. Mean±SEM, multiplicity-adjusted P values for two-way ANOVA with Dunnett’s posttest. Dotted line indicates the expected 50% frequency. (C) Overview of experimental layout for generating and analyzing 564 DTA mixed chimeras. (D) CD19 frequencies of untreated vs. treated 1:2 and 1:9 564 DTA mixed chimeras. Mean±SEM for 3 mice per group, multiplicity-adjusted P values for 2-way ANOVA with Tukey’s posttest, n.s.=not significant. (E) Similar to panel (D), but showing CD4 frequencies. (F) Similar to panel (D), but showing CD8 frequencies. (G) Frequencies of 564 BM-derived cells in mesenteric LN and spleen of untreated vs. treated 1:2 and 1:9 564 DTA chimeras. (H) As panel I, but showing GC B cell frequencies. See also Figures S4 and S5.
Figure 5
Figure 5. Clonal Evolution in Autoreactive GCs in the Aid-Confetti Model
(A) Overview of experimental setup for generating and analyzing Aid-Confetti mixed 564 chimeras. (B) Frequency of most (1st), second most (2nd) and their sum observed in individual splenic GC at Day 3, 14, and 31 post-tamoxifen induction of Confetti recombination in NP-CGG-immunized Confetti chimeras. The mean of an average of 7.8 GC per spleen for 2 mice per time point is indicated by the bar. (C) As panel (B), but for 564 Confetti mixed chimeras. The mean of an average of 9.2 GC per spleen for 3 mice per time point is indicated by the bar. (D) Divergence index for the GC represented in (B) and (C). Significance indicated for two-way ANOVA with Tukey’s posttest (*=P<0.05, **=P<0.001). (E) Representative images used for quantification of color dominance. The scale bars indicate 100 µm. See also Figure S6, Movies S3 and S4.
Figure 6
Figure 6. The Convergence on Stereotypic Autoreactive Sequence Elements is Mirrored Serologically by Functional Epitope Spreading
(A) Volcano plot comparison of median IgG signal intensities in 564 mixed chimeras (n=8) relative to homozygous 564Igi mice (n=7), with indication of log2-fold change on the x-axis and significance level on the y-axis. (B) Bar graph representations of IgG (left column), IgG2a (middle column) and IgG2c (right column) Ab towards Ro60/SSA (top row), IFNγ (middle row) and dissociated GBM (bottom row) in sera of B6 (n=5), heterozygous (n=9), and homozygous (n=7) 564Igi mice. Mean±SEM, multiplicity-adjusted significance for one-way ANOVA with Dunn’s posttest. (C) Bar graph representations of IgG (left column), IgG2a (middle column), and IgG2c (right column) Ab towards Ro60/SSA (top row), IFNγ (middle row) and dissociated GBM (bottom row) in sera of 564 mixed chimeras (n=8) and 564K− mixed chimeras (n=6). Mean±SEM, multiplicity-adjusted significance for two-tailed Mann-Whitney test. See also Figure S7.
Figure 7
Figure 7. WT-Derived Autoantibodies Are Deposited in Kidneys of 564Igi mice and 564Igi mixed chimeras
(A) Representative immunofluorescence analysis of IgG2a (top) and IgG2c (bottom) deposition in glomeruli of kidneys from a homozygous 564Igi K− control, a homozygous 564Igi, a homozygous 564Igi mouse, and a 564Igi mixed chimera. Glomerular vessels defined by CD31 (red), nuclei counterstained with Hoechst (blue), Ab deposits in green. (B) Quantification of IgG2c Ab deposits within the glomerular area defined by CD31 staining. The analysis was based on an average of 2.5 images from each mouse for 564 homo K (n=1), 564 homo (n=1), 564het (n=2), and 564 mixed chimeras (n=3). Statistical significance for Kruskal-Wallis test with Dunn’s posttest. (C) Similar to B, but for IgG2a.

References

    1. Arbuckle MR, McClain MT, Rubertone MV, Scofield RH, Dennis GJ, James JA, Harley JB. Development of autoantibodies before the clinical onset of systemic lupus erythematosus. N Engl J Med. 2003;349:1526–1533. - PubMed
    1. Ayoglu B, Mitsios N, Kockum I, Khademi M, Zandian A, Sjöberg R, Forsström B, Bredenberg J, Lima Bomfim I, Holmgren E, et al. Anoctamin 2 identified as an autoimmune target in multiple sclerosis. Proceedings of the National Academy of Sciences. 2016;113:2188–2193. - PMC - PubMed
    1. Berland R, Fernandez L, Kari E, Han J-H, Lomakin I, Akira S, Wortis HH, Kearney JF, Ucci AA, Imanishi-Kari T. Toll-like receptor 7-dependent loss of B cell tolerance in pathogenic autoantibody knockin mice. Immunity. 2006;25:429–440. - PubMed
    1. Busse CE, Czogiel I, Braun P, Arndt PF, Wardemann H. Single-cell based high-throughput sequencing of full-length immunoglobulin heavy and light chain genes. Eur J Immunol. 2013;44:597–603. - PubMed
    1. Cappellano G, Orilieri E, Woldetsadik AD, Boggio E, Soluri MF, Comi C, Sblattero D, Chiocchetti A, Dianzani U. Anti-cytokine autoantibodies in autoimmune diseases. Am J Clin Exp Immunol. 2012;1:136–146. - PMC - PubMed