. 2017 Aug 25;13(8):e1005674.
doi: 10.1371/journal.pcbi.1005674. eCollection 2017 Aug.

Noise correlations in the human brain and their impact on pattern classification

Affiliations

Noise correlations in the human brain and their impact on pattern classification

Vikranth R Bejjanki et al. PLoS Comput Biol. .

Abstract

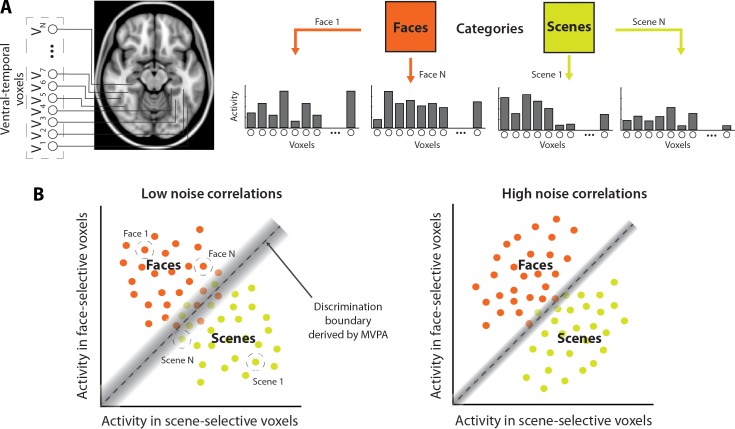
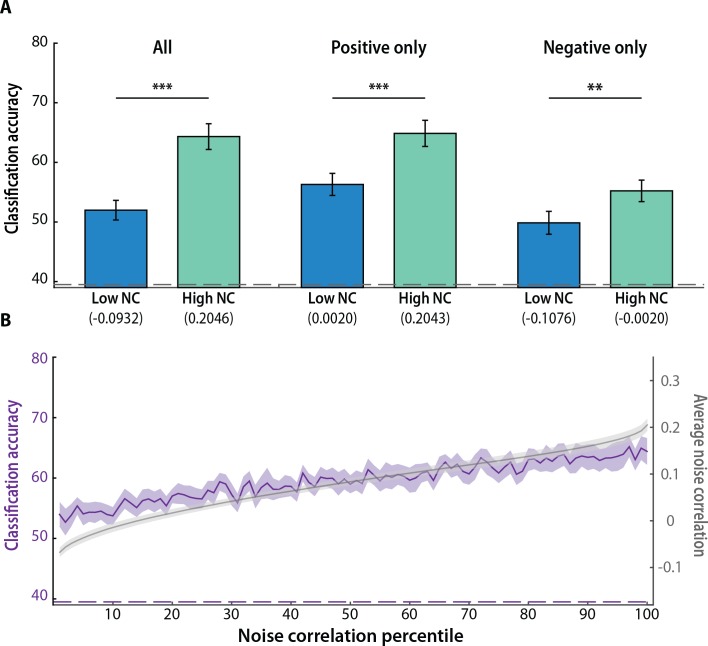
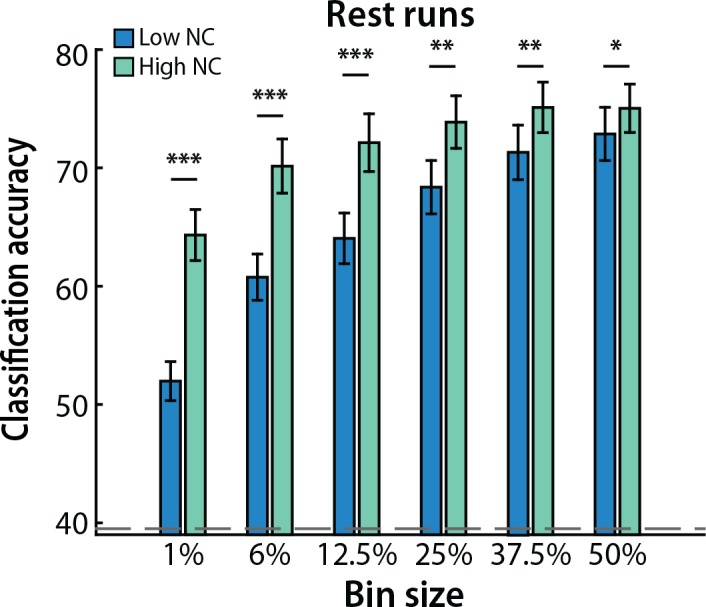
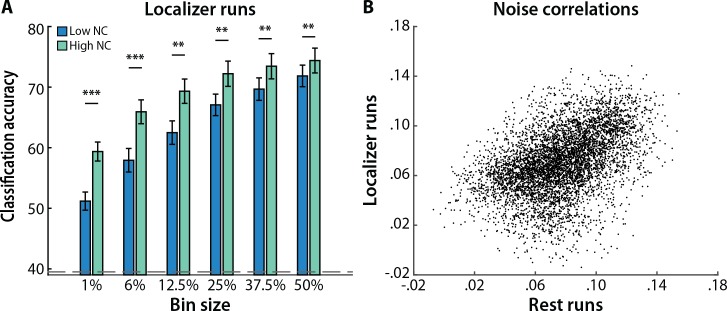
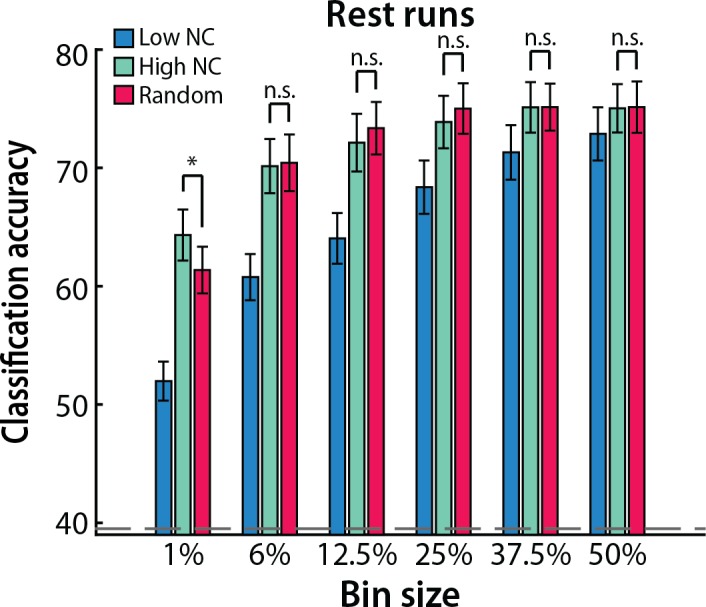
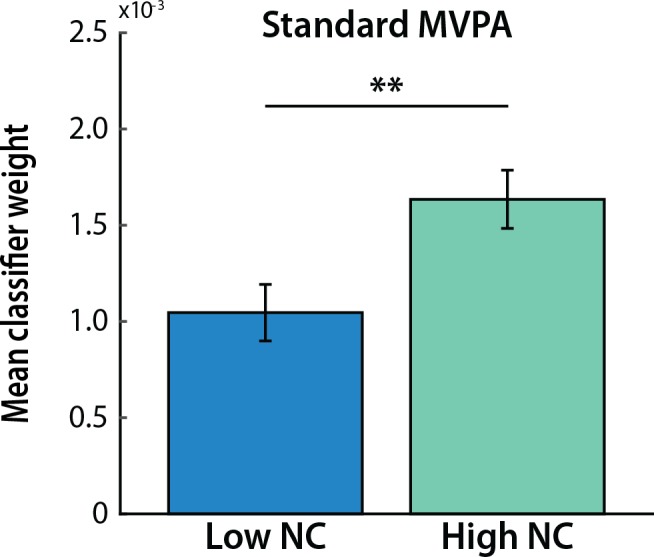
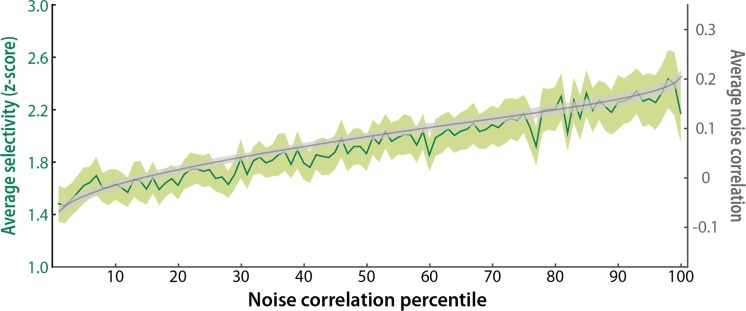
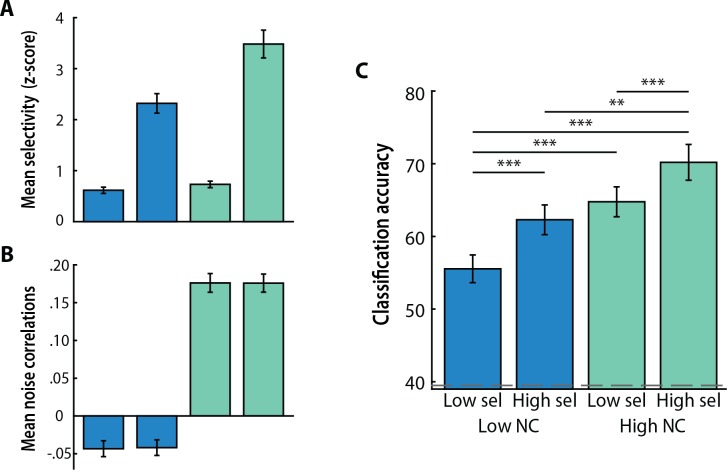
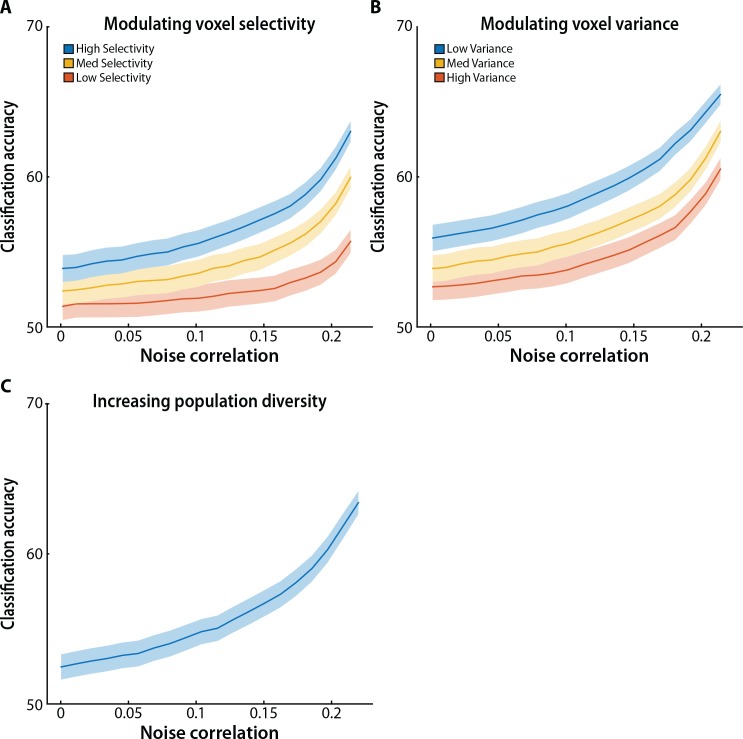
Multivariate decoding methods, such as multivoxel pattern analysis (MVPA), are highly effective at extracting information from brain imaging data. Yet, the precise nature of the information that MVPA draws upon remains controversial. Most current theories emphasize the enhanced sensitivity imparted by aggregating across voxels that have mixed and weak selectivity. However, beyond the selectivity of individual voxels, neural variability is correlated across voxels, and such noise correlations may contribute importantly to accurate decoding. Indeed, a recent computational theory proposed that noise correlations enhance multivariate decoding from heterogeneous neural populations. Here we extend this theory from the scale of neurons to functional magnetic resonance imaging (fMRI) and show that noise correlations between heterogeneous populations of voxels (i.e., voxels selective for different stimulus variables) contribute to the success of MVPA. Specifically, decoding performance is enhanced when voxels with high vs. low noise correlations (measured during rest or in the background of the task) are selected during classifier training. Conversely, voxels that are strongly selective for one class in a GLM or that receive high classification weights in MVPA tend to exhibit high noise correlations with voxels selective for the other class being discriminated against. Furthermore, we use simulations to show that this is a general property of fMRI data and that selectivity and noise correlations can have distinguishable influences on decoding. Taken together, our findings demonstrate that if there is signal in the data, the resulting above-chance classification accuracy is modulated by the magnitude of noise correlations.


Conflict of interest statement

The authors have declared that no competing interests exist.

Figures

Fig 1
Fig 1. An illustration of the influence of noise correlations on face/scene MVPA decoding.
(A) In a typical experiment, participants may be presented with a series of stimuli drawn from two or more categories (e.g. faces and scenes), while fMRI BOLD activity (illustrated here by gray bars) is measured in ventral temporal voxels, some of which exhibit a preference for faces (face-selective voxels), and others for scenes (scene-selective voxels). (B) Multivariate decoding methods such as MVPA seek to find a decision boundary (gray dashed line) in the high-dimensional space of voxel activity patterns (collapsed here, for illustrative purposes, to a 2-D space with activity across face-selective voxels on the ordinate, and activity across scene-selective voxels on the abscissa). Due to variability in BOLD activity, each category is represented by a distribution in this space, and classification errors result from overlap in these distributions (shaded region). When voxels selective for one of the categories have high noise correlations with voxels selective for the other category (scenario illustrated on the right), activity distributions can be elongated in the direction parallel to the discrimination boundary, resulting in reduced overlap (smaller shaded region) and improved classification accuracy.
Fig 2
Fig 2. Noise correlations and MVPA decoding.
(A) Classification accuracy was better for patterns of activity over voxels with high (top 1%) vs. low (bottom 1%) noise correlations in the raw distribution, and the positive values from the raw distribution; the same pattern held for negative values from the raw distribution, but with high and low defined as the top and bottom 6%, respectively (to accommodate the smaller sample of negative correlations). Columns represent means and error bars represent SEM across participants. The number below each column is the average noise correlation, across the voxels in the selected set and across all participants, provided for descriptive purposes. The dashed gray line denotes the baseline “chance” level of classification accuracy obtained by permuting the class labels 10,000 times. The classifier was trained on three classes (face, scene, and blank), but chance is not 33% because there were more blank samples. (B) Classification accuracy improved monotonically with an increase in the magnitude of noise correlations. The solid purple line represents mean classification accuracy in every percentile of voxels, and the ribbon represents SEM across participants. The solid gray line represents mean noise correlations in every percentile (for descriptive purposes, as this was the basis of sorting), and the ribbon represents SEM across participants. The dashed purple line denotes the empirically defined chance level of classification accuracy obtained from the permutation analysis. ***p < 0.001, **p < 0.01.
Fig 3
Fig 3. Number of voxels.
Classification accuracy was consistently better for patterns of activity over an increasing number of voxels with high (green) vs. low (blue) noise correlations, with a larger difference for smaller bin sizes. Columns represent means and error bars represent SEM across participants. The dashed gray line denotes permuted chance. ***p < 0.001, **p < 0.01, *p < 0.05.
Fig 4
Fig 4. Background noise correlations.
(A) Noise correlations calculated from localizer runs had a similar effect on MVPA as noise correlations computed from rest runs. Classification accuracy was again better for patterns of activity over voxels with high (green) vs. low (blue) noise correlations, with a similar interaction by bin size. Columns represent means and error bars represent SEM across participants. The dashed gray line denotes permuted chance. (B) The noise correlations calculated from rest runs were similar to the noise correlations calculated from localizer runs. Each dot represents one voxel, with its two coordinates reflecting the heterogeneous noise correlation (i.e., average correlation with voxels with opposite selectivity) from rest and localizer runs, respectively, averaged across participants for purposes of visualization. ***p < 0.001, **p < 0.01.
Fig 5
Fig 5. Randomly selected voxels.
Classification accuracy was similar for voxels selected for having high noise correlations (green) vs. voxels selected randomly (red), except for the 1% bin size where the high noise set outperformed the random set. Across all bin sizes, classification accuracy was the lowest for voxels selected for having low noise correlations (blue). Columns represent means and error bars represent SEM across participants. *p < 0.05.
Fig 6
Fig 6. Classifier weights.
A median-split analysis revealed that voxels with higher noise correlations were assigned higher weights than voxels with lower noise correlations. Columns represent means and error bars represent SEM across participants. **p < 0.01.
Fig 7
Fig 7. Selectivity and noise correlations.
Average selectivity increased monotonically as the magnitude of noise correlations increased. The solid green line represents mean selectivity in every percentile of voxels, and the ribbon represents SEM across participants. The solid gray line represents mean noise correlations in every percentile (for descriptive purposes, as this was the basis of sorting), and the ribbon represents SEM across participants. Each percentile included the same voxels as in Fig 2B.
Fig 8
Fig 8. Cumulative influence of selectivity and noise correlations.
Classification accuracy for voxels selected for having either low noise correlations and low or high selectivity (blue) or high noise correlations and low or high selectivity (green). Mean selectivity (A) and noise correlations (B) across voxels in each set. (C) Noise correlations can influence classification performance in a complementary manner to selectivity. The dashed gray line denotes chance. Columns represent means and error bars represent SEM across participants. Significance of pairwise comparisons is depicted here. ***p < 0.001, **p < 0.01.
Fig 9
Fig 9. Model simulations.
Classification accuracy improved monotonically with an increase in the magnitude of heterogeneous noise correlations in simulated populations of face- and scene-selective voxels. Solid lines represent mean classification accuracy as the magnitude of noise correlations increased, with all other parameters fixed. Ribbons represent SEM across model participants. (A) Overall classification accuracy dropped as voxel selectivity decreased. However, across all selectivity profiles, classification accuracy improved monotonically with an increase in the magnitude of noise correlations. (B) Overall classification accuracy dropped as voxel variance increased. However, across all levels of variance, classification accuracy improved monotonically with an increase in the magnitude of noise correlations. (C) Increasing diversity in the response properties of individual voxels within the simulated face- and scene-selective populations did not qualitatively change the pattern of results. Indeed, increasing population diversity led to a steeper improvement in classification accuracy as a function of noise correlations. See Methods for the parameter values used in each simulation.

Similar articles

Cited by

References

    1. Norman KA, Polyn SM, Detre GJ, Haxby JV. Beyond mind-reading: multi-voxel pattern analysis of fMRI data. Trends in cognitive sciences. 2006;10(9):424–30. doi: 10.1016/j.tics.2006.07.005 - DOI - PubMed
    1. Turk-Browne NB. Functional interactions as big data in the human brain. Science. 2013;342(6158):580–4. doi: 10.1126/science.1238409 - DOI - PMC - PubMed
    1. Yarkoni T, Poldrack RA, Nichols TE, Van Essen DC, Wager TD. Large-scale automated synthesis of human functional neuroimaging data. Nat Methods. 2011;8(8):665–70. doi: 10.1038/nmeth.1635 - DOI - PMC - PubMed
    1. Kanwisher N. Functional specificity in the human brain: A window into the functional architecture of the mind. PNAS. 2010;107(25):11163–70. doi: 10.1073/pnas.1005062107 - DOI - PMC - PubMed
    1. Kim H. Neural activity that predicts subsequent memory and forgetting: A meta-analysis of 74 fMRI studies. Neuroimage. 2011;54(3):2446–61. doi: 10.1016/j.neuroimage.2010.09.045 - DOI - PubMed