. 2017 Aug 25;13(8):e1005723.
doi: 10.1371/journal.pcbi.1005723. eCollection 2017 Aug.

Robust averaging protects decisions from noise in neural computations

Affiliations

Robust averaging protects decisions from noise in neural computations

Vickie Li et al. PLoS Comput Biol. .

Abstract

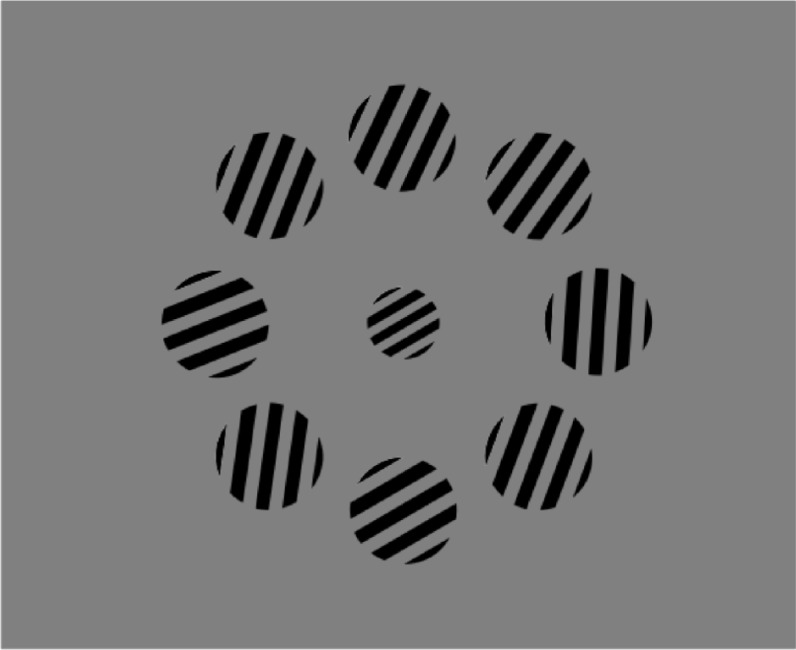
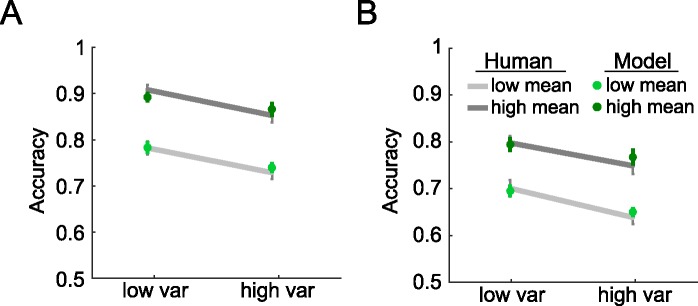
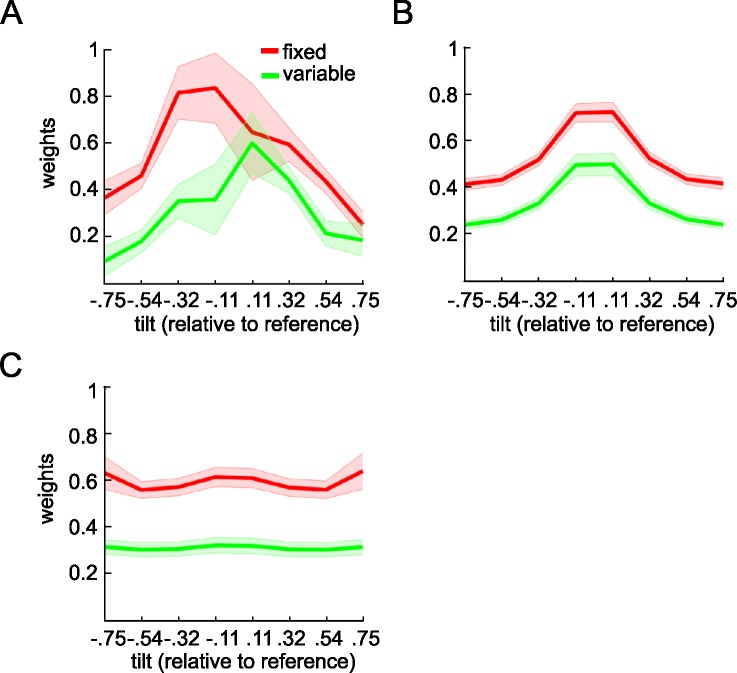
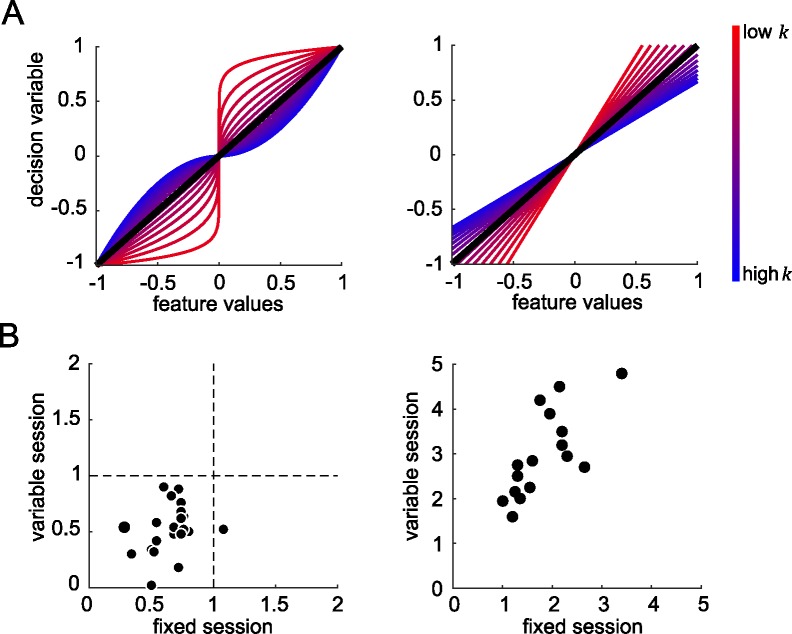
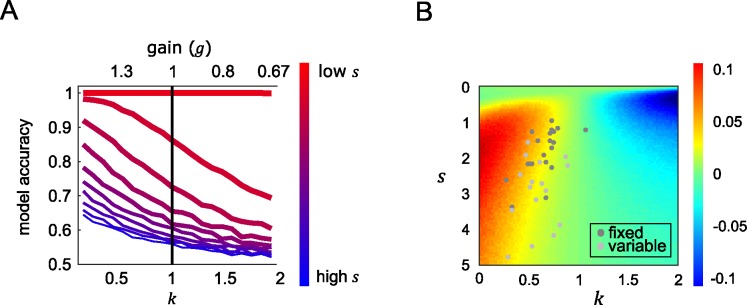
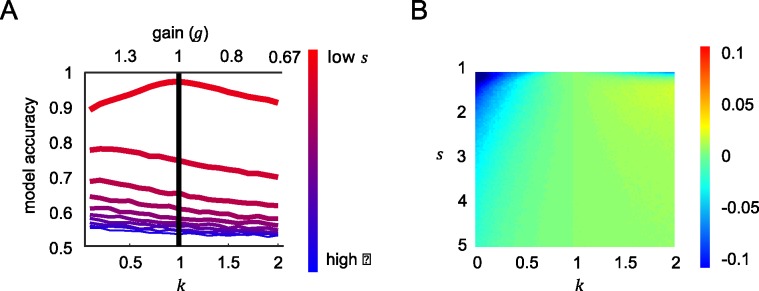
An ideal observer will give equivalent weight to sources of information that are equally reliable. However, when averaging visual information, human observers tend to downweight or discount features that are relatively outlying or deviant ('robust averaging'). Why humans adopt an integration policy that discards important decision information remains unknown. Here, observers were asked to judge the average tilt in a circular array of high-contrast gratings, relative to an orientation boundary defined by a central reference grating. Observers showed robust averaging of orientation, but the extent to which they did so was a positive predictor of their overall performance. Using computational simulations, we show that although robust averaging is suboptimal for a perfect integrator, it paradoxically enhances performance in the presence of "late" noise, i.e. which corrupts decisions during integration. In other words, robust decision strategies increase the brain's resilience to noise arising in neural computations during decision-making.


Conflict of interest statement

The authors have declared that no competing interests exist.

Figures

Fig 1
Fig 1. Schematic demonstration of the stimulus array.
The task was to report whether the average orientation of the outer ring of gratings fell clockwise or counter clockwise of the orientation of the central (reference) grating.
Fig 2
Fig 2. Model and human data.
Mean accuracy and the standard error of mean of human (grey lines) and model (green dots) for high and low variance conditions, with low mean (i.e. orientation close to the reference; light grey lines) and high mean (dark grey lines). Panel A shows performance in the fixed reference session, and the panel B shows the variable reference condition.
Fig 3
Fig 3. Parameter estimates of orientation of each grating relative to the reference.
The y-axis shows parameter estimates for a probit regression in which the angles of orientation of each grating (relative to the reference) were used to predict choice. Angles were tallied into 8 bins, from most negative to most positive relative to the reference, so that each parameter estimate shows the relative weight given to a particular portion of feature space. The x-axis shows the bin center of each bin. The inverted-U shape of the curve is a signature of robust averaging. Shaded areas are the standard error of mean. (A) Weighting functions estimated using human choices (B) Weighting functions for recreated model choices using the best fitting parameters from the power model using the best fitting parameters from human data. (C) Weighting functions for simulated model choice under a case in which angles are linearly mapped onto DV.
Fig 4
Fig 4. Mapping sensory inputs to decision values.
(A) Left panel: the different functions that map feature values (angles relative to the reference in radians) to decision values for the power model. Coloured lines represent functions for different values of k from 0.1 to 2, with low values represented by reddish lines and high values represented by bluish lines. Right panel: the equivalent functions for the equivalent gain linear model. In the left and right panels, models with equivalent gain are represented with lines of equivalent colour. (B) The best fitting k values (left panel) and s values (right panel) in human for fixed reference (x-axis) and variable reference session (y-axis).
Fig 5
Fig 5. Model accuracy.
(A) Simulated model accuracy for the power model under different values of exponent k (bottom x-axis, corresponding g is plotted on the top x-axis) and late noise (s; in a range of 0.05 to 5) in coloured lines with reddish (bluish) lines show simulations with lowest (highest) late noise. The black line is the accuracy of the model when items were allocated with equivalent gain and equally integrated (k = 1) (B) After simulating model accuracy of the equivalent gain linear model, performance difference between the power model and the linear model is shown in the coloured surface. Positive values (yellow-red) show parameters where the nonlinear model performance is higher than equivalent linear variants, and negative values (cyan-blue) show the converse. Best fitting k and s for each subject of the fixed (dark grey dots) and variable reference session (light grey dots) were displayed to show the performance gain relative to using linear weighting scheme.
Fig 6
Fig 6. Model accuracy under uniform distributions.
Panels A and B are equivalent to panel A and B for Fig 5. However, here the simulations are performed by drawing feature values from uniform random distributions, rather than those used in the human experiment.

References

    1. Wald A, Wolfowitz J. Bayes Solutions of Sequential Decision Problems. Proc Natl Acad Sci U S A. 1949;35(2):99–102. Epub 1949/02/01. ; PubMed Central PMCID: PMC1062969. - PMC - PubMed
    1. Ariely D. Seeing sets: representation by statistical properties. Psychol Sci. 2001;12(2):157–62. Epub 2001/05/09. doi: 10.1111/1467-9280.00327 . - DOI - PubMed
    1. Chong SC, Treisman A. Representation of statistical properties. Vision Res. 2003;43(4):393–404. Epub 2003/01/22. S0042698902005965 [pii]. . - PubMed
    1. Chong SC, Treisman A. Statistical processing: computing the average size in perceptual groups. Vision Res. 2005;45(7):891–900. Epub 2005/01/13. S0042-6989(04)00513-9 [pii] doi: 10.1016/j.visres.2004.10.004 . - DOI - PubMed
    1. de Fockert JW, Marchant AP. Attention modulates set representation by statistical properties. Percept Psychophys. 2008;70(5):789–94. Epub 2008/07/11. . - PubMed

LinkOut - more resources